
A Novel Adaptive Fuzzy Model for Image Retrieval
Payam Pourashraf
1
, Mohsen Ebrahimi Moghaddam
1
and Saeed Bagheri Shouraki
2
1
Department of Computer Engineering, Shahid Beheshti University, Tehran, 1983963113, Iran
2
Department of Electrical Engineering, Sharif University, Tehran, 1458889694, Iran
Keywords: Image Retrieval, Color, Texture, Fuzzy Measure, Fuzzy Integral, Adaptive Fuzzy.
Abstract: In many areas of commerce, medicine, entertainment, education, weather forecasting the need for efficient
image retrieval system has grown dramatically. Therefore, many researches have been done in this scope;
however, researchers try to improve the precision and performance of such system. In this paper, we present
an image retrieval method, which uses color and texture based approaches for feature extraction, fuzzy
adaptive model and fuzzy integral. The system extracts color and texture features from an image and
enhancing the retrieval by providing a unique adaptive fuzzy system that use fuzzy membership functions to
find the region of interest in an image. The proposed method aggregates the features by assigning fuzzy
measures and combines them with the help of fuzzy integral. Experimental results showed that proposed
method has some advantages and better results versus related ones in most of the time.
1 INTRODUCTION
In recent years the volume of digital images has
grown dramatically. So, automatically storing and
retrieving images together with fast and accurate
searching has become a challenge among
researchers.
In this way, a lot of researches have been done.
Old methods were initially based on text. In the
early 90s, Content-Based Image Retrieval (CBIR)
was proposed. In general, the aim of CBIR, is to
automatically extract visual features of images and
perform retrieval based on these visual contents.
One of the most influential methods is
SIMPLIcity (Wang et al., 2001). The base of the
system is to classify images into categories
semantically, such as textured-nontextured. It uses
k-means clustering algorithm, wavelet-based feature
extraction and LUV color space to segment an
image into regions. It also developed an Integrated
Region Matching (IRM) metric for finding similarity
between regions.
Another well-known algorithm is ISLBP
(Pandey and Kumar, 2011). ISLBP is an extension
on LBP. LBP extracts features based on distribution
of edges in the gray-scaled image. ISLBP extract
LBP values from R, G and B channel spaces and by
concatenating these features, it builds an inter LBP
histograms and used them for image retrieval
process.
It is quite clear that the same set of weights for
different features is far from human perception and
does not work well specially in the general-purpose
image retrieval domain.
In this paper, we describe an efficient fuzzy-
based approach to address a general purpose CBIR
problem. The main novelty of proposed system is in
proposing an adaptive fuzzy model which is placed
on horizontal and vertical image strips and through
them texture features are extracted. This model tries
to find the region of interest in each image and
increases the weight of the extracted features of that
part. This will enable us to deal with different types
of images and reduce the semantic gap.
The rest of the paper is organized as follows.
Section 2, covers the structure of proposed method
and feature selection process. Section 3 contains the
proposed adaptive fuzzy model as a method for
improving results of proposed signatures. Section 4
presents proposed approach for aggregation of the
signatures. The obtained experimental results are
given in Section 5 and section 6 concludes the paper.
2 THE PROPOSED METHOD
ARCHITECTURE
Architecture of the proposed system follows the
298
Pourashraf P., Ebrahimi Moghaddam M. and Bagheri Shouraki S. (2013).
A Novel Adaptive Fuzzy Model for Image Retrieval.
In Proceedings of the 2nd International Conference on Pattern Recognition Applications and Methods, pages 298-302
DOI: 10.5220/0004266702980302
Copyright
c
SciTePress

usual image retrieval systems, in such a way that it is
formed by two main parts, the "Feature Extraction"
and the "Search and Retrieval".
In retrieval system, after receiving the query
image, its features are extracted by the "Feature
Extraction" part and the feature vector is compared
by entire database using a similarity measure, so the
similarity of feature vectors of query image with all
the database images is calculated. At the end, k
nearest images to the query image is returned.
2.1 Feature Extraction Unit
The “Feature Extraction” unit is a key part in image
database systems. However, depending on the
method used and the application field, various
features can be extracted.
2.2 Color Feature Extraction
For color feature extraction, we should first choose a
suitable color model. For this work, we choose Lab
color model because of its perceptual uniformity
(have an equivalent distance in the color space
corresponds to equivalent differences in color). In
this method, at first the image is divided to some
equal size blocks. Then from each block in the Lab
space some features are extracted. For image
blocking the most important issue is block size. For
finding appropriate block size many simulations
were carried out. Consequently, a 1010 grid placed
over each image. In each block of color, three color
moments are computed per channel (9 moments).
These moments are chosen because they are very
efficient for quick search in image retrieval systems
and also they are scale and rotation invariant.
Before putting these moment values in a
histogram we normalized them by using (1).
X=
(1)
Where X
and X
are maximum and minimum
between all values.
We used three 4-d histograms in such a way that
each histogram includes the moments of L, a, and b
channel. By doing this the spatial relation between
these values is preserved in each pixel thus the
relative quality of results improves.
2.3 Texture Feature Extraction
For taking advantage of both global and local
characteristic of image, we use two methods for
texture feature extraction.
For global texture we use Tamura texture
features (Tamura et al., 1978). Tamura textures are
six features which correspond to human visual
perception: coarseness, contrast, directionality, line-
likeness, regularity, and roughness. From
experiments to test the importance of these features
with respect to human perception, it was derived that
the first three features are very significant, and the
last three features are correlated to them and does
not make much improvement in the results
(Bergman, 2002). So, in proposed work we use
coarseness, contrast, and directionality. We extract
these features from each image and normalize them
using (1). Finally a 3-dimension feature vector is
generated for each image in the database and these
vectors are compared using the Euclidean distance.
For local texture features we use Gabor filter.
Gabor filters have been widely used for Texture
analysis (Jain and Farrokhnia, 1991); (Daugman,
1988). Here we use mean and standard deviation
descriptors derived from Gabor features. We extract
Gabor features in four different orientations and four
different scales that leading us to 32 values.
But prior to this it was necessary to divide the
image to blocks. Unlike the color characteristics that
square blocks were the best option available for
them, this kind of blocks is not suitable for texture
modelling. Rectangular blocks was a good choice
because in many images, especially natural ones the
rectangular strips were detected. Thus we segment
each image to 20 rectangular horizontal blocks, and
20 rectangular vertical blocks. The blocks width is
equal to 16 and its length is equal to the length and
width of an image, respectively, for horizontal and
vertical blocks. So, from each image 40*32=1280
values is extracted. We normalize these values using
(1).
3 THE ADAPTIVE FUZZY
MODEL
An issue that attracts our attention was that all
extracted strips do not have equal weights. In other
words, our beliefs in the importance of the various
strips are different. So this issue encouraged us to
use fuzzy logic to model this part of the work.
Generally in each image, the most important data
is concentrated in the centre of the image and as we
move away from the centre of the image the
importance of the regions decreases, hence the
significance of the strips will flowingly decrease. To
model this complexity we define two membership
functions (MFs) for each image, one on the x-axis
for vertical blocks and the other on the y-axis for
ANovelAdaptiveFuzzyModelforImageRetrieval
299
horizontal blocks. We have a variety of different
options for the shape of MFs (Triangular,
Rectangular, Gaussian, etc.). Gaussian MF is a good
candidate because of its flexibility and in addition to
that, in its Taylor series it contains other functions
within itself, so we have chosen it.
To further improve the work and because of our
region of interest that differs in each image, we
should derive an optimum MF from a set of MFs
which matches the image. Hence we need an
adaptive mechanism. To achieve this goal, we
considered different MFs on each axis so that, in
each image, with respect to the distribution of
objects one MF was chosen in each direction. We
need a measure for choosing between different MFs,
To do this after applying Gabor filter, we calculate
the energy in different scale and orientation of each
block. The more amount of this energy results in our
firmer belief in the strips. For fuzzifying these
values equation (1) is used.
To find the best MF on each axis and direction,
the equation (2) can be used.
Ci max
∈
μ1
k
μ2k
∈
(2)
Where μ1 is the Gaussian MF, μ2 is the MF from
the energy of each block, M is the set of Gaussian
MFs, A is the center point of each block and C is the
best MF among all MFs.
The operation was done here was in fact the
operation between two MFs so that instead of using
crisp operators (add and multiply), it is better to use
fuzzy operators (max and min). So (2) is turn to (3).
C
i
max
∈
max
∈
min
μ1
k
,μ2
k
(3)
The remaining problem is to optimize the parameters
of MFs.
The equation of the Gaussian MF is given by (4):
f
x
1
√
2πδ
e
Q
1μ
δ
Q
nμ
δ
(4)
Q
x
1
√
2π
e
(5)
Where μ is mean, and δ is variance.The other
parameter is the area of the surface under the
Gaussian curve. We set this parameter to one,
because just in this case the narrowest MF contains
only one block. The other parameter that should be
set is ( δ. Practically the least value for sigma,
which belongs to the narrowest curve, should be
selected. The reason is that it should be narrow
enough to contain only one block. This value is
equal to the
√
. The largest sigma is produced when
our belief in all strips is equal, it is equal to half or
total length of the image.
The other important parameter is evaluation of
the rate of changes in Sigma. By sigma rate of
change we mean the Sigma change between
minimum and maximum of its amount per step.
This can be done in two ways arithmetic
progression and geometric progression and we have
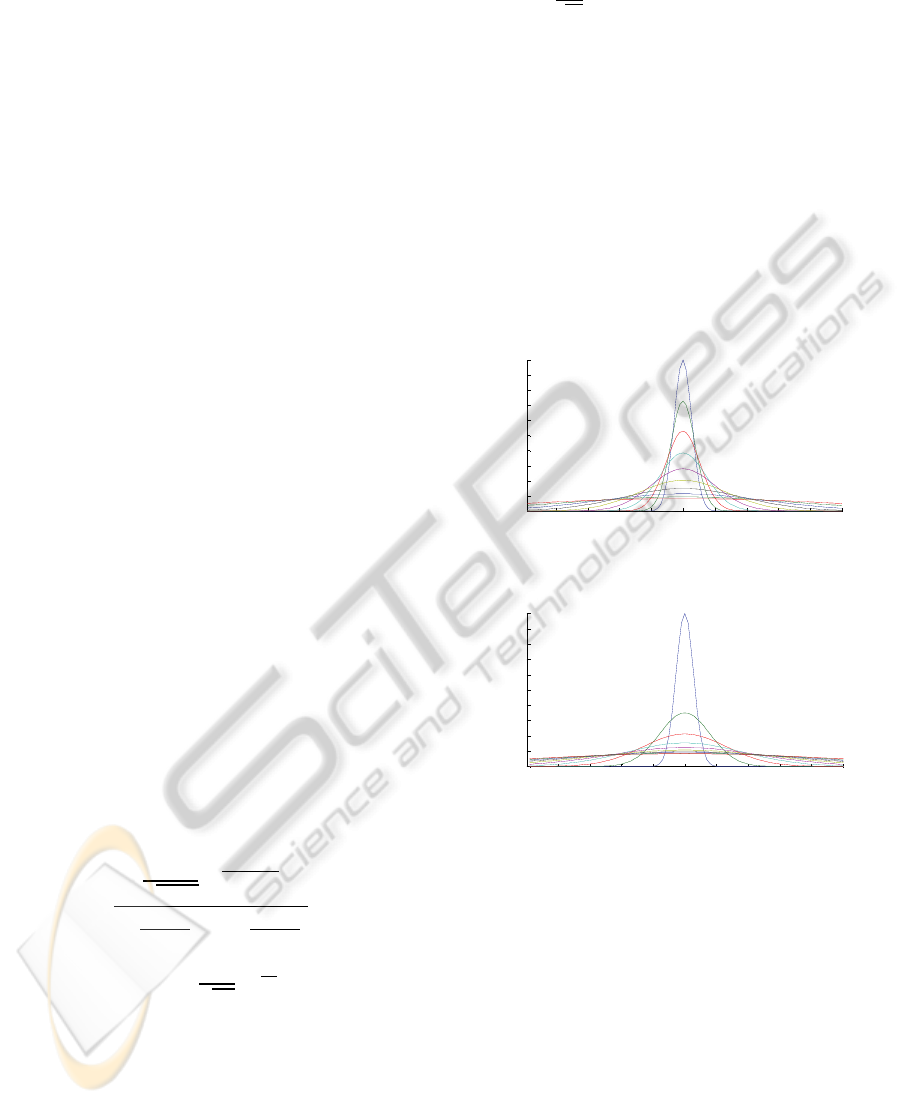
evaluated both of them. As in figure 1 and in figure
2, narrower curves for smaller values of sigma were
achieved in geometric progression and this is more
suitable for us, and that is due to Gaussian Kernel,
accordingly exponential change in the results will be
better for us.
Figure 1: Gaussian membership functions with geometric
progression of Sigma values.
Figure 2: Gaussian membership functions with arithmetic
progression of Sigma values.
Finally the mean and variance values obtained
from each block were put in histogram and their
frequencies were that of its MF value. Thus, from
each image in every axis and every direction and
every scale we have one histogram, which
eventually gives us 64 histograms per image. These
histograms are compared using the EMD (Rubner et
al., 2000). So we built a hierarchical adaptive fuzzy
model. In one layer of this hierarchical model, we
have Gaussian MFs and in other layer we have
energy MF. This model have two main advantages:
first, it is visually abstract and second, the
complexity of the system that is modelled is higher
than the complexity of applying each layer
individually.
10 20 30 40 50 60 70 80 90 100
0
0.1
0.2
0.3
0.4
0.5
0.6
0.7
0.8
0.9
1
Universe Of Discourse
Membership Grad
e
0 10 20 30 40 50 60 70 80 90 100
0
0.1
0.2
0.3
0.4
0.5
0.6
0.7
0.8
0.9
1
Universe Of Discourse
Members hi p Grade
ICPRAM2013-InternationalConferenceonPatternRecognitionApplicationsandMethods
300

4 RETRIEVING THE QUERY
IMAGE
After receiving the query image from the user, the
nearest images should be extracted and displayed to
the user. To carry out this, feature vectors of images
in the database are compared with the input image,
and k-nearest images are shown to the user.
For comparing color histogram we used EMD,
for Tamura texture features we use Euclidean
distance and for Gabor feature histograms we used
EMD. So for each feature, a number which
representing the distance was calculated. For
aggregation of these distances we use fuzzy integral
(Mesiar, 2005). For using fuzzy integral, it is
necessary to choose proper kind of integral. We have
used the Choquet integral that is one of the best ones
(Grabisch et al., 1992) in the proposed method.
We have a set with some distances, which each
distance is a result of a feature extraction method.
And a measure should be assign to each of them and
any combination of them. The problem is that, these
methods have some correlation and relation with
each other, because we had two methods for texture
extraction (Tamura and Gabor filter) and one
method for color feature extraction (histogram of
moments).
For assigning these measures we have used the
following rules:
Rule 1: “The method with better performance attains
a higher measure between 0 and 1”.
If x
and x
ϵ A and
Efficiency (x
) ≥Efficiency (x
) then
µ(x
) ≥µ(x
).
Rule 2: “The set which contains two methods which
are less similar to each other and extract different
features, their measure is super-additive”. Or,
If x
and x
ϵ X and x
and x
are not similar, then
µ(x
,x
) ≥ µ(x
) + µ(x
).
Rule 3: “A set which contains two methods
which are similar to each other and extract same
features conceptually, their measure is sub-additive”.
Or,
If x
and x
ϵ X and x
and x
are similar, then
µ(x
,x
) ≤ µ(x
) + µ(x
).
One of the most important steps in the proposed
method is assigning the appropriate measures that
represent the relation between the methods.
Here, we have three different methods, which all
of them were implemented separately. So, we had a
good knowledge of the performance of each of them.
By this knowledge and with the help of the rules
mentioned before we assigned the proper measures.
For this set which has three members, seven
measures are needed. Table 1 shows the assignments
of the measures for each of the 7 combinations.
Table 1: Fuzzy integral measure assignment.
Combinations Assignments
µ 1= µ ({d
})
0.55
µ 2= µ ({d
})
0.38
µ 3= µ ({d
})
0.07
µ 1,2= µ ({d
, d
})
0.95
µ 1,3= µ ({d
,d
})
0.70
µ 2,3= µ ({d
, d
})
0.4
µ 1,2,3= µ ({d
, d
, d
})
1
On the basis of our simulations, we considered
the following properties for attribution of measures:
Color moment histogram performs the best, Gabor
filter is the next and Tamura features performs the
worst among these methods. In assigning measures
to a double combination of these three methods,
their structure and the category that each of them is
belong to it, is important. Color moment and Gabor
filter are quite separate and belong to different
categories, so according to rule no. 2, their measure
should be super-additive. To assign the measure to
the pair of {d
,d
}, the same description
and rule is used. For assigning the measure to the
pair of d
,d
, we should consider that both
of these features try to extract the texture of the
image, so they are in the same class, hence
according to the rule 3, their assigned measure
should be sub-additive.
After assigning these measures to the methods,
Choquet integral was used to aggregate them. After
performing the fuzzy integral, the final distance of
two images was calculated.
As a final step, the first k images are shown to
the user via user-interface.
5 EXPERIMENTAL RESULTS
We have tested our method with a general-purpose
image dataset of about 1000 images of 10 semantic
categories (Africans, Beaches, Buildings, Buses,
Dinosaurs, Elephants, Flowers, Horses, Mountains,
Foods) from COREL, which is called SIMPLIcity
dataset. Each category includes 100 images.
We compare the accuracy of proposed method
with SIMPLIcity and ISLBP. To provide results, we
tested all of the images in the dataset. If the retrieved
ANovelAdaptiveFuzzyModelforImageRetrieval
301
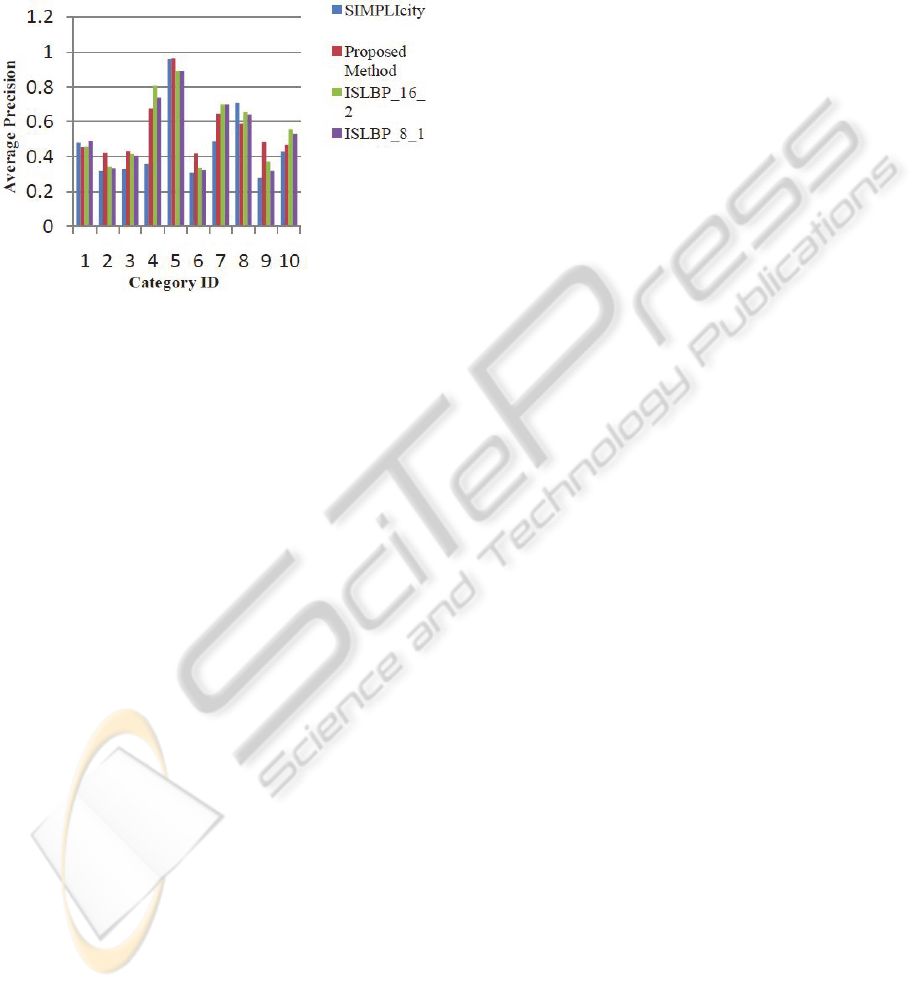
image belongs to the same category, is just
considered as a match.
To get the efficiency of proposed method, we
used the p (precision or average precision), as the
comparison parameter (Wang et al., 2001). The
experimental result is shown in Figure 3.
Figure 3: Comparing proposed method with SIMPLIcity
and ISLBP methods on average precision.
It is clear that proposed method performs better
than SIMPLIcity in all the classes except Africans,
Buses and Horses classes. In comparison with
ISLBP method, although it performs better than us
in several classes, but its total average precision for
all of the classes is 55.4 but our precision is 55.6,
which shows that totally we performs better in this
parameter.
6 CONCLUSIONS
This paper provides a new approach for image
retrieval on the basis of fuzzy thinking. We integrate
color and texture properties for image retrieval, and
use fuzzy logic to improve the efficiency of the
proposed method. The main contribution of our
work is to adaptively weight different part of the
region based on a hierarchical fuzzy model. This
model can be easily extended to different features
like color. We configure the model by tuning its
different parameters. This configuration is extracted
from the nature of problem. We also use fuzzy
integral for improve our results.
For extending this framework, it is recommended
to integrate proposed model with Content-Free
Image Retrieval (CFIR) techniques (Yin et al.,
2008), which is predicted to be the next generation
of image retrieval systems.
REFERENCES
Wang, J. Z., Li, J., & Wiederhold, G., (2001). SIMPLIcity:
Semantics-sensitive integrated matching for picture
libraries. Pattern Analysis and Machine Intelligence,
IEEE Transactions on, 23(9), 947-963.
Pandey, D., & Kumar, R., (2011). Inter space local binary
patterns for image indexing and retrieval. Journal of
Theoretical and Applied Information Technology,
32(2).
Tamura, H., Mori, S., & Yamawaki, T., (1978). Textural
features corresponding to visual perception. Systems,
Man and Cybernetics, IEEE Transactions on, 8(6),
460-473.
Bergman, L. D., (2002). Image databases. V. Castelli
(Ed.). Wiley.
Jain, A. K., & Farrokhnia, F., (1991). Unsupervised
texture segmentation using Gabor filters. Pattern
recognition, 24(12), 1167-1186.
Daugman, J. G., (1988). Complete discrete 2-D Gabor
transforms by neural networks for image analysis and
compression. Acoustics, Speech and Signal
Processing, IEEE Transactions on, 36(7), 1169-1179.
Rubner, Y., Tomasi, C., & Guibas, L. J., (2000). The earth
mover's distance as a metric for image retrieval.
International Journal of Computer Vision, 40(2), 99-
121.
Mesiar, R., (2005). Fuzzy measures and integrals. Fuzzy
Sets and Systems, 156(3), 365-370.
Grabisch, M., Murofushi, T., & Sugeno, M., (1992). Fuzzy
measure of fuzzy events defined by fuzzy integrals.
Fuzzy Sets and Systems, 50(3), 293-313.
Yin, P. Y., Bhanu, B., Chang, K. C., & Dong, A., (2008).
Long-term cross-session relevance feedback using
virtual features. Knowledge and Data Engineering,
IEEE Transactions on, 20(3), 352-368.
ICPRAM2013-InternationalConferenceonPatternRecognitionApplicationsandMethods
302
