
Data Mining for Real-Time Intelligent Decision Support System in
Intensive Care Medicine
Filipe Portela
1
, Manuel Filipe Santos
1
, Álvaro Silva
2
, José Machado
3
,
António Abelha
3
and Fernando Rua
2
1
Centro Algoritmi, Universidade do Minho,Guimarães, Portugal
2
Serviço de Cuidados Intensivos, Centro Hospitalar do Porto, Hospital Santo António, Porto, Portugal
3
Centro de Ciências e Tecnologias de Computação, Universidade do Minho, Braga, Portugal
Keywords: Data Mining, Real time, Intelligent Decision Support Systems, Intensive Medicine.
Abstract: The introduction of Intelligent Decision Support Systems (IDSS) in critical areas like Intensive Medicine is
a complex and difficult process. The professionals of Intensive Care Units (ICU) haven’t much time to
register data because the direct care to the patients is always mandatory. In order to help doctors in the
decision making process, the INTCare system has been deployed in the ICU of Centro Hospitalar of Porto,
Portugal. INTCare is an IDSS that makes use of data mining models to predict the outcome and the organ
failure probability for the ICU patients. This paper introduces the work carried out in order to automate the
processes of data acquisition and data mining. The main goal of this work is to reduce significantly the
manual efforts of the staff in the ICU. All the processes are autonomous and are executed in real-time. In
particular, Decision Trees, Support Vector Machines and Naïve Bayes were used with online data to
continuously adapt the predictive models. The data engineering process and achieved results, in terms of the
performance attained, will be presented.
1 INTRODUCTION
The adoption of Intelligent Decision Support
Systems (IDSS) in Intensive Care is increasing and
its importance to the decision making process is very
significant. The professionals of Intensive Care
Units (ICU) want a system that can help in the
decision process providing some important
knowledge at the right time, i.e., anywhere and
anytime. To this end it is fundamental to make IDSS
capable to operate autonomously and in real-time,
giving the results in the right moment of the decision
making. The most difficult tasks of an IDSS which
operates in critical environments is the acquisition,
the processing and the transformation of the data
automatically and in real-time.
To resolve these problems, a project called
INTCare was developed. INTCare has as main goal
the deployment of a Pervasive and real-time IDSS
for intensive medicine by the use of Data Mining
(DM) techniques to predict organ failure and patient
outcome (Gago et al., 2006; Vilas-Boas et al.,
2010). In order to meet these goals, special
requirements were taken into account relatively to
the environment and to the information system
architecture. It was also necessary to develop a real-
time data acquisition and processing system. This
system can automatically receive and process the
patient data, making it immediately available to
obtain knowledge. This approach enabled the
automation of all Knowledge Discovery in Database
(KDD) in real-time. These tasks are performed by a
set of intelligent agents. Taking advantage of the
data provided from the transformation phase, some
DM models are induced using three techniques:
Support Vector Machine (SVM), Decision Trees
(DT) and Naïve Bayes (NB). At the end, the results
obtained are used to analyse / compare the
performance of each technique. These techniques are
assessed in terms of accuracy, sensibility and
sensibility. All tasks of the KDD were carefully
implemented and tested with real data from the
patients admitted in ICU of Hospital Santo António,
Centro Hospitalar do Porto in Portugal. In addition,
to automate all KDD process were used: the most
270
Portela F., Santos M., Silva Á., Machado J., Abelha A. and Rua F..
Data Mining for Real-Time Intelligent Decision Support System in Intensive Care Medicine.
DOI: 10.5220/0004253702700276
In Proceedings of the 5th International Conference on Agents and Artificial Intelligence (ICAART-2013), pages 270-276
ISBN: 978-989-8565-39-6
Copyright
c
2013 SCITEPRESS (Science and Technology Publications, Lda.)

recent data (streamed data) and a different
transformation technique: discretization. The
technique previously used (Portela, 2012): Bin TopN
presented worst values with the most recent data.
The main objective of this work is understands
which is the best model to each measure (sensibility,
accuracy and specificity).
This document is organized in nine sections.
After this introduction, the second section does a
contextualization of the paper and presents the DM
techniques used. The next five sections explain the
KDD phases: at first, it is presented the first two
phases and then the automation of the transformation
process is depicted. Sixth section introduces the DM
models and the configurations set. The seventh
section gives an evaluation of the results obtained by
DM. Then, the results are discussed in the chapter
eight. Finally, the last chapter presents the
conclusions and considers future work.
2 BACKGROUND
2.1 INTCare
The main reason in favour of the development of
INTCare was the good results obtained using offline
data (Silva et al., 2008). These results led us to
induce data mining models in an online way and in
order to predict the patient organ failure and patient
outcome in real time. The big challenge is the
development of some procedures which use all the
values obtained by the data acquisition system
instead of using hourly generated values. Each
process is autonomous and implemented in terms of
intelligent agents to perform some tasks (Santos et
al., 2011).
2.2 Knowledge Discovery Process
Knowledge Discovery from Databases (KDD) is
recognized as a process that can obtain new
knowledge from data. This process is composed by
five stages: Selection, Pre-Processing,
Transformation, Data Mining and Interpretation
(Fayyad et al., 1996).
In the ICU the database is populated with data
from seven major sources. The data are selected
from the data warehouse and then processed or
transformed according to the goal of each variable.
After this task, the data are available to create data
mining models. Finally, all models are evaluated and
the best results are used to concretize knowledge and
to be presented in the INTCare System.
2.3 Data Mining
Considering the targets, it is a classification problem
(Han and Kamber, 2006). Bearing in mind this point
and the idea of having a pervasive and real-time
IDSS, a set of DM solutions was explored. To
implement an autonomous and real-time adaptive
system using data mining, Oracle Data Mining
(ODM) appears to be the best solution (Tamayo et
al., 2005). Three techniques were explored: Decision
Trees (DT), Support Vector Machine (SVM) and
Naive Bayes (NB) (Concepts, 2005).
3 DATA SELECTION
The first phase of KDD uses the INTCare data
acquisition system (Portela et al., 2011); (Portela et
al., 2011); (Portela et al., 2011) to obtain the data.
Most of these data are acquired using streaming data
acquisition techniques (Gama and Gaber, 2007;
Gama and Rodrigues, 2007). The data can be
acquired in a continuous and automatic way to the
database or it can be stored moments after be
available. The data for DM models are selected from
eight tables:
ICU_HL7_T (T1) contains all Vital Signs collected
by gateway;
ICU_PARAM (T2) contains the min and max
values for ICU and critical events (CE) for each vital
signs value;
ICU_LR (T3) contains all the results provided by
laboratory;
ICU_DRUGS (T4) contains all patient therapeutics
executed;
ICU_ENR (T5) contains all manually data inserted
in ENR and the values manually validated by the
ICU professionals;
ICU_CEVENTS (T6) contains all patient events,
their date and duration and event type;
EHR_ADMIN (T7) contains all variables obtained
at patient admission;
EHR_OUT (T9) contains the id of the patients who
died in hospital.
4 PRE-PROCESSING
In the pre-processing phase, the selected data are
validated, i.e. the collected values should be
included in the normal ranges (T2) of ICU values
DataMiningforReal-TimeIntelligentDecisionSupportSysteminIntensiveCareMedicine
271

and possess a valid patient identification (PID). The
validation tasks are performed by an automatic
procedure. During this phase, some other procedures
are executed in order to prepare the Data Mining
input table. For instance, this procedure delimits the
dataset - only the values of the first five days are
considered and fill the static values as is case mix.
This process is applied to the values received
from three data sources: bedside monitors, electronic
nursing records and laboratory. All of the procedures
are ensured by pre-processing agent.
5 TRANSFORMATION
The transformation phase is autonomous and doesn’t
require a manual intervention. All tasks are
performed automatically and in real-time by the
intelligent agents. The next lines explain the DM
attributes and their domains (DOM):
SOFA
value has six variants and identifies if the
patient has a failure (1) or not (0) for each organ
system. SOFA(Cardio, Respiratory, Renal, Liver,
Coagulation, neurologic);
Case Mix is composed by three variables obtained
at patient admission. Case Mix = {Age, Admission
type, Admission from}
;
Critical Events Accumulated (ACE) is the number
of ACE verified for a patient during their admission.
ACE(ACE of Blood Pressure, ACE of Oxygen
Saturation, ACE of Heart Rate, ACE of Urine
Output);
Ratios1 (R1) is a set of metrics used to understand
the patient condition. Its ratio uses ACE and elapsed
time of stay. R1(ACE of BP/elapsed time of stay,
ACE of SO2/elapsed time of stay , ACE of
HR/elapsed time of stay , ACE of HR /elapsed time
of stay , ACE of Ur/elapsed time of stay , Total of
ACE / elapsed time of stay);
Ratios2 (R2) is another type of ratios and uses ACE,
the max number of ACE verified in a day and the
total ACE. R2(ACE of BP / max number of ACE of
BP, ACE of SO2/ max number of ACE of SO2 ,
ACE of HR / max number of ACE of HR (Q+) ,
ACE of Ur / max number of ACE of Ur , Total of
ACE , Total of ACE / Total ACE max );
Ratios (R) is a union of the two ratios set: R = R1 U
R2.
Outcome identifies if the patient is alive or not.
In order to obtain the values of DM attributes,
the Table 1 is used:
Table 1: DM attributes values.
ID Variable Min Max Value
Age - 18 46 1
- 47 65 2
- 66 75 3
- 76 130 4
Admission
Type
Urgent - - U
Programed - - P
Admission
From
Chirurgic - - 1
Observation - - 2
Emergency - - 3
Other ICU - - 4
Other Hospital - - 5
Other Situation - - 6
SOFA
Cardio BP (mean) 0 70 1
Dopamine 0,01 - 1
Dobutamine 0,01 - 1
Epi / Norepi 0,01 - 1
Renal Creatinine 1.2 - 1
Resp Po2/Fio2 0 400 1
Hepatic Bilirubin 1.2 - 1
Coagul Platelets 0 150 1
Neuro Glasgow 3 14 1
Outcome
Died 1
In this phase two transformation processes are
executed. The first process is applied to the
attributes presented in Table 1. For all CM variables,
a procedure verifies the value stored in the tables
and, according to Table 1 defines the DM attribute
value. To the SOFA cases, it is used the worst value
of the hour. This variable is binary: 0 describes
normality and 1 describes dysfunction/failure and
comprises the original SOFA. At the end of the hour,
a procedure is executed. It verifies the values
collected and defines SOFA_ATTRIBUTE value (0
or 1). The outcome value (live or died) is updated
according to the final state of the patient. The value
in the table is always 0 (live) until the patient die.
The second process is related with Critical
Events and uses table 3 to perform their tasks. Table
3 contains the data ranges of critical events and is
based in the CE table (table 2).
Table 2: The protocol for the out of range physiologic
measurements (adapted from Álvaro (Silva, et al., 2008) ).
BP (mmHg) SpO2 (%) HR (bpm) UR (ml/h)
N
ormal range 90 - 180 >= 90 60 - 120 >= 30
Critical event
a
>= 1h >= 1h >= 1h >= 2h
Critical event
b
< 60 <80
<
30 V> 180 <= 10
a Defined when continuously out of range, b Defined anytime.
ICAART2013-InternationalConferenceonAgentsandArtificialIntelligence
272

Table 3: CE Data Ranges (T2).
EvId Descr MinEC MaxEC MinVal
M
axVal
M
inAny
M
axAny
1011 BP 90 180 0 300 60
3000 SPO2 90 100 0 100 80
2009 HR 60 120 0 300 30 180
DIU UR 30 1000 0 1000 10
According to the Table 3, value can be normal (0),
critic (1) or too critic (2). This process is executed
through a cascade of trigger which is performed at
the moment when the value is collected.
To an event be critical is necessary achieving one
of the two characteristics (defined continuously out
of range or anytime). This procedure also calculates
the ACE and the ratios associated to each variable.
Finally, it calculates the total results of the hour. For
the real values (ACE and Ratios) a discretization
technique is used. The values are grouped and
categorized in accordance to a minimum and
maximum. Using this technique, the sets are defined
according to some rules using the respective average
(R1) or maximum (R2) of the values collected.
These ranges are flexible and are updated according
to the values collected in the ICU.
The ranges were created using a 7-point-scale
adapted from Clinical Global Impression - Severity
scale (CGI-S) (Guy, 1976). Table 4 presents the
rules to create the ranges. In the case of R1 (ratios
using elapsed time) is used the average of the values
collected. In the case of R2 (ratios using max
number of ACE) is used a percentage of the
maximum value obtained in the range.
Table 4: Discretization rules.
SET
R1 R2
Definition Average Maximum
> <= > <=
0 - 0% - 0% Inexistence
1 0% 25% 0% 10% Normal condition
2 25% 50% 10% 25% Borderline condition
3 50% 100% 25% 50% Mild condition
4 100% 150% 50% 75% Moderate condition
5 150% 200% 75% 90% Marked condition
6 200% 300% 90% 100% Severe condition
7 300% 1000% 100% 200% Extreme condition
Using Table 4 the ranges were obtained
according to the importance /significance of the
value to ICU. Table 5 presents the discretization
rules defined for each continuous value. At the top
of the table is the identification of the set. The left
column identifies the variable. In the middle of the
table are defined the ranges for each set. The R2min
and R2max are used by R2 (max number of ACE).
According to the percentage of the value, it is
categorized. These values were defined by ICU
doctors, but can be modified in the future.
Table 5: Discretization set of Data Mining Input.
SET 0 1 2 3 4 5 6 7
R1
BP
Min -0,1 0,000 0,011 0,021 0,042 0,063 0,084 0,126
Max 0 0,011 0,021 0,042 0,063 0,084 0,126 2,000
R1
O2
Min -0,1 0,000 0,017 0,034 0,068 0,102 0,136 0,204
Max 0 0,017 0,034 0,068 0,102 0,136 0,204 2,000
R1
HR
Min -0,1 0,000 0,005 0,010 0,019 0,029 0,038 0,057
Max 0 0,005 0,010 0,019 0,029 0,038 0,057 2,000
R1
TOT
Min -0,1 0,000 0,000 0,000 0,000 0,000 0,000 0,000
Max 0 0,000 0,000 0,000 0,000 0,000 0,000 2,000
R2
Min -0,1 0,000 0,100 0,250 0,500 0,750 0,900 1,000
Max 0 0,100 0,250 0,500 0,750 0,900 1,000 2,000
ACE
Min -0,1 0 3 5 8 10 12 15
Max 0 3 5 8 10 12 15 50
During the processes described above, a
procedure is responsible to get all the data generated
and store them in into the knowledge base for the
Data Mining. Finally, and after having all the values
correctly inserted in DM Input table, another
procedure runs to clean the bad values. All tasks are
executed by Data Mining agent.
6 MODELLING
In this phase 126 models were developed (6 targets
(renal, hepatic, coagulation, cardiovascular,
respiratory and outcome) x 7 models x 3 techniques
(DT, NB, SVM). During the modelling process the
neurologic system weren’t considered due to the
existence of high number of GSC data in fault. Data
mining models are a junction of the groups detailed:
M1 = CM ⊲⊳ACE
M2 = CM ⊲⊳ACE ⊲⊳ R
M3 = CM ⊲⊳ ACE ⊲⊳ R1
M4 = CM ⊲⊳ ACE ⊲⊳ SOFA
M5 = CM ⊲⊳ ACE ⊲⊳ SOFA ⊲⊳ R
M6 = CM ⊲⊳ ACE ⊲⊳ SOFA ⊲⊳ R2
M7 = CM ⊲⊳ ACE ⊲⊳ SOFA ⊲⊳ R1
With the purpose of automating this process, some
researches were done to know how to induce DM
models automatically. As a result it has been
possible to develop a procedure which executes the
DM engine in real time.
DataMiningforReal-TimeIntelligentDecisionSupportSysteminIntensiveCareMedicine
273
Data Mining (a
dm
) agent is the most important of
the INTCare Knowledge Management Subsystem. It
is responsible to the induction of models.
7 EVALUATION
The original dataset was divided into two data sets
using the holdout sampling method: 70% of the data
were considered for training and 30% for testing
(stratified by the target). For each model 10 runs and
the best absolute result has been considered.
Dataset Description:
Collection Time: 102 days
Patients Number: 95
Data Considered: Values of five first days
Exclusion criterion I: Patient with data collecting
intermittent;
Exclusion criterion II: Existence of null values;
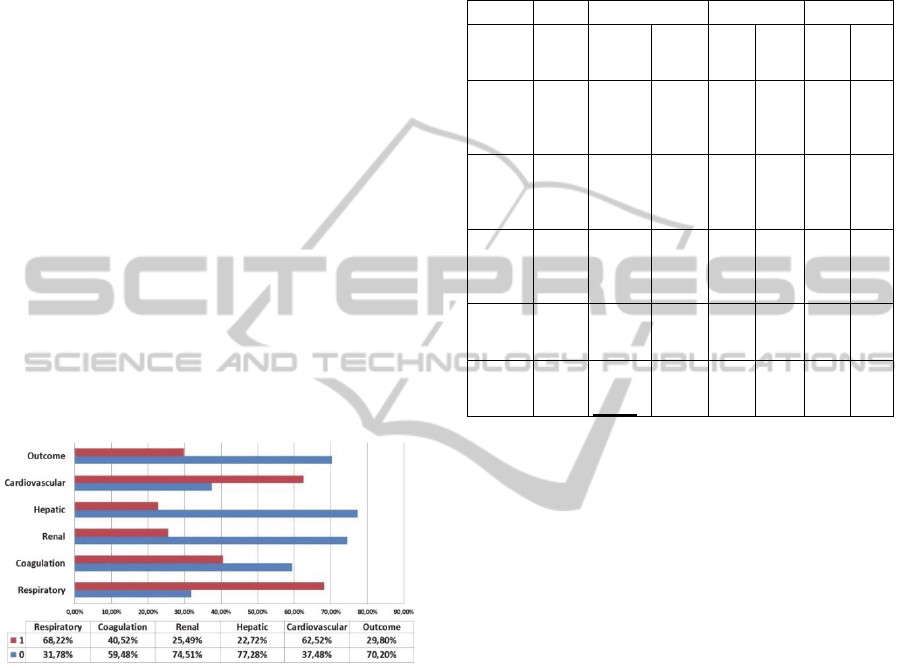
Figure 1 presents the distribution of the results
by target. For example, in the case of the respiratory
system 68,22% of the records present in dataset are
equal to 1.
Figure 1: Targets distribution.
After the DM engine has been executed, the best
results obtained for each target and techniques are
those presented in table 6. The models and results
were induced automatically.
Table 6 present all of the best results for each
target and technique. Each one of the measures has
an objective.
Depending on the cases / objectives /
environments, the correct measure is chosen in
accordance to the target:
a) Specificity – To predict 0;
b) Sensibility – To predict 1;
c) Accuracy – Global accuracy of the model.
In our case the better measure to use is the
sensibility, i.e., the objective of the system is being
good to predict 1 (organ failure or outcome). The
doctors prefer predict that something bad will
happen and avoid them instead of the opposite.
Table 6: Results by organ systems, technique and
outcome.
Target Tec. Sensibility Accuracy Specificity
Cardio
DT
NB
SVM
0,9958
0,5783
0,8141
M6
M3
M6
0,8593
0,6962
0,8159
M6
M3
M6
0,5841
0,9183
0,9756
M6
M1
M1
Respirat
DT
NB
SVM
0,1944
0,7986
0,7500
M6
M5
M1
0,4311
0,7287
0,6396
M
1-M3
M6
M4
1,0000
0,7535
0,5934
M1-
M4
M5
M4
Renal
DT
NB
SVM
0,5885
0,9504
0,6917
M
4-M6
M4
M5
0,8453
0,7646
0,8188
M3
M3
M4
1,0000
0,9000
0,9720
M1-
M3
M3
M6
Hepatic
DT
NB
SVM
0,1450
0,8543
0,8742
M1
M4
M5
0,8317
0,9163
0,9223
M1
M4
M5
1,0000
0,9579
0,9808
M1-
M6
M2
M6
Coagula
DT
NB
SVM
0,4723
0,9540
0,8067
M
3-M5
M4
M4
0,7019
0,7237
0,7761
M
3-M5
M4
M4
1,0000
0,8025
0,8631
M1
M2
M6
Outcome
DT
NB
SVM
0,6169
0,9709
1,0000
M
4;M5
M4
M
1;M4
0,8218
0,7597
0,7720
M
1-M3
M1
M4
0,9694
0,7922
0,6775
M6
M1
M4
8 DISCUSSION
The results show that there are a set of models which
present the same results. For example, for the
outcome two models present the maximum results
100% for sensibility. In particular, the outcome and
cardiovascular system present perfect results for
sensibility. The worst results are verified in terms of
accuracy. This happens due to the nature of the
problem and the difficulty to obtain efficient models
to predict both situations simultaneously. In terms of
sensibility the models presented interesting
performances, four targets (renal, coagulation,
cardiovascular and outcome) present a sensibility
higher than 95%. These results are in constant
changing due to the environment characteristics and,
the best model for today may not be the best for
tomorrow. Comparing all the three techniques used,
it is possible to observe that in general NB and SVM
techniques presented the best results in terms of
sensibility. Considering the nature of the problem (to
avoid organ failure and death), at start, the most
sensible models are used. In the case of respiratory
target the INTCare system uses the model M4
(SVM). When similar results are obtained, the
preference is for the model which also presents a
better accuracy. Table 7 gives an overview on the
ICAART2013-InternationalConferenceonAgentsandArtificialIntelligence
274

speed and transparency of the techniques and
characterises them in terms of the best accuracy,
sensibility and specificity.
Table 7: Classification algorithm comparison.
Feature Naive Bayes SVM Decision Tree
Speed Very fast
Very Fast and
Active
learning
Fast
Accuracy Respiratory
Hepatic,
Coagulation
Cardiovascular,
Renal, Outcome
Sensibility
Respiratory,
Coagulat,
Renal
Hepatic,
Outcome
Cardiovascular,
Hepatic, Renal
Specificity - Cardiovascular
Respirat, Renal,
Hepatic, Coagulat
Transparency
No rules
(black box)
No rules
(black box)
Rules
9 CONCLUSIONS
In this paper was demonstrated how to automate the
data acquisition process and how to predict organ
failure and patient outcome in real-time.
SVM and NB presented the best results in terms
of sensibility. DT models are the most specific.
SVM presented good performances with real-world
problems and classification cases. The main
difference between the SVM and the others is in the
use of active learning and their fast execution. In
general all models present very good results and
only need some calibration to be perfect.
The results obtained show that it is possible to
implement an Intelligent Decision Support System
in critical health environments without the need of
human intervention. During this project it was
possible to automate all KDD phases. INTCare is
now an autonomous system and can automatically
and in real-time predict the probability of organ
failure and outcome for the next 24 hours for the
patients admitted in the ICU. The DM engine
operates autonomously.
In the future, this system will be optimized and
more collected data will be used. In conclusion, the
doctors have now access to patient data collected
anywhere and anytime through the electronic
nursing record, and they can consult the probability
of organ failure or patient die in an intuitive, quick
and easy way. Due to the dynamic nature of this
environment, further experiments will consider the
ensemble approach. Future work also includes more
patient data (as they are admitted in ICU) in order to
improve the actual results and make the solutions
adaptive.
ACKNOWLEDGEMENTS
This work is supported by FEDER through
Operational Program for Competitiveness Factors –
COMPETE and by national funds though FCT –
Fundação para a Ciência e Tecnologia in the scope
of the project: FCOMP-01-0124-FEDER-022674.
The authors would like to thank FCT
(Foundation of Science and Technology, Portugal)
for the financial support through the contract
PTDC/EIA/72819/ 2006. The work of Filipe Portela
was supported by the grant SFRH/BD/70156/2010
from FCT.
REFERENCES
Concepts, O. D. M. (2005). 11g Release 1 (11.1). Oracle
Corp, 2007.
Fayyad, U. M., Piatetsky-Shapiro, G., & Smyth, P. (1996).
From data mining to knowledge discovery: an
overview.
Filipe Portela, F. P., Manuel Filipe Santos. (2012). Data
Mining Predictive Models For Pervasive Intelligent
Decision Support In Intensive Care Medicine. Paper
presented at the KMIS 2012 - International
Conference on Knowledge Management and
Information Sharing.
Gago, P., Santos, M. F., Silva, Á., Cortez, P., Neves, J., &
Gomes, L. (2006). INTCare: a knowledge discovery
based intelligent decision support system for intensive
care medicine. Journal of Decision Systems.
Gama, J., & Gaber, M. M. (2007). Learning from data
streams: processing techniques in sensor networks:
Springer-Verlag New York Inc.
Gama, J., & Rodrigues, P. P. (2007). Data stream
processing. Learning from Data Streams-Processing
Techniques in Sensor Networks, 25-39.
Guy, W. (1976). ECDEU assessment manual for
psychopharmacology: Rockville, Md.
Han, J., & Kamber, M. (2006). Data mining: concepts and
techniques: Morgan Kaufmann.
Portela, F., Gago, P., Santos, M. F., Silva, A., Rua, F.,
Machado, J., et al. (2011). Knowledge Discovery for
Pervasive and Real-Time Intelligent Decision Support
in Intensive Care Medicine. Paper presented at the
KMIS 2011- International Conference on Knowledge
Management and Information Sharing.
Santos, M. F., Portela, F., Vilas-Boas, M., Machado, J.,
Abelha, A., & Neves, J. (2011). INTCARE - Multi-
agent approach for real-time Intelligent Decision
Support in Intensive Medicine. Paper presented at the
3rd International Conference on Agents and Artificial
Intelligence (ICAART), Rome, Italy.
Silva, Á., Cortez, P., Santos, M. F., Gomes, L., & Neves,
J. (2008). Rating organ failure via adverse events
using data mining in the intensive care unit. Artificial
Intelligence in Medicine, 43(3), 179-193.
DataMiningforReal-TimeIntelligentDecisionSupportSysteminIntensiveCareMedicine
275

Tamayo, P., Berger, C., Campos, M., Yarmus, J.,
Milenova, B., Mozes, A. et al., (2005). Oracle Data
Mining. Data Mining and Knowledge Discovery
Handbook, 1315-1329.
Vilas-Boas, M., Santos, M. F., Portela, F., Silva, Á., &
Rua, F. (2010). Hourly prediction of organ failure and
outcome in intensive care based on data mining
techniques. Paper presented at the 12th International
Conference on Enterprise Information Systems.
ICAART2013-InternationalConferenceonAgentsandArtificialIntelligence
276
