
Exploring Assignment-Adaptive (ASAD) Trading Agents
in Financial Market Experiments
Steve Stotter, John Cartlidge and Dave Cliff
Department of Computer Science, University of Bristol
Merchant Venturers Building, Woodland Road, Bristol BS8 1UB, U.K.
Keywords:
Software Agents, Auctions, Financial Markets, Automated Trading, Computational Finance, ExPo.
Abstract:
Automated trading systems in the global financial markets are increasingly being deployed to do jobs previ-
ously done by skilled human traders: very often a human trader in the markets simply cannot tell whether
the counter-party to a trade is another human, or a machine. Clearly, automated trading systems can easily
be considered as “intelligent” software agents. In this paper we report on experiments with software trader-
agents running the well-known “AA” and “ZIP” strategies, often used as reference benchmarks in previously
published studies; here we suggest disambiguated standard implementations of these algorithms. Then, using
Exchange Portal (ExPo), an open-source financial exchange simulation platform designed for real-time be-
havioural economic experiments involving human traders and/or trader-agents, we explore the impact of intro-
ducing a new method for assignment adaptation in ZIP. Results show that markets containing only assignment-
adaptive (ASAD) agents equilibrate more quickly after market shocks than markets containing only “standard”
ZIP agents. However, perhaps counter-intuitively, in mixed heterogeneous populations of ASAD agents and
ZIP agents, ZIP agents outperform ASAD agents. Evidence suggests that the behaviour of ASAD agents act
as a new signal in the market that ZIP agents then use to beneficially alter their own behaviour, to the detriment
of the ASAD agents themselves.
1 INTRODUCTION
In 2001, a team of researchers at IBM reported on
a series of experiments to test the efficiency of two
adaptive trading-agent algorithms, MGD (Gjerstad &
Dickhaut, 1998) and ZIP (Cliff, 1997), when com-
peting directly against human traders (Das, Hanson,
Kephart, & Tesauro, 2001). Previous studies using
homogeneous trader populations of all-humans or all-
agents had indicated that, in both cases, trading in-
teractions within the populations rapidly and robustly
converged toward theoretically optimal, and stable,
dynamic equilibria. IBM’s results demonstrated for
the first time that, in heterogeneous populations mix-
ing human traders with trader-agents, both MGD and
ZIP consistently out-performed the human traders,
achieving greater efficiency by making more prof-
itable transactions. The IBM authors concluded with
a prescient statement, predicting that “in many real
marketplaces, agents of sufficient quality will be de-
veloped such that most agents beat most humans”.
Hindsight shows that they were correct: in many of
the world’s major financial markets, transactions that
used to take place between human traders are now
being fulfilled electronically, at super-human speeds,
by automated trading (AT) and high frequency trad-
ing (HFT) systems. AT and HFT systems are typ-
ically highly autonomous and dynamically adapt to
changes in the market’s prevailing conditions: for
any reasonable definition of software agent, it is clear
that AT/HFT systems can be considered as software
agents, even though practitioners in the finance indus-
try typically do not make much use of the phrase.
However, as the number of AT and HFT systems
has increased, and as the billions of dollars worth
of daily transaction volumes that they control has
steadily risen, a worrying gap has emerged between
theory and practice. Commercial deployments of
AT/HFT continue to proliferate (some major financial
markets are currently reporting that 50% or more of
transactions are now executed by automated agents),
yet theoretical understanding of the impact of trading
agent technologies on the system-level dynamics of
financial markets is dangerously deficient. To address
this problem, in 2010 the UK Government’s Office for
Science (UKGoS) launched a two year “Foresight”
77
Stotter S., Cartlidge J. and Cliff D..
Exploring Assignment-Adaptive (ASAD) Trading Agents in Financial Market Experiments.
DOI: 10.5220/0004248000770088
In Proceedings of the 5th International Conference on Agents and Artificial Intelligence (ICAART-2013), pages 77-88
ISBN: 978-989-8565-38-9
Copyright
c
2013 SCITEPRESS (Science and Technology Publications, Lda.)

project entitled “The Future of Computer Trading in
Financial Markets”.
1
One report commissioned by that project (and
published by UKGoS as De Luca, Szostek, Cartlidge,
& Cliff, 2011) attempted a replication of IBM’s study,
but with two extensions: firstly, trading agents used
the Adaptive Aggressive (AA) strategy, developed
by Vytelingum (2006), which had previously been
shown by De Luca and Cliff (2011b) to outperform
both MGD and ZIP; secondly, to increase the exper-
imental “realism”, order assignments to trade were
continuously replenished, thus producing a contin-
uous “drip-feed” market that more closely approx-
imates the real world, rather than a discrete, peri-
odic market as had been used in almost all prior ex-
perimental studies (De Luca et al., 2011). Results
showed that, under these experimental conditions,
agents were less efficient than human traders, with
slower markets hindering agent performance but en-
hancing human performance.
In this paper, we perform two sets of experiments.
Firstly, we replicate the continuous replenishment ex-
periments of De Luca et al. (2011) using ExPo: The
Exchange Portal (ExPo, 2012), an open-source plat-
form designed to facilitate financial trading experi-
ments between humans, agents, or both. However,
unlike De Luca et al. (2011), we study agent-only
markets. Perhaps surprisingly, we believe that this
is the first time agent-only markets have been studied
using continuous replenishment of order assignments.
For our trading agents, we use two well-known “ref-
erence” algorithms from the trading-agent literature,
AA (Vytelingum, 2006) and ZIP (Cliff, 1997).
In our second set of experiments, we introduce
“market shocks” to the system and explore a novel
extension to the reference algorithms, designed to
enable agents to take advantage of market shocks
(assignment-adaptive, or ASAD, agents). We demon-
strate that if all agents in the market are ASAD, then
the market is more efficient in the presence of mar-
ket shocks than if all agents are non-ASAD. However,
somewhat counter-intuitively, when the market is a
heterogenous mixture of ASAD and non-ASAD, non-
ASAD agents outperform ASAD agents by adapting
to the new price signals generated by ASAD agents.
The paper is organised as follows. In Section 2 we
review the literature on financial trading agent experi-
ments and the agent algorithms. In Section 3 we intro-
duce ExPo, our experimental platform, and describe
our experimental design. In Section 4 we present the
results from our two sets of experiments. Conclusions
are drawn in Section 5.
1
The final report from that investigation was published
in Oct. 2012, and is available at: http://bit.ly/UvGE4Q.
2 BACKGROUND
2.1 The Continuous Double Auction
An auction is a mechanism whereby sellers and buy-
ers come together and agree on a transaction price.
Several different auction mechanisms exist, each gov-
erned by a different set of rules. In this paper, we
focus on the Continuous Double Auction (CDA), the
most widely used auction mechanism and the one
used to control all the world’s major financial ex-
changes. The CDA enables buyers and sellers to
freely and independently exchange quotes at any time.
Transactions occur when a seller accepts a buyer’s
“bid”, or when a buyer accepts a seller’s “ask”. Al-
though it is possible for any seller to accept any
buyer’s bid, and vice-versa, it is in both of their inter-
ests to get the best deal possible at any point in time.
Thus, transactions execute with a counter party that
offers the most competitive quote.
Vernon Smith (1962) explored the dynamics of
CDA markets in a series of Nobel Prize winning ex-
periments using small groups of human participants.
Splitting participants evenly into a group of buyers
and a group of sellers, Smith handed out a single card
(an assignment) to each buyer and seller with a sin-
gle limit price written on each, known only to that
individual. The limit price on the card for buyers
(sellers) represented the maximum (minimum) price
they were willing to pay (accept) for a fictitious com-
modity, with strict instructions that they could not bid
(ask) a price higher (lower) than that shown on their
card. They were encouraged to bid lower (ask higher)
than this price, regarding any difference between the
price on the card and the price achieved in the market
as profit.
Experiments were split into a number of “trad-
ing days”, each typically lasting a few minutes. At
any point during the trading day, a buyer or seller
could raise their hand and announce a quote. When
a seller and a buyer agreed on a quote, a transaction
was made. At the end of each trading day, all stock
(sellers assignment cards) and money (buyer assign-
ment cards) was recalled, and then reallocated anew
at the start of each new trading day. By control-
ling the limit prices allocated to participants, Smith
was able to control the market’s supply and demand
schedules. Smith found that, typically after a couple
of trading days, human traders achieved very close to
100% allocative efficiency; a measure of the percent-
age of profit in relation to the maximum theoretical
profit available (see Section 2.2.2). This was a signif-
icant result: few people had believed that a very small
number of inexperienced, self-interested participants
ICAART2013-InternationalConferenceonAgentsandArtificialIntelligence
78

could effectively self-equilibrate.
2.2 Measuring Market Performance
An “ideal” market can be perfectly described by the
aggregate quantity supplied by sellers and the ag-
gregate quantity demanded by buyers at every price-
point (i.e., the market’s supply and demand sched-
ules). As prices increase, in general there is a ten-
dency for supply to increase, with increased poten-
tial revenues from sales encouraging more sellers to
enter the market; while, at the same time, there is a
tendency for demand to decrease as buyers look to
spend their money elsewhere. At some price-point,
the quantity demanded will equal the quantity sup-
plied. This is the theoretical market equilibrium. An
idealised theoretical market (and many real ones) has
a market equilibrium price and quantity (P
0
, Q
0
) de-
termined by the intersection between the supply and
demand schedules. The dynamics of competition in
the market will tend to drive transactions toward this
equilibrium point.
In the real world, markets are not ideal. They will
always trade away from equilibrium at least some of
the time. We can use metrics to calculate the “perfor-
mance” of a market by how far from ideal equilibrium
it trades, allowing us to compare between markets. In
this report, we make use of the following metrics:
2.2.1 Smith’s Alpha
Following Vernon Smith (1962), we measure the
equilibration (equilibrium-finding) behaviour of mar-
kets as α, the root mean square difference between
each of n transaction prices, p
i
(for i = 1. . . n) over
some period, and the P
0
value for that period, ex-
pressed as a percentage of the equilibrium price:
α =
1
P
0
s
1
n
n
∑
i=1
(p
i
− P
0
)
2
(1)
In essence, α captures the standard deviation of trade
prices about the theoretical equilibrium. A low value
of α is desirable, indicating trading close to P
0
.
2.2.2 Allocative Efficiency
For each trader, i, the maximum theoretical profit
available, π
∗
i
, is the difference between the price they
are prepared to pay (their “limit price”) and the the-
oretical market equilibrium price, P
0
. Efficiency, E,
is used to calculate the performance of a group of n
traders as the mean ratio of realised profit, π
i
, to the-
oretical profit, π
∗
i
:
E =
1
n
n
∑
i=1
π
i
π
∗
i
(2)
As profit values cannot go below zero (traders in
these experiments are not allowed to enter into loss-
making deals), a value of 1.0 indicates that the group
has earned the maximum theoretical profit available,
π
∗
i
, on all trades. A value below 1.0 indicates that
some opportunities have been missed. Finally, a value
above 1.0 means that additional profit has been made
by taking advantage of a trading counterparty’s will-
ingness to trade away from P
0
. So, for example, a
group of sellers might record an allocative efficiency
of 1.2 if their counterparties (a group of buyers) con-
sistently enter into transactions at prices greater than
P
0
; in such a situation, the buyers’ allocative effi-
ciency would not be more than 0.8.
2.2.3 Profit Dispersion
Profit dispersion is a measure of the extent to which
the profit/utility generated by a group of traders in the
market differs from the profit that would be expected
of them if all transactions took place at the equilib-
rium price, P
0
. For a group of n traders, profit disper-
sion is calculated as the root mean square difference
between the profit achieved, π
i
, by each trader, i, and
the maximum theoretical profit available, π
∗
i
:
π
disp
=
s
1
n
n
∑
i=1
(π
i
− π
∗
i
)
2
(3)
Low values of π
disp
indicate that traders are extracting
actual profits close to those available if all trades take
place at the equilibrium price P
0
; while higher values
of π
disp
indicate that traders’ profits differ from those
expected at equilibrium. The attraction of this statistic
is that it is not masked by zero-sum effects between
buyers and sellers (Gode & Sunder, 1993).
2.3 Algorithmic Traders
2.3.1 Zero-Intelligence Plus (ZIP)
Zero-Intelligence-Plus (ZIP) traders were developed
to overcome the provable shortcomings of Gode and
Sunder’s (1993) ZI-C agents (Cliff, 1997). ZIP agents
are profit-driven traders that adapt using a simple
learning mechanism: adjust profit margins based on
the price of other bids and offers in the market, and
decide whether to make a transaction or not. When a
decision to raise or lower a ZIP trader’s profit margin,
µ
i
(t), is taken, ZIP modifies the value using market
data and an adaptation rule based on the Widrow and
Hoff (1960) “delta” rule:
ExploringAssignment-Adaptive(ASAD)TradingAgentsinFinancialMarketExperiments
79

∆
i
(t) = β
i
(τ
i
(t) − p
i
(t)) (4)
where β
i
is the learning rate, p
i
is the quote price and
τ
i
is the target price (based on the price of the last
quote in the market). At time t, an update to the profit
margin, µ
i
, takes the form:
µ
i
(t +1) =
p
i
(t) + Γ
i
(t +1)
l
i
− 1
(5)
Γ
i
(t +1) = γ
i
(t) + (1 − γ
i
)∆
i
(t) (6)
where Γ
i
(t + 1) is the amount of change on the tran-
sition from t to t + 1, and γ
i
is the momentum coeffi-
cient. Given the limit price, l
i
, of the current assign-
ment, ZIP then updates its profit margin, µ
i
(t), based
on these trading rules, where the final quote price, p
i
,
is given as:
p
i
= l
i
(1 + µ(t)) (7)
The ZIP strategy has become a popular bench-
mark for CDA experiments. In their IBM study, Das
et al. (2001) concluded that ZIP was a dominant strat-
egy, beating humans in experimental trials and match-
ing the performance of their own modified GD (Gjer-
stad & Dickhaut, 1998) algorithmic trader. More re-
cently, ZIP has again been shown to outperform hu-
mans (De Luca & Cliff, 2011a, 2011b). However, it
is no longer considered the dominant agent strategy
(having been shown to be beaten by AA; see Sec-
tion 2.3.2). ZIP has also been tested against humans
in a continuous “drip-feed” market, where ZIP was
shown to be less efficient than humans (a result that
surprised the authors: De Luca et al., 2011; Cartlidge,
De Luca, Szostek, & Cliff, 2012). However, we be-
lieve that De Luca’s implementation of ZIP (OpEx,
2012) may have played some part in this result.
The original implementation of ZIP (Cliff, 1997)
was designed to handle only one limit price, had no
explicit notion of time and no persistent orders. So,
when Das et al. (2001) used ZIP to conduct their hu-
man vs. agent experiments, they adapted ZIP for their
platform. ZIP was altered to handle persistent orders,
and implemented an out-bid (for buyers) or under-cut
(for sellers) decision when an order remained open
for a certain amount of time without being traded.
Perhaps more importantly, ZIP was further modified
to have a vector of internal price variables, allow-
ing profit to be made at different values for differ-
ent assignments. This modification was similar to the
implementation that Preist and van Tol (1998) had
independently proposed in a previous study. Both
of these experiments also introduced a “sleep-time”,
where if no trade took place within a given time pe-
riod, they facilitated an automatic competitive price
movement, i.e., a price movement towards the best
value on the other side of the order book. Other ver-
sions of ZIP also appear in the literature. Vytelingum
(2006) forced ZIP (and presumably, also AA) algo-
rithms to update only the most profitable bid (for buy-
ers) or ask (for sellers) at any one time. This approach
was replicated in De Luca’s open-source implementa-
tion of ZIP and AA (OpEx, 2012).
Here, we test to see whether a ZIP implementa-
tion with multiple profit margins, ZIP
M
, is more ef-
ficient than a ZIP trader with a single profit margin,
ZIP
S
. As far as we are aware, this comparison has not
been directly tested before. We use ZIP
S
to describe
Vytelingum’s (2006) implementation, where only the
most profitable order is updated on every wakeup;
and ZIP
M
to denote an implementation of ZIP simi-
lar to that used by Tesauro and Das (2001), Das et al.
(2001), and Preist and van Tol (1998), such that ZIP
M
is capable of updating all profit margins for all orders
simultaneously. Every unique limit price received is
given a new µ and γ (the values of µ and γ are decided
at random when the agent is started) and all ZIP pa-
rameters are the same as those used in Cliff (1997).
2.3.2 Adaptive-Aggressive (AA)
Developed by Vytelingum (2006), the Adaptive-
Aggressive (AA) agent explicitly models “aggressive-
ness”; trading the opportunity of extra profit for the
certainty of transacting. Aggressive agents enter com-
petitive bids (or asks) for a quick trade, while passive
agents forgo the chance of a quick trade in order to
hold out for greater profit. To control the level of ag-
gressiveness, AA uses the Widrow and Hoff (1960)
delta learning rule that is also used in ZIP (equa-
tion 4). However, whereas ZIP uses learning to up-
date profit margin, AA updates an aggression param-
eter based on previous market information. At time,
t, AA estimates the competitive equilibrium price, p
∗
,
based on a moving window of historic market trans-
action prices; p
∗
is then used in AA’s long-term adap-
tivity component, which updates θ, a property of the
aggressiveness model. In this long-term adaptivity
component, an internal estimate of Smith’s α is cal-
culated, enabling the agent to detect and react to price
volatility. AA was developed to perform well in dy-
namic markets. Short-term learning is used to react to
the current state of the market, while long-term learn-
ing is used to react to market trends. AA has been
shown to dominate other agent strategies in the liter-
ature (Vytelingum, 2006; De Luca & Cliff, 2011b),
however, unlike ZIP, which has been independently
re-implemented by many different researchers, we be-
lieve the only replication of AA in the literature is De
Luca’s OpEx implementation (OpEx, 2012).
In Vytelingum’s original AA implementation, it
ICAART2013-InternationalConferenceonAgentsandArtificialIntelligence
80

is unclear how an agent should quote when the mar-
ket first opens and is empty. However, De Luca uses
the maximum bid or ask price allowed in the mar-
ket, P
max
= 400, to determine an agent’s initial quote
price, p
t=0
, such that p
t=0
is a random variable from a
uniform distribution with range [0.15P
max
, 0.85P
max
].
In the absence of any “real” market data, the value
p
t=0
acts as a proxy for the initial estimate of market
equilibrium. But, since p
t=0
is artificially constrained
by the arbitrary market value P
max
, we believe that
this method of generating p
t=0
is not domain indepen-
dent and may present AA with an unfair “equilibrium
finding” advantage when compared with other agent
strategies, such as ZIP, which do not have access to
this parameter. For this reason, we introduce a modifi-
cation to AA whereby agents set their own internal es-
timation of P
max
such that P
max
equals twice the maxi-
mum assignment limit price an agent holds.
2
Readers
should note that agents can only submit a quote once
they have received an assignment to trade. Moreover,
for their first quote price, De Luca’s OpEx agents do
not make use of the limit prices of their internal as-
signments (other than to maximally bound the quote
at the bid limit and minimally bound at the ask limit).
We believe this to be unrealistic: since, at the begin-
ning of the market, the only information agents have
available for price discovery are their own personal
assignments, it is intuitive that agents should try to
benefit from any information contained therein.
As we were designing our experiments (in March
2012), a contemporary publication exposed an un-
expected “max spread rule” in De Luca’s AA code
of OpEx version 1 (see Cartlidge & Cliff, 2012,
for a lengthy discussion on the consequences of this
“rule”). This rule states that an agent should auto-
matically execute against the best quote on the other
side of the book if the relative spread (the differ-
ence between best quotes on either side of the book)
is within a threshold, maxSpread (and within limit
price range). Although this rule is not described in
the definition of AA, we believe that it is a vesti-
gial morph of a spread rule appearing in Risk-Based
(RB) agents (Vytelingum, Dash, David, & Jennings,
2004), a previous trader agent that Vytelingum even-
tually developed into AA. The max spread rule en-
courages De Luca’s AA agents to “jump the spread”
for a quick transaction. However, in OpEx version 1,
maxSpread was hard-coded to a value of 15%. Fol-
lowing Cartlidge and Cliff (2012), we believe that
this value is unrealistically large and therefore casts
2
We do not suggest that two is the optimum multiplier
for this equation; rather we aim to investigate the effect
of introducing this modification and select two as a simple
heuristic estimate.
Figure 1: ExPo Architecture. The ExPo exchange is a Ruby
on Rails web server application with RESTful architecture,
using a MySQL database for storage. Clients (automated
trader agents, or human traders using a web browser) con-
nect and message the server using HTTP messaging. ExPo
internal servers communicate via unix sockets.
a question of doubt on the validity of previous ex-
perimental results gathered using these agents.
3
In
this paper, we explore the effect of the spread jump-
ing rule. Unless otherwise stated, we remove the
maxSpread condition (i.e., set maxSpread = 0% for
our AA agents). All other AA parameters are set to
those suggested by Vytelingum (2006). Following the
literature, we also use the rule of updating only the
most profitable bid (for buyers) or ask (for sellers) at
any one time (similar to ZIP
S
).
3 METHODOLOGY
3.1 ExPo: Exchange Portal Platform
Exchange Portal (ExPo, 2012) is a real-time online
financial trading exchange platform designed to run
controlled scientific trading experiments between hu-
man traders and automated trader robots (see Fig-
ure 1). ExPo was developed at the University of
Bristol as both a teaching and research platform and
has been open-sourced as a gift to the wider research
community. ExPo can be run across a network (e.g.,
the internet), with human and/or automated trader
agents messaging the exchange via HTTP. Alterna-
tively, ExPo can be run on a single machine, with all
clients running locally. For all experiments detailed
in this paper, we run ExPo and the agent traders on
the same physical machine. Prior to running experi-
3
Since this issue was raised by Cartlidge and Cliff
(2012), the spread jumping rule has subsequently been
classified as a bug and removed from release version 2
(http://sourceforge.net/p/open-exchange/tickets/1/).
ExploringAssignment-Adaptive(ASAD)TradingAgentsinFinancialMarketExperiments
81
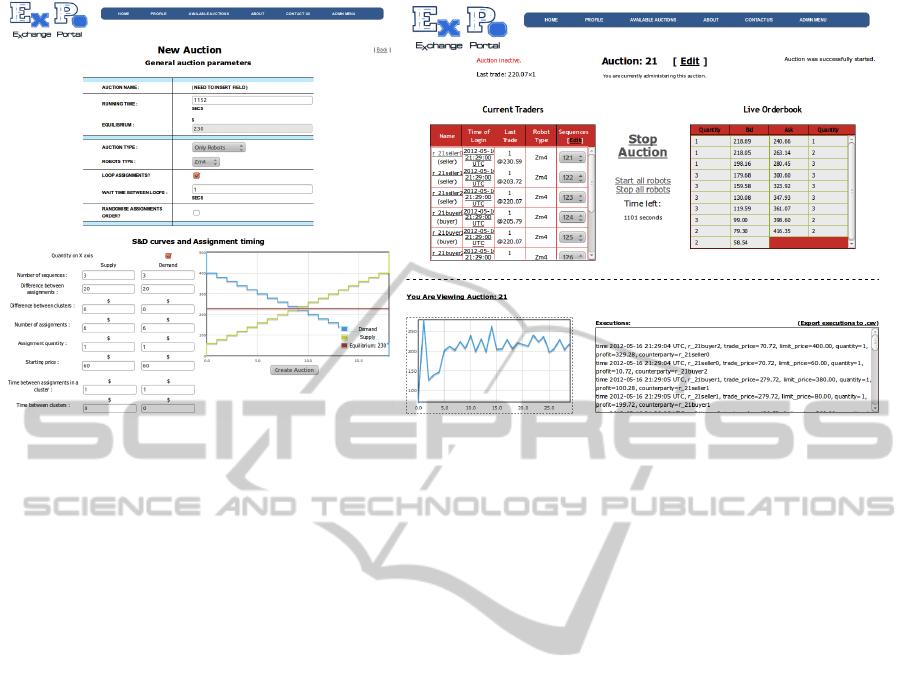
Figure 2: Left: A screenshot of the auction configuration GUI of ExPo. The assignment sequences for participants are
illustrated by the graph, with the blue line indicating aggregate market demand and the yellow line indicating aggregate
market supply. Right: A working auction from the admin screen. Traders’ details are displayed, top-left. The current public
limit order book is displayed top-right. Execution prices of transactions are plotted, bottom-left, and an exportable list of
transactions are detailed, bottom-right.
ments, ExPo was stress-tested through a rigorous se-
ries of agent-only experiments (see Stotter, 2012).
Figure 2 shows a typical set up for an auction us-
ing the admin GUI (left); and an example of ExPo in
operation (right). The assignment sequences for par-
ticipants are looped until the end of the auction. When
competitors are added to an auction through the au-
tomation scripts, they are put on the same assignment
sequences as already exist in the market. This is de-
signed to avoid accidentally introducing an asymmet-
rical advantage for any one group.
3.2 Experiment Design
Typical market environments used in previous exper-
iments typically follow the “trading day” model of
Smith’s original experiments (notable exceptions in-
clude De Luca et al., 2011; Cartlidge et al., 2012;
Cartlidge & Cliff, 2012, 2013). The problem with this
is that it assumes traders only get new assignments at
the start of each trading day – typically only one as-
signment each. Platforms like ExPo help to model
markets in a more realistic way. By modelling a mar-
ket as a continuous replenishment auction, we are able
to model in real time, allowing assignments to drip
feed into the market like they would if you were a
sales trader on a financial trading desk, receiving as-
signments from clients throughout the day.
Each agent strategy in the market was split into 3
buyers and 3 sellers. The running time for each auc-
tion was 1152 seconds, similar to the 20 minute length
of time that was used in De Luca et al. (2011). In that
time, exactly 64 trading rounds would occur, with 3
seconds between each assignment in the market. Only
one assignment was supplied at a time, and assign-
ment schedules were looped – i.e. continuously re-
plenished. There were exactly 6 assignments per loop
distributed to each agent, with exactly 3 buyer assign-
ment sequences and 3 seller assignment sequences.
All assignments arrived sequentially and were exactly
20 apart in price from each other. As assignments be-
longing to an agent are grouped by limit price, when
an agent receives a new assignment the assignment
quantity for that limit price was incremented. All
agents treat current holdings of assignments as a sin-
gle entity, increasing or decreasing their quote price
as a group. However, one or multiple assignments
may be traded from a group at any time if only a cer-
tain number are able to transact on the order book.
No retraction of assignments was permitted, and once
assignments were distributed, their limit prices could
not be modified. For all experiments, equilibrium
was set at 230, and raised to 300 when a “market
shock” occured. We do not use the NYSE spread-
improvement rule, thus enabling traders to submit
quotes at any price.
When a new assignment is provided to an agent,
that agent has the ability to put it straight on the order
book. Although agents can create new orders imme-
diately, each agent can only update their orders once
a sleep-time, s, has expired. While the agent is asleep
(we can think of this as a “thinking” period), it is
ICAART2013-InternationalConferenceonAgentsandArtificialIntelligence
82
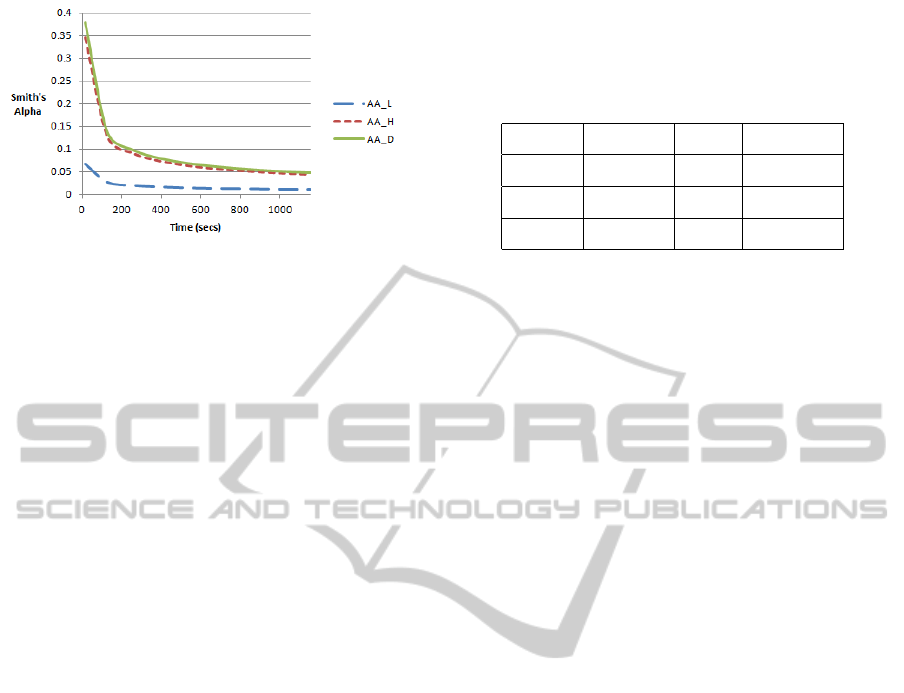
Figure 3: Smith’s α over time for each homogeneous AA
market. AA
L
produces lower alpha than AA
H
, demonstrat-
ing that lower values of P
max
artificially encourage equili-
bration.
still actively able to calculate a new order price us-
ing shouts and transactions in the marketplace. Once
sleep-time has elapsed, an agent is able to update their
order price. The ability to put new assignments on the
order book as soon as they are received is an impor-
tant difference to previous implementations of sleep-
time. An order placed immediately on the book is
more advantageous than delaying a trade by waiting.
The sleep-time of each agent was set randomly within
a boundary of ±(0− 25)% of the sleep-time provided.
This is the same “jitter” setting implemented by Das
et al. (2001). For all experiments reported here, we set
sleep-time s = 4 seconds. While it is not strictly nec-
essary to enforce a period of sleep time in agents (on
the scale of human reaction times) when the market
contains no humans, we do this to replicate the exper-
imental method of De Luca et al. (2011) and Cartlidge
et al. (2012). This enables us to directly compare re-
sults, and hence challenge or confirm any of their con-
clusions.
All experiments were repeated 5 times and re-
sults analysed using the non-parametric Robust Rank-
Order (RRO) statistical test (Feltovich, 2003, 2005).
The number of trials was necessarily restricted due
to the real-time nature of experiments, with each run
taking approximately 20 minutes.
4 RESULTS
4.1 AA Modifications
Here, we present results from a series of experiments
between the “reference” AA agents from the liter-
ature, and the modifications we suggested in Sec-
tion 2.3.2.
Table 1: Performance of AA with varying values of P
max
.
While efficiency varies little between the three settings, AA
L
produces significantly lower Smith’s alpha and profit dis-
persion. This verifies that market dynamics are affected by
the spurious variable P
max
.
Strategy Efficiency Alpha Profit Disp.
AA
L
0.999372 0.0114 97.3
AA
H
0.999365 0.0436 204.4
AA
D
0.999323 0.0469 253.4
4.1.1 The Effect of P
max
on AA
In De Luca’s implementation of AA (OpEx, 2012),
agents use the OpEx system parameter P
max
= 400.
For the majority of OpEx experiments, markets were
engineered to have an equilibrium value of P
0
= 200,
exactly half the value of P
max
(e.g., De Luca et al.,
2011; Cartlidge et al., 2012). We believe that the use
of this system parameter by AA agents may produce
artifactual dynamics and favourably bias AA agents
(when compared with other agents, such as ZIP, that
do not make use of this system parameter). Here, we
test three implementations of AA to observe the ef-
fect P
max
has on AA dynamics: AA
L
, with low value
P
max
= 500; AA
H
with high value P
max
= 2000; and
AA
D
, with dynamic P
max
= 2 × max(limit price). The
value used for AA
L
was purposely set to be approx-
imately twice equilibrium (set to P
0
= 230 in all ex-
periments, here) to enable comparison with OpEx re-
sults. Note that, since limit price is exogenously as-
signed to agents via the supply and demand permit
schedules, P
max
will vary between AA
D
agents. For
example, if an agent, a, receives 2 sell assignments
with limit prices 250 and 350, then P
max
= 700 for
that agent, a. For buy assignments, quote prices are
implicitly bounded by zero.
Figure 3 displays mean Smith’s α across 5 runs of
homogeneous AA
L
, AA
H
and AA
D
markets. We see
that a lower value of P
max
encourages better market
equilibration by constraining the “exploration” of ini-
tial equilibrium values. This suggests that P
max
intro-
duces an artificial system bias. In heterogeneous mar-
kets (containing 3 AA
L
and 3 AA
H
on each side) AA
L
agents gained greater efficiency in 4 of the 5 exper-
iments. However, using Robust Rank Order (RRO;
Feltovich, 2005) this result was not statistically sig-
nificant at the 10.3% level.
Table 1 summarises the performance of homoge-
neous AA
L
, AA
H
and AA
D
markets. We see that P
max
has virtually no effect on efficiency, but has a large
effect on Smith’s α and profit dispersion. There is no
significant difference between the efficiencies or al-
pha of homogeneous AA
D
and AA
H
markets. We be-
ExploringAssignment-Adaptive(ASAD)TradingAgentsinFinancialMarketExperiments
83
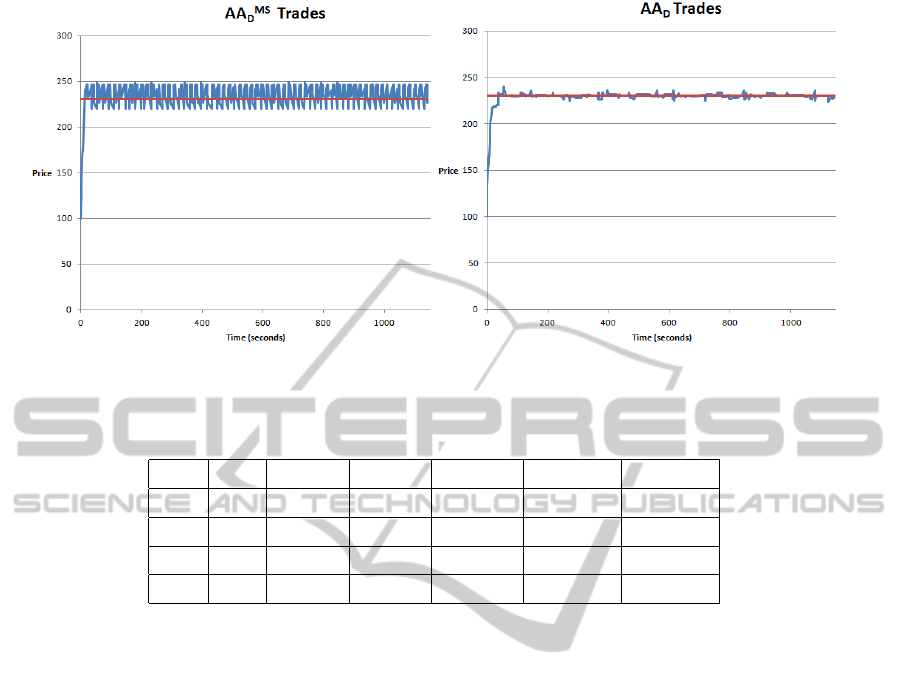
Figure 4: Trades in homogeneous markets. Left: AA
MS
D
agents (maxSpread = 15%). Right: AA
D
agents (maxSpread = 0%).
Table 2: Mean results summary (5 runs) of fast homogeneous markets, allocating assignments every 3 seconds. ZIP
M
performs
significantly better than ZIP
S
across all measures. AA
D
outperforms AA
MS
D
, and significantly dominates overall.
Agent Trials Efficiency Smith’s α Profit Disp. Total Shouts Total Trades
ZIP
S
5 0.974 0.0664 678.6 4245 582
ZIP
M
5 0.995 0.0529 308.6 7479 594
AA
MS
D
5 0.988 0.0658 530.5 4036 639
AA
D
5 0.999 0.0469 253.4 4104 577
lieve the reason AA
D
did not outperform AA
H
on these
metrics is due to the assignment distribution pattern.
In all experiments, assignments are distributed in de-
scending order, such that buy assignments with the
highest limit prices are always allocated first. There-
fore, initial values of P
max
for AA
D
agents are higher
than they would be otherwise.
Having shown that AA agents are sensitive to the
system value P
max
, we propose that AA agents should
be modified to dynamically adapt their own internal
value of P
max
. For the remainder of this paper, unless
stated otherwise, we use the dynamic AA
D
version of
AA.
4.1.2 The Effect of maxSpread on AA
In OpEx (2012), version 1, AA agents had a fixed
parameter value maxSpread = 15%. These agents
were used in De Luca et al. (2011) and Cartlidge
et al. (2012). Here, we test the effect of this param-
eter by comparing homogeneous and heterogeneous
markets containing two AA versions: AA
D
with no
maxSpread condition; and AA
MS
D
with maxSpread =
15%.
Figure 4 displays the time series of trade prices
from one example run of a homogeneous AA
MS
D
mar-
ket (left) and homogeneous AA
D
market (right). As
we would expect, AA
MS
D
markets have greater price
volatility and less equilibration to P
0
, with AA
MS
D
happy to “jump” a spread of 15%. Conversely, AA
D
agents will post quotes closer to equilibrium and wait
to be “hit”. Table 2 summarises mean results (5
runs) across all homogeneous markets. Comparing
AA
MS
D
with AA
D
, we see that the “spread jumping”
behaviour of AA
MS
D
results in lower efficiency, higher
α (less equilibration) and greater profit dispersion.
AA
MS
D
markets also execute roughly 10% more trades
than AA
D
, producing the most liquid markets of all
strategies tested. However, it should be noted that al-
though AA
MS
D
made more trades, they were not more
profitable. In heterogeneous markets containing 2
agent types (with 3 agents of each type on each side),
AA
D
gained significantly higher efficiency than AA
MS
D
(RRO, p ≤ 0.004).
4.2 ZIP Modifications
4.2.1 Single vs. Multiple Profit Margins
We test multi-profit margin, ZIP
M
, and single-profit
margin, ZIP
S
, in a series of homogeneous markets.
Table 2 summarises mean results (5 runs). ZIP
M
is significantly more efficient than ZIP
S
in fast con-
tinuous replenishment markets, with 3 seconds be-
tween assignments (RRO, p ≤ 0.004). However,
ICAART2013-InternationalConferenceonAgentsandArtificialIntelligence
84
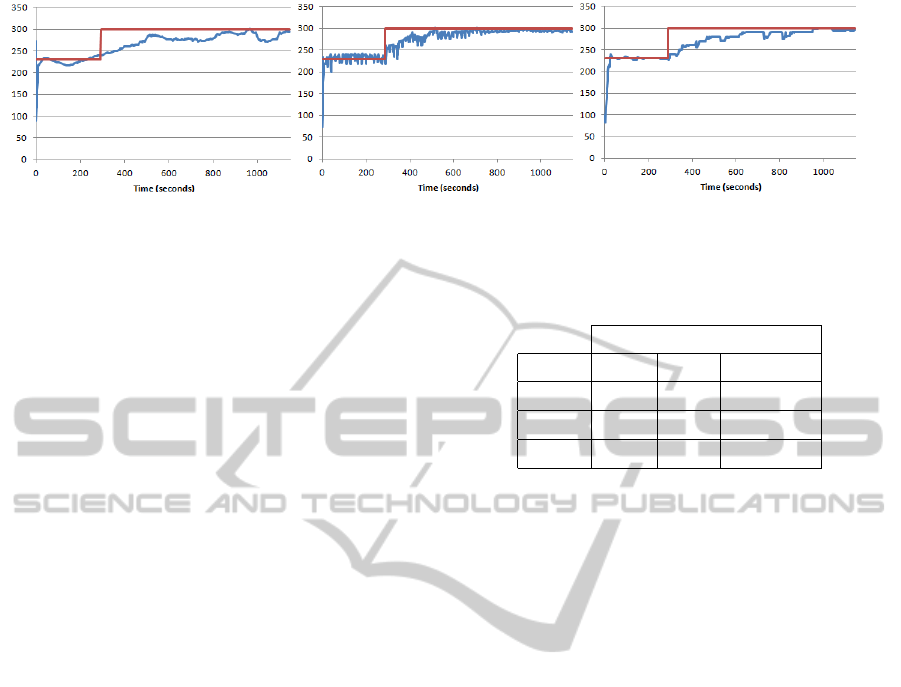
Figure 5: Illustrative example of a positive market shock, from P
t
0
= 230 to P
t+1
0
= 300. Markets containing only ZIP
M
agents
(centre) re-equilibrate after a market shock more quickly than ZIP
S
(left) and AA
D
(right). Results for negative market shocks
(P
0
falls) are symmetrically similar.
this superiority diminishes as the market slows (re-
sults not shown). With 6 seconds between assign-
ments, ZIP
M
also has significantly greater efficiency
(RRO, 0.004 ≤ p ≤ 0.008), but with 12 and 24 sec-
onds between assignments, ZIP
M
are no longer more
efficient. This suggests that holding a vector of
simultaneously-adjustable profit margins is more ef-
fective in markets where a quick response is neces-
sary.
Overall, AA
D
is the dominant strategy of the four
tested (see Table 2), with significantly higher alloca-
tive efficiency and significantly lower Smith’s α than
both ZIP
M
and ZIP
S
across all market speeds (RRO,
p < 0.048). This confirms the dominance of AA over
ZIP reported in the literature (for the full set of de-
tailed results, see Stotter, 2012).
4.3 Market Shocks
Thus far, we have assessed the performance of agents
in static markets with a fixed theoretical equilib-
rium, P
0
. Here, we test the performance of agents in
dynamic markets that experience a market “shock”;
where P
0
changes value mid-way though an experi-
ment. For brevity, we only present results for shocks
where the market equilibrium, P
0
, increases. How-
ever, the reader should note that shocks where P
0
de-
creases are equally likely and lead to symmetrically
similar results, i.e., where buyers benefit from a shock
in one direction, sellers will equally benefit from a
shock in the other. When a market shock occurs, new
assignments entering the market are perturbed by the
same value as the shock. For example, if a market
shock moves P
0
from 150 to 200, all new assignment
allocations are given an increased limit price 50 units
higher than they were before the shock. Real-world fi-
nancial markets are inherently dynamic, experiencing
continual supply and demand fluctuations. By explor-
ing dynamic markets we aim to better understand the
dynamics of agent traders in real-world markets.
When a market shock occurs, assignments that
have already been allocated into the market are not
Table 3: Mean profit in +shocked homogeneous markets.
Average Profit Per Trade
Strategy Buyers Sellers % difference
ZIP
S
97.08 71.65 35.50%
ZIP
M
90.62 72.50 24.99%
AA
D
98.28 69.46 41.49%
recalled. Thus, the actual market equilibrium P
0
0
does
not immediately move to the new theoretical market
equilibrium P
0
. Rather, P
0
0
asymptotically tends to-
ward P
0
, only reaching P
0
when all assignments allo-
cated before the market shock have executed. We use
this model of assignment persistency since we assume
agents are acting as sales traders; assigned to buy (or
sell) based on the requirements of a client. Figure 5
illustrates example markets containing, from left to
right, ZIP
S
, ZIP
M
and AA
D
agents. In each case, we
see transaction prices gradually tend toward the new
equilibrium after a market shock. These results are
different to those seen in discrete trading day experi-
ments presented in the literature; where markets tend
to re-equilibrate much quicker. However, we believe
the setup we use to be a more accurate model of real
markets.
Table 3 summarises the mean profits of traders
across 5 experiments with positive market shocks;
i.e., shocks in which P
0
increases. Results for neg-
ative market shocks are symmetrically similar. For
brevity, we do not present results for negative shocks,
since all conclusions drawn are the same as those
for positive shocks. We see that, in all cases, posi-
tive shocks benefit buyers (similarly, negative shocks
benefit sellers). This is because, for the period that
P
0
0
is below P
0
, buyers have the opportunity to trade
at a “cheap” price. In Figure 5, the area between
the new equilibrium line (in red) and the transaction
time-series (in blue) is additional profit that buyers are
making, and that sellers miss out on. We can quan-
tify this by the percentage difference in the average
profit per trade of buyers and sellers (Table 3). We
ExploringAssignment-Adaptive(ASAD)TradingAgentsinFinancialMarketExperiments
85

see that ZIP
M
markets have significantly lower profit
spread (RRO, 0.071 < p < 0.089), indicating quicker
re-equilibration after market shock. There is no sig-
nificant difference in profit spread between ZIP
S
and
AA
D
markets. We believe shocked homogeneous mar-
kets containing ZIP
M
agents are able to re-equilibrate
more quickly due to agents’ ability to update multi-
ple orders each time they “wake”. Thus, if we ran
further experiments using AA
D
agents with multiple
profit margins, we would similarly expect a decrease
in re-equilibration time.
However, while both AA and ZIP agents are able
to re-equilibrate after equilibrium, neither algorithm
is specifically designed to anticipate price movements
following a shock. In the following section, we ex-
plore the effects of adding such a novel mechanism.
4.4 Assignment-Adaptive Agents
If an agent is capable of analysing their own assign-
ments, to see if there is an inherent rise (or fall) in
value, then it may be possible to infer that a market
shock has occurred, and thus anticipate a rise (fall)
in transaction prices. By adjusting profit margins ac-
cordingly, the agent may be able to secure greater
profit. Here, we introduce a preliminary method for
agents to adapt their profit margins using information
contained in their own assignment orders. We call
these agents Assignment Adaptive (ASAD). This is
exploratory work and is not intended to be a defini-
tive solution. Rather, we are more interested in the
dynamics of markets that contain such agents. For all
experiments, we use ZIP
M
agents, previously shown
to most quickly re-equilibrate after market shocks.
Once again, we present results for positive market
shocks only. However, results for negative shocks are
symmetrically similar and the same conclusions can
be drawn for shocks in both directions.
ASAD agents store assignment prices in a rolling
memory window containing the last 20 prices, or-
dered oldest to youngest. Agents only begin acting
on these prices once the window is filled (i.e., once an
agent has received and stored 20 assignment prices).
ASAD agents then calculate the gradient of change
in assignment prices by using Ordinary Least Squares
(OLS) regression (Stock & Watson, 2012), such that
gradient, ∇, is:
∇ =
∑
x
i
y
i
−
y
∑
x
i
∑
x
2
i
− x
∑
x
i
(8)
where x
i
is the index position of assignment limit
price y
i
in the assignment price window, ordered
chronologically. This gradient value, ∇, is then trans-
formed using a simple logarithm function, in order to
Figure 6: Illustrative example of a positive market shock in
a homogeneous ASAD market. The market quickly reacts
to the shock, but initially overshoots the new equilibrium.
return a value greater than 1 for positive gradients and
a value less than 1 for negative gradients:
φ =
(
−ln(1 − ∇) if ∇ < 0
ln(∇ + 1) otherwise
(9)
We call this value the shock indicator, φ. Values of
φ > 1 indicate prices in the market may increase; val-
ues of φ < −1 indicate prices in the market may fall.
ASAD agents use φ to alter profit margin accord-
ing to the following two rules:
if (seller & phi>1) increase profit margin
if (buyer & phi<-1) increase profit margin
While φ > 1 for sellers (or φ < −1 for buyers),
agent calculated quotes are increased, or inflated, by
20%. To prevent ASAD agents from returning to mar-
ket clearing price (P
0
0
) too early after a shock is de-
tected, the cumulative value of φ is used to “wind-
down” ASAD price inflation from 20% to 0% over
time. This decline in percentage over time is propor-
tional to the size of the cumulative value of φ, reduced
(increased) by 0.5 every time the ASAD agent can up-
date its orders (subject to no current shock occurring),
until cumulative φ, and therefore percentage, equals
zero.
Results from one illustrative homogeneous mar-
ket containing ASAD agents is shown in Figure 6.
We see that immediately following a positive mar-
ket shock, prices begin to rise. Prices then overshoot
the new equilibrium value, before returning to near-
equilibrium value. This suggests that ASAD agents
are sensitive to market shocks, but require tuning. In
homogeneous markets with all ASAD agents, sellers
benefit from a positive market shock, being able to
either match or beat buyers’ average profit. This is
in stark contrast to ZIP
M
markets, where sellers con-
sistently lose out by a margin of ≈ 25%. Further,
very little profit is lost in the market itself, suggesting
ICAART2013-InternationalConferenceonAgentsandArtificialIntelligence
86

Figure 7: Normal form matrix of results between compet-
ing ASAD (adapted) and non-ASAD (na
¨
ıve) agents. Ho-
mogeneous markets of adapted agents perform better than
homogeneous markets of na
¨
ıve agents. However, in het-
erogeneous markets, na
¨
ıve agents gain and adapted agents
lose.
that assignment adaptivity can equalise profit between
buyers and sellers during a market shock.
However, when testing ASAD (adapted ZIP
M
)
agents in positive shock markets containing na
¨
ıve
ZIP
M
agents, results were somewhat surprising:
• In heterogeneous markets containing six ASAD
and six ZIP
M
agents, ASAD sellers performed
significantly worse than ZIP
M
sellers. Surpris-
ingly, ZIP
M
sellers also outperformed all buyers.
• In heterogeneous markets containing eleven ZIP
M
agents and only one ASAD seller, once again the
profits of every ZIP
M
seller was increased, while
the ASAD agent significantly under-performed.
• The profit spread between buyers and sellers of
homogeneous markets containing twelve ZIP
M
agents was significantly higher than in markets
containing at least one ASAD agent; although in
every case the ASAD agent(s) suffered.
These findings suggest that ASAD agents generate a
new price signal to which price sensitive ZIP
M
agents
can react and benefit. However, ASAD agents them-
selves suffer from the resulting behaviour of ZIP
M
agents. If we consider longer term market evolution,
a population of ASAD agents can be easily invaded
by ZIP
M
. If the entire market is ASAD then every-
one benefits, but if any non-ASAD agent enters the
market, it parasitically benefits from the behaviour of
ASAD and will flourish, eventually exterminating the
ASAD agents from the marketplace. We summarise
these outcomes in Figure 7. Potentially, these find-
ings could be due to the simple ASAD strategy im-
plemented here. For example, ASAD agents are not
designed to consider the rate of change of prices in
the market. Perhaps a more suitable approach would
be to implement an adaptive learning rule, such as the
“delta rule” introduced by Widrow and Hoff (1960),
which is the basis of the adaptation mechanism in ZIP
(Cliff, 1997). We reserve this extension for future
work.
5 CONCLUSIONS
We have used the Exchange Portal (ExPo) platform
to perform a series of agent-based computational eco-
nomics experiments between populations of financial
trading agents, using continuous replenishment of or-
der assignments.
In the first set of experiments, we exposed sev-
eral idiosyncrasies and ambiguities in AA and ZIP,
two of the standard “reference” algorithms from the
literature. First, we showed that ZIP performs better
in fast markets when agents contain a vector of profit
margins that they can update simultaneously. In AA
agents, we demonstrated how P
max
and “spread jump-
ing” negatively affects market dynamics, and sug-
gested alternative implementations that improve per-
formance.
In the second set of experiments, we introduced
market “shocks” and presented a novel exploratory
Assignment Adaptation (ASAD) modification to ZIP.
Results showed that homogeneous populations of
ASAD agents perform better than homogeneous pop-
ulations of ZIP agents. However, in heterogeneous
ASAD-ZIP populations, ZIP agents perform better
and ASAD agents perform worse, suggesting that
ASAD agents provide a novel price signal that bene-
fits ZIP, to the detriment of ASAD agents themselves.
This work naturally suggests further extensions.
Firstly, to expose the benefits of dynamically select-
ing a value of P
max
, we selected a multiplier value of
2 × max(limit price). The value 2 was arbitrarily se-
lected and should be optimised for performance. Sec-
ondly, it is likely that the introduction of an adaptive
learning algorithm (similar to that used by ZIP) could
improve the performance of ASAD. We reserve both
of these avenues of research for further work.
Perhaps more interestingly, however, we also re-
serve more general open questions for future explo-
ration. Firstly, in the work presented here, all market
shocks are exogenous: it would be very interesting to
see if results are similar when shocks are endogenous
to the market. However, to answer this, it is first nec-
essary to have agents acting as “prop. traders”, buying
and selling on their own behalf for profit, rather than
“sales traders” (trading on behalf of a client). This is a
ExploringAssignment-Adaptive(ASAD)TradingAgentsinFinancialMarketExperiments
87

more difficult challenge, but one that is pertinent if we
are to further our understanding of the global finan-
cial markets. Secondly, since real financial markets
include human traders and “robot” automated trad-
ing agent systems, we hope to explore the dynamic
interactions between these groups by introducing hu-
man participants into our experiments. ExPo has been
specifically designed to enable human participation;
and further, since ExPo participants (whether human,
or robot) connect to the exchange using HTTP mes-
saging across a network, ExPo allows geographically
dis-located human participants to sign in via a web
browser and then leave or return at will. Theoretically,
this enables us to run experiments with large num-
bers of participants, over long time periods of days,
weeks, or even months. As far as we are aware, this
has never been done before and has the potential to
provide valuable insight into real world financial mar-
kets.
ACKNOWLEDGEMENTS
The authors would like to thank Tomas Gra
ˇ
zys for
significant development of the ExPo platform. Pri-
mary financial support for Dave Cliff’s research
comes from EPSRC grant number EP/F001096/1;
John Cartlidge is supported by EPSRC grant number
EP/H042644/1.
REFERENCES
Cartlidge, J., & Cliff, D. (2012). Exploring the “robot phase
transition” in experimental human-algorithmic mar-
kets. Foresight, The Future of Computer Trading
in Financial Markets, Driver Review DR25, Crown
Copyright. Available [online] bitly.com/SvqohP.
Cartlidge, J., & Cliff, D. (2013). Evidencing the “robot
phase transition” in experimental human-algorithmic
markets. In 5th Int. Conf. Agents & Art. Intell.
(ICAART-2013) Barcelona, Spain. SciTePress.
Cartlidge, J., De Luca, M., Szostek, C., & Cliff, D. (2012).
Too fast too furious: faster financial-market trading
agents can give less efficient markets. In Filipe, J., &
Fred, A. (Eds.), 4th Int. Conf. Agents & Art. Intell.,
Vol. 2 (ICAART-2012), pp. 126–135. SciTePress.
Cliff, D. (1997). Minimal-intelligence agents for bargaining
behaviors in market-based environments. Tech. rep.
HPL-97-91, Hewlett-Packard Labs.
Das, R., Hanson, J., Kephart, J., & Tesauro, G. (2001).
Agent-human interactions in the continuous double
auction. In Nebel, B. (Ed.), 17th Int. Joint Conf. Art.
Intell. (IJCAI-01), pp. 1169–1176. Morgan Kauf-
mann.
De Luca, M., & Cliff, D. (2011a). Agent-human in-
teractions in the continuous double auction, redux:
Using the OpEx lab-in-a-box to explore ZIP and
GDX. In Filipe, J., & Fred, A. (Eds.), 3rd Int. Conf.
Agents & Art. Intell. (ICAART-2011), pp. 351–358.
SciTePress.
De Luca, M., & Cliff, D. (2011b). Human-agent auction
interactions: Adaptive-aggressive agents dominate.
In Walsh, T. (Ed.), 22nd Int. Joint Conf. Art. Intell.
(IJCAI-11), pp. 178–185. AAAI Press.
De Luca, M., Szostek, C., Cartlidge, J., & Cliff, D. (2011).
Studies of interactions between human traders and
algorithmic trading systems. Foresight, The Future
of Computer Trading in Financial Markets, Driver
Review DR13, Crown Copyright. Available [online]
http://bit.ly/RoifIu.
ExPo (2012). The Exchange Portal. Download available.
http://sourceforge.net/projects/exchangeportal/.
Feltovich, N. (2003). Nonparametric tests of differences
in medians: Comparison of the Wilcoxon-Mann-
Whitney and robust rank-order tests. Experimental
Economics, 6, 273–297.
Feltovich, N. (2005). Critical values for the robust rank-
order test. Communications in Statistics - Simulation
and Computation, 34(3), 525–547.
Gjerstad, S., & Dickhaut, J. (1998). Price formation in dou-
ble auctions. Games and Economic Behavior, 22(1),
1–29.
Gode, D., & Sunder, S. (1993). Allocative efficiency of
markets with zero-intelligence traders: Markets as a
partial substitute for individual rationality. Journal
of Political Economy, 101(1), 119–137.
OpEx (2012). Open Exchange software download available.
http://sourceforge.net/projects/open-exchange/.
Preist, C., & van Tol, M. (1998). Adaptive agents in a per-
sistent shout double auction. In 1st Int. Conf. Inform.
& Comput. Economies, pp. 11–18. ACM Press.
Smith, V. (1962). An experimental study of comparative
market behavior. J. Political Economy, 70, 111–137.
Stock, J. H., & Watson, M. M. (2012). Introduction to
Econometrics (3rd edition)., chap. 4. Pearson.
Stotter, S. (2012). Improving the strategies of algorithmic
traders and investigating further realism in their mar-
ket environment. Master’s thesis, Dep. Comp. Sci.,
Univ. Bristol, UK.
Tesauro, G., & Das, R. (2001). High-performance bidding
agents for the continuous double auction. In ACM
Conference on Electronic Commerce, pp. 206–209.
Vytelingum, P. (2006). The Structure and Behaviour of the
Continuous Double Auction. Ph.D. thesis, Sch. Elec-
tron. and Comput. Sci., Univ. Southampton, UK.
Vytelingum, P., Dash, R. K., David, E., & Jennings, N. R.
(2004). A risk-based bidding strategy for continuous
double auctions. In 16th Europ. Conf. Art. Intell., pp.
79–83.
Widrow, B., & Hoff, Jr., M. E. (1960). Adaptive switching
circuits. Inst. Radio Engineers, Western Electron.
Show and Conv. (IRE WESCON), Conv. Rec., 4, 96–
104.
ICAART2013-InternationalConferenceonAgentsandArtificialIntelligence
88
