
On the Accuracy of Representing Heartbeats
with Hermite Basis Functions
David G. M
´
arquez
1
, Abraham Otero
2
, Paulo F
´
elix
1
and Constantino A. Garc
´
ıa
1
1
Centro Singular de Investigaci
´
on en Tecnolox
´
ıas da Informaci
´
on (CITIUS), University of Santiago de Compostela,
15782 Santiago de Compostela, Spain
2
Department of Information Systems Engineering, University San Pablo CEU, 28668 Madrid, Spain
Keywords:
Heartbeat Representation, Hermite Functions, ECG.
Abstract:
Automatic ECG analysis requires choosing a representation for heartbeats. A common approach is using
some basis of functions to represent the heartbeat as a linear combination of these functions. The coefficients
of the linear combination are used as the features that represent the heartbeat, providing a very compact
representation. The most used basis of functions is the one made up of the Hermite functions. Some authors
have used as few as 3 Hermite polynomials to represent each heartbeat, while others have used as many as 20.
Often little or no justification for the choice of the number of polynomials is given. This paper aims to analyze
the impact of using a certain number Hermite polynomials on the accuracy of heartbeat representation. Tests
were run fitting the heartbeats of the MIT-BIH arrhythmia database with a number of polynomials ranging
from 2 to 20. Three different strategies to determine the heartbeat’s position were used. The fitting errors are
reported here. Based on these results, some guidelines to choose a suitable number of Hermite polynomials
for different applications are given.
1 INTRODUCTION
The electrocardiogram is a simple and inexpensive
test for the diagnosis of multiple cardiovascular dis-
eases. Its main disadvantage is probably the large
amount of information that it generates; e.g., a 24-
hour Holter recording can contain up to 100,000
heartbeats. Thus, visual inspection of the recording
can be a tedious and time-consuming task. This is
the reason why the biomedical engineering commu-
nity has attempted to provide tools for the automatic
analysis of ECG recordings.
Automatic ECG analysis starts with the detection
and characterization of heartbeats. Errors in this task
can invalidate the rest of the analysis. In the literature
there are three main approaches to represent beats:
using the digitized signal (Hu et al., 1993), extract-
ing heartbeat interval features (De Chazal and Reilly,
2006) and using some basis of functions (Lagerholm
et al., 2000) . Using the digitized signal prevents any
loss of information, but this representation is diffi-
cult to work with due to its large size, and it is very
sensitive to noise. Using heartbeat interval features
is the closest representation to the clinicians’ modus
operandi when they interpret beats. However it is dif-
ficult to obtain a robust extraction of these features.
The basis of functions have a good performance un-
der noisy conditions and can provide a very compact
representation of the beat.
The basis of functions most commonly used is the
one made up of the Hermite functions. When using
this approach, a choice must be made about the num-
ber of Hermite polynomials to be used in the represen-
tation of the beats. There are some authors that use
as few as 3 polynomials (Braccini and Edenbrandt,
1997), and others use as many as 20 (Park et al.,
2008). Usually the authors provide little or no jus-
tification for the number of polynomials used.
This paper aims to analyze the impact of using a
certain number of Hermite polynomials in the rep-
resentation of a heartbeat. Section 2 describes the
database used in our analysis, the preprocessing ap-
plied to the ECG signal, and how the error between
the representation obtained from the Hermite basis
functions and the original signal was calculated. Sec-
tion 3 describes the results obtained when fitting the
beats with different numbers of Hermite polynomi-
als, and Section 4 discusses these results, providing
some guidelines to choose a suitable number of Her-
mite polynomials.
338
G. Márquez D., Otero ., Félix P. and A. García C..
On the Accuracy of Representing Heartbeats with Hermite Basis Functions.
DOI: 10.5220/0004247503380341
In Proceedings of the International Conference on Bio-inspired Systems and Signal Processing (BIOSIGNALS-2013), pages 338-341
ISBN: 978-989-8565-36-5
Copyright
c
2013 SCITEPRESS (Science and Technology Publications, Lda.)

2 MATERIAL AND METHOD
2.1 ECG Database
The database most commonly used in the papers deal-
ing with automatic beat classification is the MIT-BIH
arrhythmia database . Therefore, this will also be the
database we shall use in our study. The MIT-BIH ar-
rhythmia database (Moody and Mark, 2001) is made
up of 48 ECG recordings of two channels among the
modified limb lead II (MLII) and the modified leads
V1,V2,V3,V4 and V5. The recordings are digitized at
360 Hz sampling rate. All beats in the database were
annotated by two or more cardiologist.
2.2 Preprocessing
To eliminate the baseline drift a wavelet based filter
was used. To remove the high frequency noise a low-
pass 4 order Butterworth filter with a cutoff frequency
of 40 Hz was used. One of the theoretical advantages
of representing beats with the Hermite polynomials is
the robustness of the representation in the presence of
noise. To empirically test this, we shall run our tests
both directly on the recordings, and over a filtered ver-
sion of the recordings.
Theoretically, Hermite polynomials will provide a
better characterization of the beat if the point of max-
imum symmetry is selected as the center of the win-
dow of signal to be fitted. This point is usually the
peak of the QRS complex, the R wave. Furthermore,
setting the beat location in a stable position within
the QRS complex will lead to more reproducible re-
sults, and therefore to features that will be more eas-
ily recognized by an automatic classifier. To try to
achieve a more stable beat’s position within the QRS
complex, and to get as close as possible to the point
of maximum symmetry, an algorithm to improve the
beats’ location provided in the MIT-BIH arrhythmia
database was used. The algorithm calculates the mean
in a 200 ms window around the annotation provided
in the database (the annotation handmade by cardiol-
ogists). Usually, the R wave peak is the farthest point
from the mean value. This point is selected and a new
window of 200 ms around it is extracted from the sig-
nal.
The correction to the beat’s position can be ap-
plied only to one channel or to both channels inde-
pendently. If it is only applied to one channel, the
position of the R wave peak is assumed to be equal
for both channels (this is not necessarily true in prac-
tice). Otherwise, the location of the R wave peak may
be slightly different for each channel.
We have run one test using the beat’s positions
provided by the MIT-BIH arrhythmia database, the
solution most commonly used in the literature. A sec-
ond test was performed applying the beat location cor-
rection algorithm over the first channel and using the
same beat location in the second channel. Finally, a
third test was run applying the beat location correction
algorithm over both channels independently. Each of
the three strategies was applied directly over the MIT-
BIH arrhythmia database signal recordings, and over
the filtered version of the recordings, yielding a total
of six different tests.
2.3 Hermite Functions
We will extract each heartbeat’s QRS by taking a 200
ms window of sampled ECG centered on the beat’s
position, being the beat’s position calculated by one
of the three strategies presented in the previous sec-
tion. This window is wide enough to encompass the
entire QRS complex of a normal beat, but narrow
enough not to include the P and T waves. The width
of this window is the one normally used in the litera-
ture (Lagerholm et al., 2000).
All the Hermite functions converge to zero both in
∞ and in -∞. Thus, we shall add 100 ms zeros on each
side of the 200 ms window containing the QRS. Let
us denote by x(t) the resulting 400 ms window. x(t)
can be represented as:
x(t) =
N−1
∑
n=0
c
n
(σ)ϕ
n
(t, σ) + e(t) (1)
where N is the number of Hermite polynomials used
in the representation of the beat, ϕ
n
(t, σ) is the n Her-
mite function, c
n
are the coefficients of the linear
combination, σ is a parameter that controls the width
of the polynomial, and e(t) is the error between x(t)
and the Hermite approximation. For details on how to
calculate c
n
and σ see (Lagerholm et al., 2000).
2.4 Error Measurement
(Lagerholm et al., 2000) used the following measure
to quantify the error of the approximation:
∈=
∑
t
|e(t)|
2
∑
t
|x(t)|
2
(2)
This measure will be calculated in our test, to be
able to compare our results with the ones of Lager-
holm et al. We shall also calculate another measure
that we believe is more easy to interpret: the normal-
ized root-mean-square error (NRMSE) between the
OntheAccuracyofRepresentingHeartbeatswithHermiteBasisFunctions
339
0.00 0.02 0.04 0.06
Channel 1 Unfiltered
2 3 4 5 6 7 8 9 10 11 12 13 14 15 16 17 18 19 20
0.00 0.02 0.04 0.06 0.08
Channel 2 Unfiltered
2 3 4 5 6 7 8 9 10 11 12 13 14 15 16 17 18 19 20
0.00 0.02 0.04 0.06 0.08
Total Unfiltered
2 3 4 5 6 7 8 9 10 11 12 13 14 15 16 17 18 19 20
Number of Hermite Polynomials
SeekBothChannels
SeekFirstChannel
OriginalAnnotations
0.00 0.02 0.04 0.06
Channel 1 Filtered
2 3 4 5 6 7 8 9 10 11 12 13 14 15 16 17 18 19 20
0.00 0.02 0.04 0.06 0.08
Channel 2 Filtered
2 3 4 5 6 7 8 9 10 11 12 13 14 15 16 17 18 19 20
0.00 0.02 0.04 0.06 0.08
Total Filtered
2 3 4 5 6 7 8 9 10 11 12 13 14 15 16 17 18 19 20
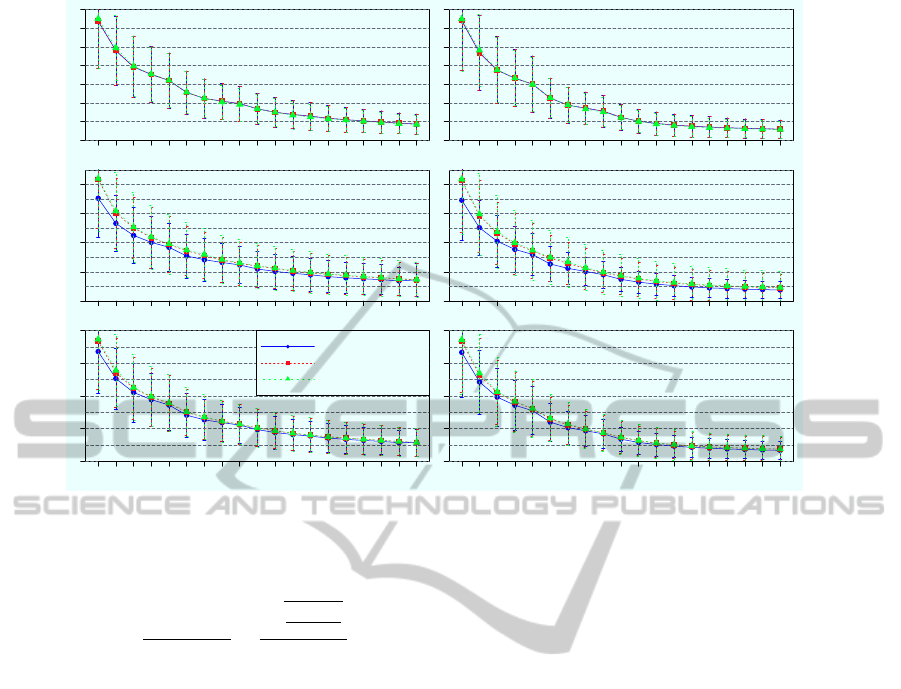
Figure 1: NRMSE results for the unfiltered and filtered signal for the three different strategies to determine the beat’s position.
Hermite reconstruction and the sampled signal:
NRMSE =
RMSE
x
max
− x
min
=
√
∑
t
|e(t)|
2
N
x
max
− x
min
(3)
where N is the size of the window in samples. The
NRMSE can be interpreted as the average error ex-
pressed as a percentage of the range of values in the
signal fragment (x
max
− x
min
).
3 RESULTS
The results of the average NRMSE (see Equation 3)
through all recordings are shown in Figure 1. The
errors of each channel and the average error of the
two channels are shown. The results corresponding
with the beat’s positions provided in the database,
the beat’s position correction applied to the first ECG
channel, and the beat’s position correction applied to
both channels are marked with triangles, squares and
circles, respectively. The bar shows the standard de-
viation of each error. The graphs on the left are the
results for the unfiltered signal and the graphs on the
right are the results for the filtered signal.
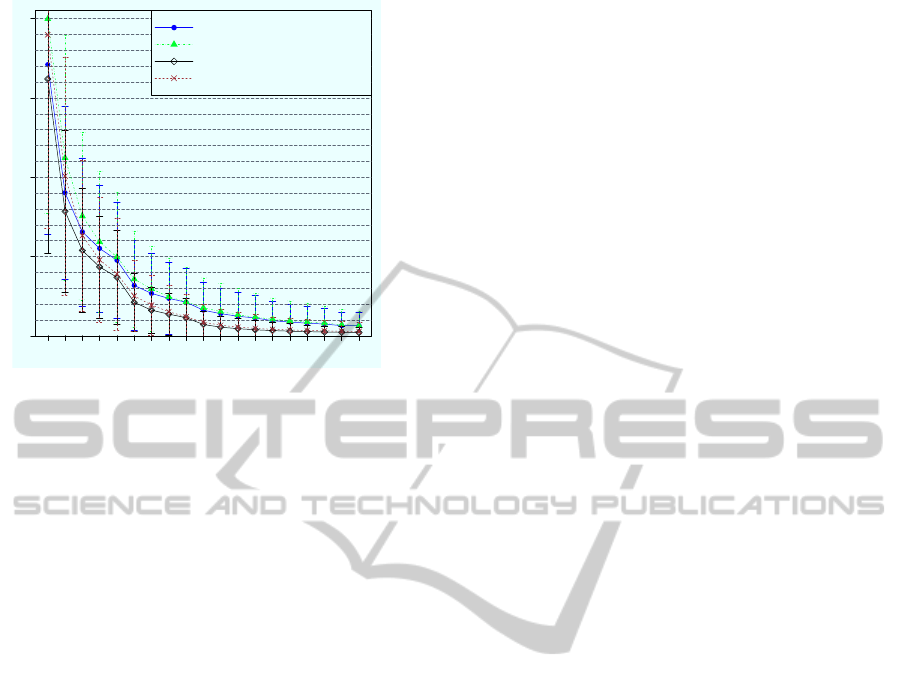
Figure 2 shows Lagerholm’s error measure (see
Equation 2) when using the beat positions provided
in the database, and when the correction is applied to
both channels. Results are shown both for the filtered
and unfiltered signal.
4 CONCLUSIONS AND
DISCUSSION
The results in the previous section show that even with
a small number of Hermite functions, beats can be
represented acceptably. This is not surprising at all;
there are authors in the literature that use as few as 3
functions to represent the beats (Braccini and Eden-
brandt, 1997). 7 polynomials may be a sweet spot;
between 6 and 7 we can still appreciate a significant
improvement in Figure 1 and Figure 2; but after 7 the
improvements are smaller. At least when the final
goal is to obtain a beat classification, it is question-
able whether it is worth using a number as high as 20
polynomials (Park et al., 2008), since the benefits ob-
tained from a slightly more accurate representation of
the beats may be overtaken by the disadvantages of
training classifiers in a higher dimension space: go-
ing from 12 functions to 20 produces a decrease of
approximately 0.005 in the total NRMSE both over
the filtered and the unfiltered signal (see Figure 1).
The beat’s position correction algorithm, espe-
cially when applied to both channels, provides no-
ticeable improvements of the results. These improve-
ments are more marked in the second channel, espe-
cially when using low numbers of Hermite functions.
The reason why the correction provides better results
on the second channel is probably because the MIT-
BIH arrhythmia database has been annotated over the
first channel (Moody and Mark, 2001). The reason
BIOSIGNALS2013-InternationalConferenceonBio-inspiredSystemsandSignalProcessing
340
0.00 0.05 0.10 0.15 0.20
Error
2 3 4 5 6 7 8 9 10 11 12 13 14 15 16 17 18 19 202 3 4 5 6 7 8 9 10 11 12 13 14 15 16 17 18 19 20
Number of Hermite Polynomials
SeekBothChannels
OriginalAnnotations
SeekBothChannelsFiltered
OriginalAnnotationsFiltered
Figure 2: (Lagerholm et al., 2000) error measure.
why more improvement is obtained for a low number
of polynomials is because when using a high number
of polynomials it is posible to represent the beat ac-
curately even if the point chosen as the center of the
fitting window is not the point of maximum symmetry
(see Figure 1).
Filtering provides significant improvements in the
results (see Figure 1 and Figure 2). We have per-
formed independent tests using only high frequency
filtering and only baseline drift removal. The removal
of baseline drift alone produced virtually identical re-
sults to working directly with the unfiltered signal; al-
most all the improvements that can be seen in Figures
1 and 2 when using the filtered signal arise from the
high frequency filtering. This suggests that Hermite
approximation is more affected by high frequency
noise than by baseline drift. For example, a 2% of
NRMSE can be achieved without filtering with 11
polynomials but with filtering only 8 are required; and
we cannot reach a 1% of NRMSE without filtering,
not even with 20 polynomials, while with filtering is
possible to reach this error with 13 (see Figure 1).
Among the papers we have reviewed only (Lager-
holm et al., 2000) reports error results for the Hermite
approximation. Lagerholm et al. calculated the error
with Equation 2. They only report the values for 3,
4, 5 and 6 Hermite polynomials; the errors are 9.7%,
6.8% , 5.5% and 4.5%, respectively. These results are
slightly lower than the results we obtained with our
beat correction algorithm applied over both channels
with the unfiltered signal. However, when using the
filtered signal the errors we obtain are lower than the
results of Lagerholm et al., both when using the orig-
inal beat annotations from the database, and when us-
ing the beat position correction over both channels.
It should be noted that Lagerholm et al. applied no
high-frequency filtering.
In this paper we have determined the accuracy of
the representation with a measure of the error between
the reconstruction obtained from the Hermite polyno-
mials and the original signal. However, if the final
goal of representing beats with Hermite polynomials
is to classify them in different morphological fami-
lies (instead of, for example, compression of the ECG
(Jane et al., 1993)), the features that minimize this
error need not to be those that provide the best sepa-
ration between the different classes of beats. It would
be interesting to study how the features obtained when
representing the beats with a different number of Her-
mite polynomials enable the different beat families to
be separated by an automatic classifier. This will be
one of our lines of future work.
ACKNOWLEDGEMENTS
This work was supported by the Spanish Ministry
of Science and Innovation (MICINN) under grant
TIN2009-14372-C03-03.
REFERENCES
Braccini, G. and Edenbrandt, L. (1997). Self-organizing
maps and Hermite functions for classification of ECG
complexes. in Cardiology 1997, 24:425–428.
De Chazal, P. and Reilly, R. B. (2006). A patient-adapting
heartbeat classifier using ECG morphology and heart-
beat interval features. IEEE Transactions on Biomed-
ical Engineering, 53(12 Pt 1):2535–43.
Hu, Y., Tompkins, W., and Urrusti, J. (1993). Applica-
tions of artificial neural networks for ECG signal de-
tection and classification. Journal of Electrocardiol-
ogy, 26:66–73.
Jane, R., Olmos, S., and Laguna, P. (1993). Adaptive Her-
mite models for ECG data compression: performance
and evaluation with automatic wave detection. Com-
puters in Cardiology.
Lagerholm, M., Peterson, C., Braccini, G., Edenbrandt,
L., and S
¨
ornmo, L. (2000). Clustering ECG com-
plexes using hermite functions and self-organizing
maps. IEEE Transactions on Biomedical Engineer-
ing, 47(7):838–48.
Moody, G. and Mark, R. (2001). The impact of the mit-
bih arrhythmia database. Engineering in Medicine and
Biology Magazine, IEEE, 20(3):45 –50.
Park, K., Cho, B., Lee, D., Song, S., Lee, J., Chee, Y., Kim,
I., and Kim, S. (2008). Hierarchical support vector
machine based heartbeat classification using higher
order statistics and hermite basis function. In 2008
Computers in Cardiology, pages 229–232. IEEE.
OntheAccuracyofRepresentingHeartbeatswithHermiteBasisFunctions
341
