
Data Mining Tool for Decision Support in Stock Market
Sung-Dong Kim
Dept. of Computer Engineering, Hansung University, 389 Samseon-dong, Seongbuk-gu, Seoul, Republic of Korea
Keywords: Data Mining, Decision Support System, Stock Price Prediction, Neural Networks, Decision Trees.
Abstract: Stock investors want to make continuous profits in stock market. They have to choose profitable stocks and
to follow the appropriate trading policy to achieve their goal. It is difficult for individual investors to
determine what to buy and when to buy and sell. This paper proposes a data mining tool for stock investors’
decision support by recommending profitable stocks and proposing the trading policy. The proposed tool
provides three functions: stock data management, stock price prediction model generation by applying the
machine learning algorithms and the investment simulation for seeking the profitable trading policy. Users
can generate and test the stock price prediction model by selecting their own technical indicators, simulate
the trading and select the best trading policy through the evaluation of the trading results.
1 INTRODUCTION
Stock investors have a common goal of continuously
making high profits. There are many stocks in the
market and lots of information is flowing. In this
situation, investors seek the profitable stocks by
referring to the analysis results of such information.
Because they usually determine subjectively, it is
difficult for them to make profits. TradeStation is the
software which performs the technical analysis
(www.tradestation.com). The system is used in
many securities companies and includes the trading
(buying/selling) functions. This system is expensive
for individual users and the usage is difficult for
them.
This paper proposes the data mining tool for the
individual short-term investors’ decision support.
They select the stocks through analysing the
technical indicators by viewing the candle charts.
Though the prices of the selected stocks may
increase, they must determine the selling prices and
the selling time in order to achieve their goal. That is,
the investors must determine the buying stocks, the
buying price, the selling price and the selling time.
Data mining techniques are adaptible for
recommending profitable stocks from the large stock
data (Kannan, Sekar, Sathik and Arumugam, 2010).
The proposed data mining tool provides the
following functions. First, the stock data is managed
to calculate various technical indicators. Second, it
provides the technical indicator selection function by
which the users can select their own technical
indicators in building the stock price prediction
models. Third, machine learning techniques, artifical
neural networks and decision trees widely used in
financial prediction problems (Tsai and Wang, 2009),
can be applied to generate stock price prediction
models. Data generation for the machine learning is
also possible. Fourth, the investment simulation
function validates the generated stock price
prediction model and induces the profitable trading
policy. With the help of the proposed tool, users can
build the prediction model which proposes the
profitable stocks. Also, they can trade based on the
trading policy which guides the buying price, the
selling price and the holding period.
This paper is orgarnized as follows. Section 2
explains the structure and the function of the
proposed data mining tool. In section 3, we describe
the process of the stock price prediction model
generation and the investment simulation. Also, the
results of the model generation and the simulation
are presented. Section 4 concludes the paper with
further works.
2 STRUCTURE AND FUNCTIONS
OF THE DATA MINING TOOL
The proposed data mining tool supports the
individual investors’ decision making by
recommending profitable stocks and helping
473
Kim S..
Data Mining Tool for Decision Support in Stock Market.
DOI: 10.5220/0004240804730477
In Proceedings of the 5th International Conference on Agents and Artificial Intelligence (ICAART-2013), pages 473-477
ISBN: 978-989-8565-39-6
Copyright
c
2013 SCITEPRESS (Science and Technology Publications, Lda.)
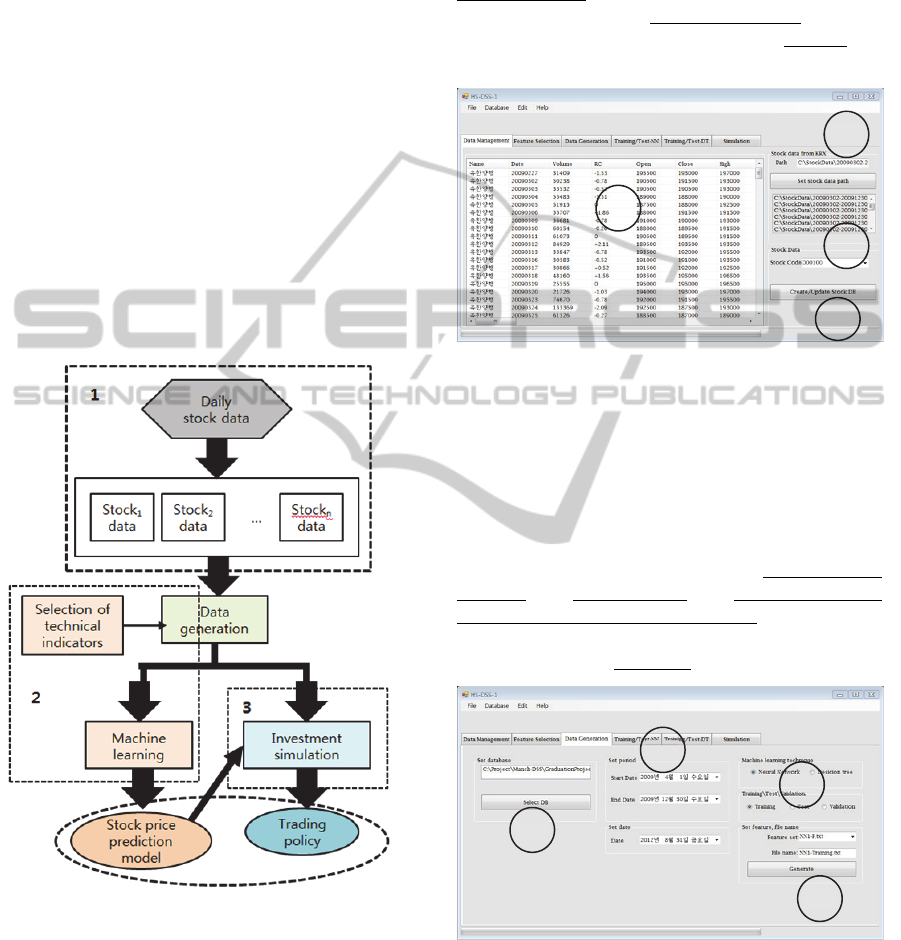
establish their own trading policy. Figure 1 shows
the logical structure of the proposed data mining tool
which consists of three modules. First is the stock
data management module (“1” in figure 1). This
module takes daily stock data from stock market and
generates data for each stock. The generated data
includes the technical indicators of each stock. The
stock database consists of such stock data. Second
module is for the stock price prediction model
generation (“2” in figure 1). In order to generate the
prediction model, users select the technical
indicators which, they think, may affect the future
price of the stocks. This module provides the
selection facility. Machine learning techniques can
be easily applied to generate the prediction model.
The investment simulation module (“3” in figure 1)
tries to back-test and presents the investment results
for various trading policies. The users analyse the
results and select one of the trading policies
satisfying their criteria.
Figure 1: The logical structure of the data mining tool.
2.1 Stock Data Management
2.1.1 Stock Database
In order to predict the future price of each stock, we
must manage the stock data individually. Korea
Exchange (KRX) provides the daily stock data
which contains data for all stocks in Korea stock
market. The data mining tool takes the daily stock
data, calculates technical indicators for each stock
and stores them in the file for each stock. Figure 2
shows the stock data management screen. After (1)
setting the path as the folder name which includes
daily stock data and (2) clicking the button, the stock
database is generated. Users can (3) confirm the
correct data generation.
Figure 2: Stock data management screen.
2.1.2 Stock Database Interface
In order to generate the stock price prediction model
by applying machine learning techniques, the
training/validation/test data is required. For an
investment simulation, test data is also required.
Figure 3 shows the stock database interface for
easily generating such data. After (1) selecting stock
database, (2) setting period, (3) selecting machine
learning algorithm and the usage of the to-be
generated data and setting the selected features, the
required data is (4) generated.
Figure 3: Stock database interface screen.
2.2 Stock Price Prediction Model
Generation
2.2.1 Selection of Technical Indicators
In building the models, the users must select
1
2
3
3
1
2
3
4
ICAART2013-InternationalConferenceonAgentsandArtificialIntelligence
474
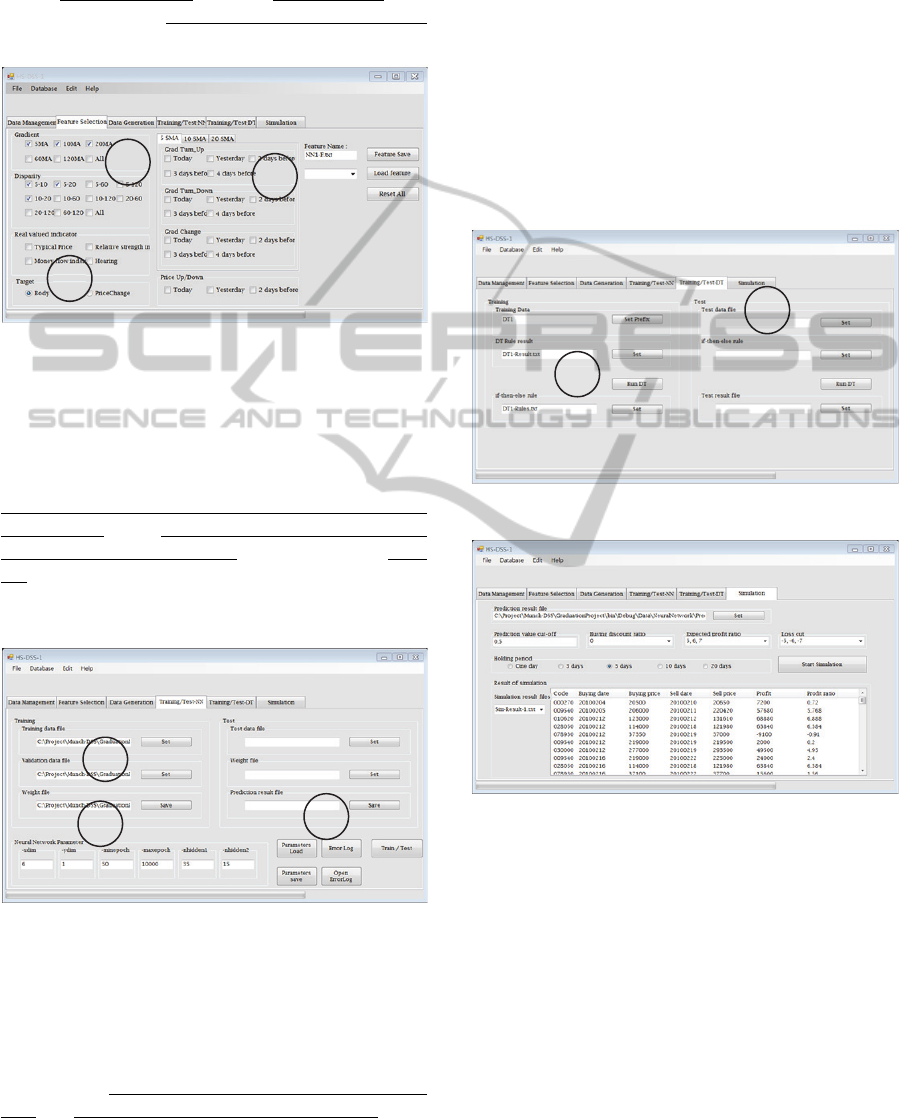
technical indicators as the features. Figure 4 shows
the screen for the technical indicator selection. The
currently available technical indicators are classified
as (1) real-valued type and (2) binary-valued one.
We consider the (3) body size and the rate of change
as the target of the machine learning.
Figure 4: Screen for technical indicators selection.
2.2.2 Applying Machine Learning
Techniques
The result of the neural networks learning is the
weights of the neural networks. Using the tool, (1)
users can specify the training, validation, test and
weight files. (2) The parameters of the neural
network can be pre-set or set by users. The (3) error
log during the training can be shown to identify the
number of training epochs for the minimum error.
Figure 5 is the screen for the neural network learning.
Figure 5: Screen for neural networks training/test.
Decision tree algorithm is appropriate for binary-
valued input. The tool provides the application of the
C4.5 algorithm (Quinlan, 1993). Figure 6 is the
screen for decision tree learning. The decision tree
learning outputs if-then-else rules. The screen
provides (1) the selection facility for the necessary
files. (2) The users can test the generated rules.
2.3 Investment Simulation
In order to make profit, the investors have to follow
the appropriate trading policy. That is, they must
determine the buying/selling price and the holding
period. We define the trading policy which consists
of 4 elements: buying discount rate (BDR), expected
profit ratio (EPR), loss cut ratio (LCR), and holding
period (HP). Users can verify various trading
policies with changing four elements of the policy.
The user compares the results and selects the best
trading. Figure 7 shows the screen for the investment
simulation.
Figure 6: Screen for decision trees training/test.
Figure 7: Investment simulation screen.
3 EXPERIMENT
We describe the process of the stock price prediction
model generation and the investment simulation. We
collect stock data from 2008/1/2 to 2010/3/17. We
construct stock database consisting of 68 stocks in
KOSPI (Korea Composite Stock Price Index) on the
screen in figure 2. For the prediction model
generation, we select the technical indicators on the
screen in figure 4. Then, we generate the
training/validation/test data files on the screen in
figure 3. We run the neural network algorithm on the
1
2
3
1
2
3
1
2
DataMiningToolforDecisionSupportinStockMarket
475

screen in figure 5. As shown in figure 5, we use two-
layer networks with 35 and 15 nodes respectively.
And the network has 6 inputs and 1 output. Through
the multiple trials of training and test, we select one
of the models with the minimum error rate. We
perform the investment simulation with the selected
prediction model on the screen in figure 7.
We generate the data as shown in table 1. The
price prediction model calculates the prediction
values for the stocks in the simulation data which are
the criteria for decision making of buying stocks.
Table 1: Data for model generation and investment
simulation.
Period # of data
Training data 2009.4.1 ~ 2009.12.30 24,548
Validation data 2008.4.1 ~ 2008.5.30 5,440
Test data 2008.6.2 ~ 2008.8.29 5,235
Simulation data 2010.2.1 ~ 2010.3.16 2,312
We perform the simulation with changing the
elements of the trading policy. Table 2 shows the
values of the elements of the trading policy used in
the simulation. We have 108 results from the
simulation and some of them are presented in table 4.
Table 2: The values of the trading policy elements for
simulation.
Elements Values
Holding period (days), H 1, 3, 5
Buying discount rate (%), B 0
Expected profit ratio (%), E 2, 3, 4, 5, 6, 7
Loss cut ratio (%), L -2, -3, -4, -5, -6, -7
Table 3: Some results of the investment simulation.
H, B, E, L
# of
profits
# of
loss
Total profit
(Won)
1, 0, 2, -2 94 66 485,080
3, 0, 2, -2 116 50 1,158,701
3, 0, 5, -5 122 40 2,257,588
5, 0, 5, -5 142 22 3,765,845
We use 0.5 as the cut-off value of the prediction
value. We have 169 transactions (one transaction
includes both buying and selling) and assume that
one million won is used to buy each recommended
stock. During the simulation period (2010/2/1 ~
2010~3/16), KOSPI rises about 2.6% from 1606.44
to 1648.01. The first line in table 4 means the
followings: the holding period is one day, the BDR,
EPR, LCR are 0%, 2%, -2% respectively. Among
169 transactions we make profits 94 times and have
loss 66 times. We got profits as 485,080 Korean
Won. Table 3 shows that the results can be
considerably different according to the different
trading policies. As a result, we can say that the user
select the trading policy outperforming the average
market profits through the investment simulation.
4 CONCLUSIONS
In this paper, we propose the data mining tool which
provides the three functions: stock data management,
the stock price prediction model generation using
machine learning techniques and the investment
simulation. The prediction model recommends the
stocks to buy and the investment simulation suggests
the trading policy. Thus, the proposed tool can
support the short-term investors’ decision-making.
Users have only to get daily stock data from
KRX and update the existing stock database. Once
the prediction model is built and the proper trading
policy is established, users can perform the objective
decision-making based on the data rather than the
emotional judgements. Users have only to get the
recommended stocks through the application of the
today’s data to the prediction model under the
established trading policy.
Other machine learning techniques, such as the
support vector machines (SVM) and the genetic
algorithms, have studied for the stock price
prediction. We will expand the data mining tool for
including such techniques. More technical indicators
are required for more sophisticated prediction
models. We will consider the asset allocation
problem in the investment simulation, which will
present more definite results and be more helpful.
ACKNOWLEDGEMENTS
This research was financially supported by Hansung
University.
REFERENCES
C. F. Tsai and S. P. Wang. 2009. Stock Price Forecasting
by Hybrid Machine Learning Techniques. Proceedings
of the International MultiConference of Engineers and
Computer Scientists. Vol. 1. 755-760.
J. R. Quinlan. 1993. C4.5: Programs for Machine Learning,
Morgan Kaufmann Publishers.
ICAART2013-InternationalConferenceonAgentsandArtificialIntelligence
476

K. S. Kannan, P. S. Sekar, M. M. Sathik, and P.
Arumugam. 2010. Financial Stock Market Forecast
using Data Mining Techniques. Proceedings of the
International MultiConference of Engineers and
Computer Scientists.
DataMiningToolforDecisionSupportinStockMarket
477
