
Local PWV and other Hemodynamic Parameters Assessment
Validation of a New Optical Technique in an Healthy Population
T. Pereira
1
, I. Santos
1
, T. Oliveira
1
, P. Vaz
1
, T. Pereira
2
, H. Santos
2
, H. Pereira
1,3
, V. Almeida
1
,
J. Cardoso
1
and C. Correia
1
1
Instrumentation Center, Physics Department, University of Coimbra, Coimbra, Portugal
2
Coimbra College of Health Technology, Coimbra, Portugal
3
ISA- Intelligent Sensing Anywhere, Coimbra, Portugal
Keywords: Optical Probe, Waveform Distension, Hemodynamic Parameters, Pulse Wave Velocity, Pulse Waveform
Analysis.
Abstract: Presently the interest in non-invasive devices for monitoring the cardiovascular system has increased in
importance, especially in the diagnosis of some pathologies. The proposed optical device reveals an
attractive instrumental solution for local pulse wave velocity (PWV) assessment and other hemodynamic
parameters analysis, such as Augmentation Index (AIx), Subendocardial Viability Ratio (SEVR), Maximum
Rate of Pressure Change (dP/dt
max
) and Ejection Time Index (ETI). These parameters allow a better
knowledge on the cardiovascular condition and management of many disease states. Two studies were
performed in order to validate this technology. Firstly, a comparative test between the optical system and a
gold-standard in PWV assessment was carried out. Afterwards, a large study was performed in 131 young
subjects to establish carotid PWV reference values as well as other hemodynamic parameters and to find
correlations between these and the population characteristics. The results allowed the use of this new
technique as a reliable method to determine these parameters. For the total of subjects values for carotid
PWV vary between 3-7.69 m s
-1
a clear correlation with age and smoking status was found out. The Aix
varies between -6.15% and 11.46% and exhibit a negative correlation with heart, and dP/dt
max
parameter
shows a significant decrease with age.
1 INTRODUCTION
The interest in non-invasive assessment of
cardiovascular function has increased over the recent
times, particularly around solutions able to perform
multi parameter assessment for monitoring and early
diagnosis of cardiovascular pathologies (Willum-
Hansen et al., 2006); (Blacher et al., 1999); (Hayashi
et al., 2002); (Weber et al., 2004).
The pulse wave velocity and the parameters
extracted from pulse waveform analysis (PWA) are
widely used tools in the evaluation of the function of
large arteries and cardiac activity, which have been
shown to predict cardiovascular diseases
(Nürnberger et al., 2003); (Huck et al., 2007).
The assessment of the cardiovascular system
condition based on multi parameters allow a more
precise and accurate diagnosis of the heart and
arterial tree condition. Risk indicators that can be
assessed from the distension waveforms acquired
through the hereby presented system, can be
determined from the main parameters extracted from
the measured and analysed waveform, as well as its
time characteristics and the pulse wave velocity.
The PWV is defined as the speed at which the
pulse pressure propagates along the arterial tree. It is
known that PWV increases with age, blood pressure
(BP) and arterial stiffness (Vermeersch et al., 2010);
(Huck et al., 2007). The reference value for regional
PWV in healthy young population is 6.2 m s
-1
(range
of 4.7-7.6 m s
-1
) (Vermeersch et al., 2010) and is
usually measured from signals acquired in the
femoral and carotid arteries. The time delay, or pulse
transit time (PTT) between the two signals is
determined through different algorithms depending
on the commercial system used, while the distance
(D) between the two arteries is externally measured.
However, the large heterogeneity of the structure of
the arterial walls at different sites constitutes an
61
Pereira T., Santos I., Oliveira T., Vaz P., Pereira T., Santos H., Pereira H., Almeida V., Cardoso J. and Correia C..
Local PWV and Other Hemodynamic Parameters Assessment - Validation of a New Optical Technique in an Healthy Population.
DOI: 10.5220/0004237600610069
In Proceedings of the International Conference on Bio-inspired Systems and Signal Processing (BIOSIGNALS-2013), pages 61-69
ISBN: 978-989-8565-36-5
Copyright
c
2013 SCITEPRESS (Science and Technology Publications, Lda.)
important limitation of PWV regional measurement
(Safar, 2007). In fact, the Expert Consensus
Document in Arterial Stiffness states that the PWV
increases from 4–5 m s
-1
in the ascending aorta to 5–
6 m s
-1
in the abdominal aorta and 8–9 m s
-1
in the
iliac and femoral arteries (Laurent et al., 2006). A
local PWV measurement technique is hence
preferred.
Some studies (Rabben et al., 2004) explored an
ultrasound method for local PWV assessment in the
carotid artery and obtained estimated PWV in the
range of 4-9 m s
-1
. In 2008 (Sørensen et al., 2008) an
experimental method for the local determination of
PWV in the carotid artery obtained values for PWV
of 3-4 m s
-1
.
The pulse wave analysis allows the non-invasive
determination of the main indices of cardiovascular
function: Augmentation Index (AIx), Subendocar-
dial Viability Ratio (SEVR), Maximum Rate of
Pressure Change (
dP/dt
max
)
and Ejection Time Index
(ETI). The most important points of the pulse
pressure waveform are presented in Figure 1. The
clinical definition for the referred parameters and the
mathematical expressions for their determination are
summarized in table 1.
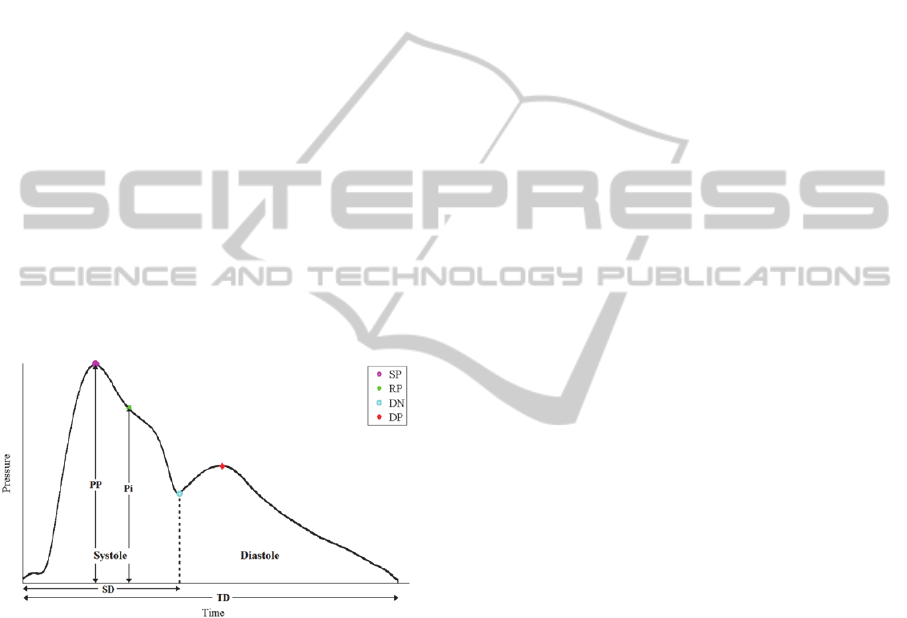
Figure 1: Typical pressure waveform of a healthy subject
and its main features used to compute the indices of
cardiovascular function: pulse pressure (PP), systolic peak
(SP), reflection point (RP), dicrotic notch (DN), dicrotic
peak (DP), systolic duration (SD), total duration (TD) and
pressure in the reflection point (Pi).
If the backward wave arrives before the systolic
peak, the AIx parameter, by definition, has a positive
value due to the contribution of the increased
systolic pressure. If the backward wave arrives later,
it does not contribute to the increased pressure,
turning the AIx values negative.
Taking into account the existing commercial
devices, a new solution based on optical technology
was developed and demonstrably benefits by a non-
contact and more accurate measure and multi
parameter assessment ability (Pereira et al., 2011).
The PWV assessment from the commercial
system consists always on a regional measurement,
between two peripheral arteries as already described.
With this work a local measure of PWV is proposed,
where two measures are taken at the carotid artery,
simultaneously and separated by a 20 mm distance
(Pereira et al., 2011).
The carotid artery is the natural probing site for
pulse waveform measurement, due to the heart
proximity and because it is easily accessible due to
its proximity to the skin surface.
The objective of this study was to validate the
optical system for PWV and PWA measurements.
Firstly, it was intended to assess the values for local
PWV, to establish its reference values for the carotid
artery in a young and healthy population and
validate the technology for hemodynamic
parameters assessment from the pulse pressure
waveform. The study also aimed to find correlations
between hemodynamic parameters with the
population characteristics such as age, gender,
smoking, body mass index, blood pressure or heart
rate: main characteristics described in the literature
and have significant impact in the cardiovascular
system evaluation.
2 TECHNOLOGY
The pressure wave, generated by the contraction of
the left ventricle, originates a distension wave that
propagates through the aorta and other proximal
elastic arterial walls. The distensibility is determined
as the ratio between the variation of volume from
diastole to systole and the variation of pressure that
origins that distension in the arterial wall (Laurent et
al., 2006).
Previous studies on comparison between
pressure and distension waveforms have shown that
these waves can be used interchangeably for many
analysis due to their similar wave contour (Laurent
et al., 2006); (Boutouyrie et al., 2009); (Kips et al.,
2010); (Vermeersch et al., 2008).
The proposed probes were developed to measure
the arterial pulse wave profile at the carotid site and
are based on the reflectance fluctuations of the skin
surface during the underlying pulse wave
propagation. The propagation of the pulse pressure
waveform causes distension in the artery wall. This
distension, known as distension wave, changes the
optical reflectance angle of the wall which produces
a change in the reflection characteristics of skin,
causing an amplitude modulation of the light. This
BIOSIGNALS2013-InternationalConferenceonBio-inspiredSystemsandSignalProcessing
62
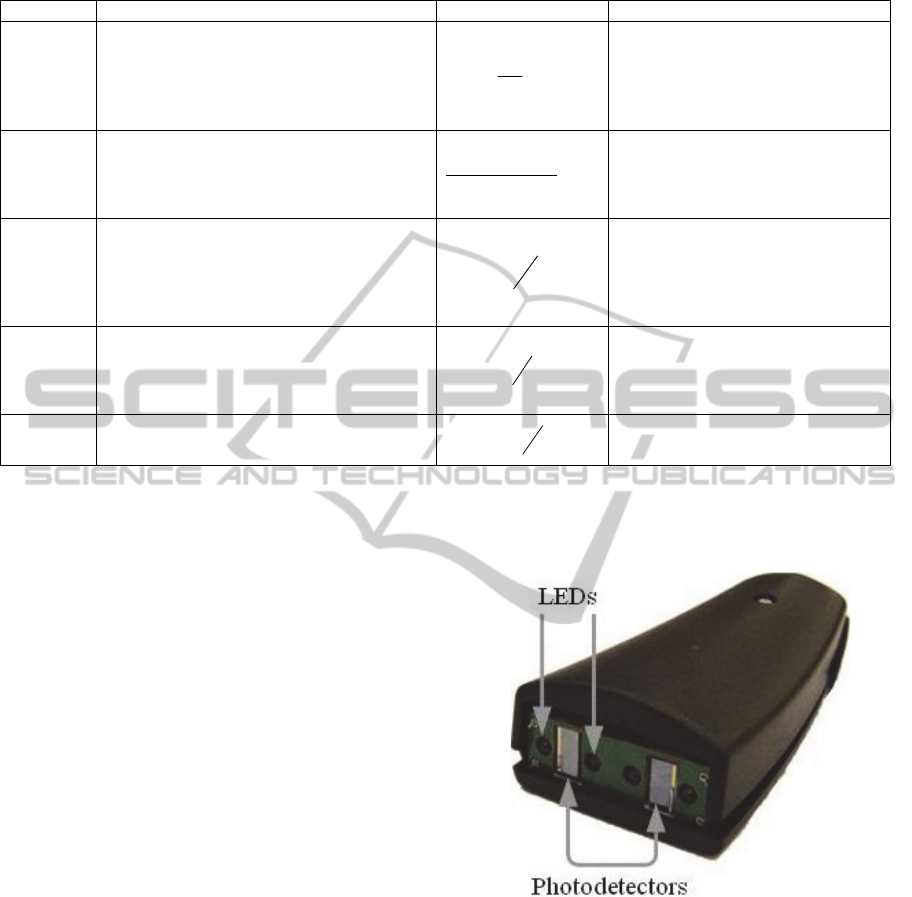
Table 1: Main parameters from pulse waveform analysis.
Parameter Definition Formula Reference Values
AIx
Describes the increase of systolic blood
p
ressure due to an early backward wave,
produced by the reflection of the forward
systolic wave on the peripheral arterial tree
structure.
100
P
P
Pi
- 22 to 40 (%)
(Siebenhofer et al. 1999)
SEVR
Parameter that estimates the myocardial
oxygen supply-demand relative to the cardiac
workload. It is an indicator of subendocardial
ischaemia.
100
)(
)(
dttSystole
dttDiastole
119 to 254 (%)
(Siebenhofer et al. 1999)
dP/dt
max
The ventricular contractility can be evaluated
by the maximum rate of pressure change,
which gives information about the initial
velocity of the myocardial contraction, which
is also an index of myocardial performance.
dt
dP
772 ± 229 (mmHg/s)
(Payne et al. 2007)
ETI
Ventricular systolic ejection time between the
aortic valve opening and closing. It is an
important component on the evaluation of the
left ventricular performance.
TD
SD
30 to 42 (%)
(Istratoaie et al. 2010)
PWV
The velocity at which the
p
ulse wave
propagates along a length of artery.
D
PTT
6.2 (4.7 to 7.6) (m s
-1
)
(Sebastian J Vermeersch et al. 2010)
*PTT represents the delay between two acquired signals; D is the distance between two sensors that compose the optical probe.
effect can be used to generate an optical signal that
correlates with the passing pressure wave.
The illumination source is provided by local,
high brightness, 635 nm monochromatic light
emitting diodes (LEDs) and the light detection is
performed by two photodetectors, placed at a precise
distance of 20 mm apart. This guarantees the local
pulse wave profile assessment at two distinct spots,
providing the precise local determination of pulse
transit time (PTT) and thus of the local PWV. The
probe structure is enclosed in a plastic box with an
ergonomic configuration, comfortable to the patient
and simple to use by the operator (figure 2).
The plastic case contacts with the patient skin
although neither the LEDs nor the photodetectors
does. The electronic components remain at a fixed
distance, few millimetres from the skin ensuring a
totally non-contact and non-invasive local PWV
assessment.
Previous bench tests had shown that the optical
probe is capable of accurately measure PTT as short
as 1 ms with less than 1% of error, one can
guarantee the capability of the probes in truthfully
determine local PWV (Pereira et al., 2011).
The comparison tests to evaluate the capability
of the developed device in accurately detect the
pulse waveform were carried out using an ultrasound
imaging system, as source of reference data. When
compared with ultrasound system, the optical
sensors allow the reproduction of the arterial
waveform with a much higher time resolution,
adequate to feed feature extraction algorithms
(Pereira et al., 2011).
Figure 2: Structure of the optical probe with photodetector
and visible light sources (LEDs), inside an ergonomic
plastic box.
The signals from the photodetectors were
digitized with a 16-bit resolution data acquisition
system (National Instruments, USB6210
®
) with a
sampling rate of 20 kHz and stored for offline
analysis. All the algorithms were developed using
Matlab
®
7.8.0 (R2009a).
LocalPWVandOtherHemodynamicParametersAssessment-ValidationofaNewOpticalTechniqueinanHealthy
Population
63
3 PRELIMINARY VALIDATION
STUDY
In order to validate the data obtained by the
developed optical system, a number of volunteers
were previously submitted to a signal acquisition
procedure, using simultaneously the proposed
optical device and a gold-standard in the PWV
assessment, a Complior Analyse
®
device. This
preliminary study was undertaken in 14 healthy
subjects (9 females, average age 23.2±5.5 years).
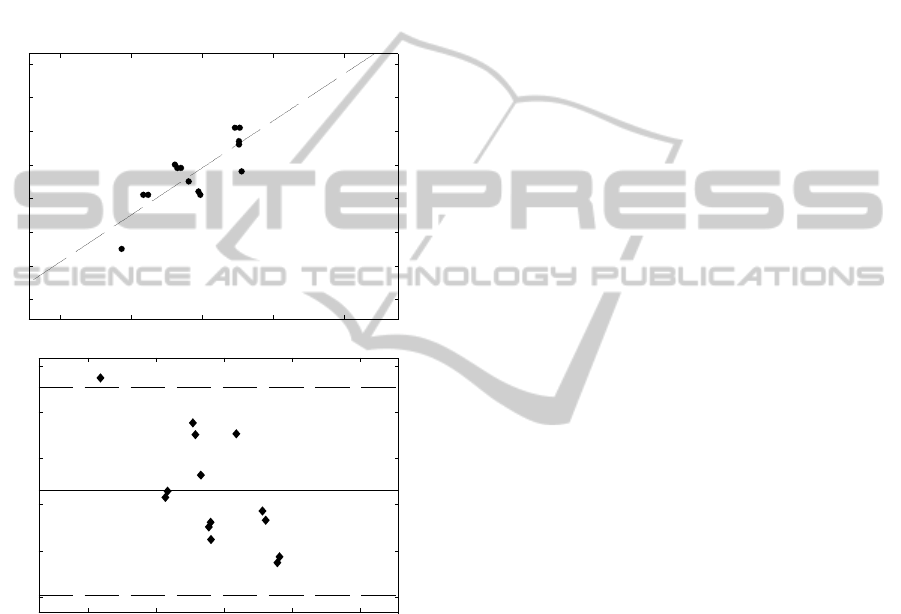
Figure 3: Correlation between the two systems (Complior
®
and Optical probe) for PWV determination (top). Bland-
Altman plot (bottom) displaying the difference between
the two systems (Complior
®
and Optical probe) as a
function of the average of the determined PWV.
The results showed a great consistency between
the PWV obtained with the two devices. In spite of
this comparison, it is worth to note that the nature of
the PWV determination is different between the
optical system, that is based on local assessment
(carotid artery measure) and the Complior
®
system,
which is based on a regional assessment (carotid-
femoral measures).
Using a non-parametric correlation analysis
between the values obtained from the two systems,
the Pearson correlation value is 0.819, which is a
strong correlation and significant at the 0.01 level
(2-tailed).
The agreement between the PWV values
obtained by the Complior
®
and the optical probe is
shown in figure 3 (top). The values of PWV
obtained by the two systems are correlated (r
2
=
0.67). The average difference between the two
systems, Complior
®
and Optical probe, was -1.8557
m s
-1
with a SD of 0.5744 m s
-1
as shown in a Bland-
Altman plot in figure 2 (bottom). As one can
observe in figure 3 (top), there is a tendency to have
systematic lower values from the optical probe
device than Complior
®
. Again, it is important to bear
in mind that the values obtained using both devices
correspond to different PWV determination
processes (local vs. regional) and lower values are
expected for PWV in the carotid (local) than the
PWV in a carotid-femoral measurement (regional).
This issue could explain the associated deviate of
final values.
Taken together, these results allow the use of this
proposed optical system as a reliable method to
determine local carotid PWV.
4 STUDY PROTOCOL
The central purpose of these tests is to assess the
main hemodynamic parameters extractable from the
pressure waveform features and pulse wave velocity,
in a young and healthy population using the optical
system.
The complete study database contains 131
subjects constituting a representative cohort of 18–
35 year old subjects randomly sampled. The study
protocol was approved by the ethical committee of
the Centro Hospitalar e Universitário de Coimbra,
EPE Portugal. All the subjects were volunteers and
gave a written informed consent.
Measurements were performed after a rest period
in a temperature-controlled environment. Each exam
procedure consisted in the acquisition of a set of
cardiac cycles at the carotid artery during few
minutes, with the patient lying in supine position.
The assessment of the arterial blood pressure
(ABP) by conventional measurement using an
automated digital oscillometric sphygmomanometer
(Omron Matsusaka Co., Ltd., Japan) was performed
prior and after the exam for reference purposes. The
diastolic and systolic pressures of arm blood
pressure were used to calibrate the system.
2 3 4 5 6
2
3
4
5
6
7
8
9
PWV Optical Probe (m/s)
PWV Complior (m/s)
PWV complior = 1.4*PWV optical + 0.32
3 4 5 6 7
-3
-2.5
-2
-1.5
-1
-0.5
Difference in two systems (m/s)
Mean of two systems (m/s)
BIOSIGNALS2013-InternationalConferenceonBio-inspiredSystemsandSignalProcessing
64

5 SIGNAL PROCESSING
The stored signal data were processed offline in
order to parameterize the arterial pulse waveform
and to calculate the corresponding cardiovascular
performance indexes. A set of dedicated pre-
processing algorithms were developed to segment
the data stream in single cycles, generate an average
pulse and identify the corresponding remarkable
points in the waveform profile. Following this stage,
the signal streams underwent the full processing
sequence to determine all the significant APW
features and indexes along with the local PWV.
The pulse wave velocity was determined by a
cross-correlation method, based on the property of
the peak of the cross correlogram, from which time
delays can be calculated by subtracting the peak
time position from the pulse length.
The pulse wave analysis is based on differential
calculus, and uses zero-crossing of the three first
derivatives. The remarkable points were found by
means of an iterative third-order derivative method,
with which the consecutive zero-crossing of the first,
second and third derivatives are used to detect
inflection points that correspond to the clinically
interesting features of the waveform.
An assessment of ABP by conventional
measurement using a sphygmomanometer was
conducted prior and after the exam for calibration
purposes. Both brachial diastolic (DBP) and mean
arterial pressure (MAP) values were used to
calibrate the system. Studies have reported that
MAP is relatively constant along the arterial tree and
that DBP do not vary considerably between the
carotid and brachial arteries, whereas systolic blood
pressure (SBP) increases along the arterial tree
(Lamia et al., 2005); (Safar, 2007). Thus, we made
the assumption that brachial DBP and MAP are
approximately the same as carotid DBP and MAP.
These values were used to calibrate the carotid
pressure waveform as recommended and according
to the calibration method proposed by Kelly and
Fitchett (Kelly and Fitchett, 1992); (Laurent et al.,
2006); (Proudfoot, 2009).
6 RESULTS
The characteristics of the volunteers are presented in
Table 2. The group consisted of 131 subjects (62
men and 69 women), normotensive and with no
documented history of cardiovascular disorders or
diabetes, with mean (±SD) age of 22.6±5.3 years
old.
Table 2: Main characteristics of the volunteers.
Characteristics
n, Males/Females 131 (62/69)
Age, year 22.6±5.3
Height, cm 169.2±0.1
Weight, kg 64.5±13.2
BMI, kg/m
2
22.4±3.2
Brachial SBP
*
, mmHg 113.3±14.5
Brachial DBP
*
, mmHg
Brachial MAP
*
, mmHg
Estimated Carotid SBP
**
, mmHg
72.7±9.9
86.2±10.4
99.1±12.2
Heart Rate
*
, bpm 69.0±11.7
Values are numbers or means ±SD.
BMI indicates body mass index; SBP, systolic blood pressure; DBP,
diastolic blood pressure.
* Measure in brachial, with commercial sphygmomanometer
(blood pressure cuff).
** Determined using the calibration method
The results for the parameters that were assessed
by the optical probe are presented in the next
sections. Data are reported as mean values (± SD) or
95% confidence intervals, with P<0.05 considered
significant unless stated otherwise. The Shapiro-
Wilk test of normality was used to assess the
normality of the variables distribution. Mean
differences between variables were assessed using
ANOVA. The strength of the association between
two variables was assessed using Pearson
Correlation, for normal distributions, unless stated
otherwise.
All statistical analyses were performed with
Analytics Software Statistics 18.0.0 (SPSS, Inc,
Chicago, IL).
6.1 Carotid PWV Results
In a total of 131 subjects the mean value for PWV is
3.33±0.72 m s
-1
(range of 2.00-5.13 m s
-1
). The
results obtained for PWV approximated a normal
distribution. Statistically negligible differences
between genders were found. For females the mean
of PWV is 3.31±0.64 m s
-1
and for males is
3.35±0.81 m s
-1
.
It is well documented in other studies that PWV
tends to increase with age (Vermeersch et al. 2010).
Since the population under study is young we
categorized it in three groups: under 20 years (22
subjects), 21-29 years (93 subjects) and over 30
years old (16 subjects).
The correlation between PWV and age is weak
(0.244) but significant with a 2-tailed significance
value of 0.008 (p<0.01). The comparison of PWV
mean values among the different age categories
using ANOVA shown this statistically significant
difference, with a significance value = 0.024
LocalPWVandOtherHemodynamicParametersAssessment-ValidationofaNewOpticalTechniqueinanHealthy
Population
65
(p<0.05). The PWV mean value (±SD) for each age
category is 2.96±0.52 m/s for the less than 20 years
old group, 3.38±0.7 m/s for the 20-29 years group
and 3.58±0.7 m/s for subjects above 30 years old
(figure 4).
It was hypothesized whether there is a
statistically significant difference for PWV, between
smoker and non-smoker subjects. The data analysis
shows that smoking influences significantly the
PWV.
Figure 4: PWV by age category. The continuous line
connects mean values; error bars indicate the 95%
confidence interval of the sample mean.
Figure 5: Bar plot of PWV by smoking status. The error
bars indicate the 95% confidence interval of the sample
mean.
These results show a small but significant
correlation between PWV and smoking with a 2-
tailed significance value of 0.016 (p<0.05). Non-
smoker subjects presented a PWV mean value (±SD)
of 3.29±0.72 m s
-1
while smoker subjects showed a
mean PWV value of 3.81±0.6 m s
-1
, represented in
figure 5.
The comparison of PWV mean values among
these two groups using ANOVA confirms the
statistically significant difference between the
obtained PWV for smokers and non-smokers, with a
significance value = 0.021 (p<0.05).
The data suggests that, in spite of having a young
population, smoking would significantly influence
the arterial stiffness, thus leading to increased PWV.
Similar findings have been reported by N. Jatoi et al.
(Jatoi et al., 2007).
Contrary to expectations, no significant
correlation between blood pressure and PWV was
found. This contrasts with other studies where this
correlation is verified (Padilla et al., 2006);
(Vermeersch et al., 2010).
6.2 AIx Results
For the total of the subjects in study, the mean value
for AIx is -6.151±11.46% (range -44.31% to 24.26
%).
Small differences between genders were verified,
as the female mean of AIx is -5.59±1.36% and the
male is -6.93±1.59%. However, this difference did
not reach the statistical significance threshold
(P>0.05).
Also for this parameter, as well as for PWV,
statistically differences between smoker and non-
smoker subjects were found. AIx is higher for
smokers (-4.33±4.42%) than for non-smokers (-
6.35±1.04%), this shows that for smokers the
reflected wave arrives earlier in time, which is
consistent with a slight higher the arterial stiffness.
The negative correlation between the AIx and the
heart rate was described in other tests (Wilkinson et
al., 2000); (Weber et al., 2004b) and was confirmed
in this study (figure 6). The results of Person-
Correlation test were compatible with a significant
negative correlation, between heart rate (HR) and
AIx at a 0.05 level (2-tailed). Nevertheless, the
strength of the relationship found between these two
variables is medium, since the Pearson Correlation is
significant with a 2-tailed significance value of -
0.226 (p<0.05). The comparison of AIx mean values
among these three groups using ANOVA confirms a
statistically significant difference, with a
significance value = 0.024 (p<0.05).
The negative correlation between these two
parameters is explained due to the early return of the
reflected wave in systole when HR is lower, and the
long period of heart contraction.
BIOSIGNALS2013-InternationalConferenceonBio-inspiredSystemsandSignalProcessing
66

Figure 6: The continuous line connects plots of AIx mean
by heart rate category, with error bars representing the
95% confidence interval of the sample mean.
6.3 Other Hemodynamic Parameters
Results
The Ejection Time Index, Subendocardial Viability
Ratio and Maximum Rate of Pressure Change
are
other hemodynamic parameters assessed by the
optical system, and the results for the population in
study are shown in table 3.
It is remarkable that the mean values of SEVR
and ETI stay within the range presented by other
studies (table 1) even though it is clear that they
show a wide variation. For the SEVR parameter it
was also verified a decrease with the heart rate
(figure 7) with a significant variance (ANOVA,
P=0.01) and a significant Pearson correlation at 0.01
level (2-tailed).
Table 3: Hemodynamic Parameters obtained with the
Optical System.
Min. Max. Mean SD
SEVR (%) 86.41 412.25 176.86 53.44
dP/dt
max.
(mmHg/s)
212.59 953.33 443.92 151.68
ETI (%) 14.33 47.17 33.96 6.37
The derived values for dP/dt
max
differ
substantially from the ones presented by other
studies, a wider range than the expected and a
smaller mean value is evident probably originated by
the differences in the calibration method used.
However, a relation between dP/dt
max.
and gender,
was found, since the Pearson Correlation is -0.408.
The female subjects showed lower values for this
parameter, which are represented in figure 8.
The dP/dt
max
values decrease significantly with
subjects’ age, this allows the inferring that with the
increasing age the velocity of the myocardial
contraction is lower, meaning that there is a decrease
in the myocardial performance.
Figure 7: Box plot of data from the determined SEVR
versus heart rate categories.
Figure 8: Error plots of dP/dt
max
mean values according to
gender. The error bars represent the 95% confidence
interval of the sample mean.
For the ETI parameter there were verified slight
differences between gender, the mean vales for the
females is 36.80±0.72% and for males 33.60±0.85%.
This suggests that there is a shorter systole during
cardiac cycle in males than in females. Also for this
parameter, a significance correlation with heart rate
was found since the Pearson Correlation is -0.408.
7 CONCLUSIONS
These trial tests were carried out in a large group of
young and healthy subjects. This study has
attempted to validate the proposed optical system as
LocalPWVandOtherHemodynamicParametersAssessment-ValidationofaNewOpticalTechniqueinanHealthy
Population
67

a reliable method to assess non-invasively local
PWV in the carotid artery, to establish reference
values of the local PWV as well as other mentioned
parameters in this type of population.
Previously, this new system had also proved to
be reliable in reproducing the arterial waveform with
a higher resolution, adequate to feed feature
extraction algorithms, when compared to an
ultrasound image system that was used as a
reference for comparison.
Besides of the ability of the optical system in
acquiring non-invasively a carotid distension
waveform with high definition, the presented optical
system shows other advantages over the actual
commercial devices.
One advantage of this optical approach relies on
being a non-contact technique that avoids the
drawback of pressure application as happens with
piezoelectric transducers that could result in the
distortion of the signal of interest.
Another benefit is the possibility of local PWV
assessment, in a single arterial segment, avoiding
coarse approximations of the distance between test
points constituting an important advance in the PWV
assessment.
The validation test, in which the obtained values
using the optical probes were compared with those
obtained with a commercial device are supported by
all the previous bench test results and allowed to
consider this technique as a valid method to assess
PWV and analyse PWA parameters.
The range of the obtained values for local CA
PWV are in agreement with the values obtained by
other studies that also assessed the carotid local
PWV. The expected and obtained lower values of
the carotid PWV assessment when compared to
those obtained with Complior
®
device are due to the
different PWV determination processes (local vs.
regional). The lack of compatibility between
methods limits the inferences that can be made and
thus, more studies of repeatability, comparing the
local PWV obtained by the optical system with the
values estimated by ultrasound data, are necessary to
ensure accuracy of the proposed system.
The PWV measured by the optical probe
confirmed a significant increase of PWV with age.
Even though the sample consists of young subjects
with a relatively narrow age distribution, this result
generally agrees with those obtained in other studies.
The PWA parameters revealed the important
relations between some characteristics of the
population and the arterial system status. The
negative correlation between the AIx and the heart
rate were verified in this study, and differences
between gender and smokers/non-smokers were
found.
For the SEVR parameter was also verified a
decrease with the heart rate. The dP/dt
max.
analysis
showed a difference with gender, with lower values
for the female subjects, and this parameter decreased
significantly with age.
All the correlations obtained in this study
showed that the age contributes to the arterial
stiffness as reflected in the values found for the
various parameters. Smokers appear to have higher
arterial age, and therefore increased cardiovascular
risk.
The optical system under study proved to be a
good choice for the determinations of hemodynamic
parameters in a non-invasive and non-contact
assessment, which allows a better knowledge about
the cardiovascular condition and the management of
many disease states.
Although this method provides a set of
parameters strongly related to pulse waveform
morphology it needs a proper and extensive gold
standard comparison with an invasive system.
Finally, it is worth mentioning that, in spite of its
lack of maturity (meaning that many engineering
aspects of the probe can still be improved), the
proposed method exhibits a very high patient hit
success .In fact, for 119 out of 131 patients (90%) it
took around 1 to 2 mins to start acquiring reasonable
quality signals, each take lasting for 30 seconds.
Although some training is required, the method is
much less demanding on the operator skills as
compared to ultrasound, Complior
®
or tonometer.
ACKNOWLEDGEMENTS
The authors acknowledge the clinical collaboration
from Dr. Rui Providência and Coimbra College of
Health Technology, and acknowledge the support
from Fundação para a Ciência e Tecnologia (FCT)
for funding (PTDC/SAUBEB/ 100650/2008).
Project developed under the initiative of QREN,
funding by UE/FEDER, through COMPETE -
Programa Operacional Factores de Competitividade.
REFERENCES
Blacher, J. et al., 1999. Aortic Pulse Wave Velocity as a
Marker of Cardiovascular Risk in Hypertensive
Patients. Hypertension, 33(5), pp.1111-1117.
Boutouyrie P. et al., 2009. Assessment of pulse wave
velocity. Elsevier.
BIOSIGNALS2013-InternationalConferenceonBio-inspiredSystemsandSignalProcessing
68

Hayashi, T. et al., 2002. Reflection in the Arterial System,
pp.405-409.
Huck, C. J. et al., 2007. Noninvasive measurements of
arterial stiffness: repeatability and interrelationships
with endothelial function and arterial morphology
measures. Vascular health and risk management, 3(3),
pp.343-9.
Istratoaie, O. et al., 2010. Central Aortic Pressure
Estimated By Radial Applanation Tonometry in
Hypertensive Pulmonary Oedema. Journal of
Hypertension, 28.
Jatoi, N. a et al., 2007. Impact of smoking and smoking
cessation on arterial stiffness and aortic wave
reflection in hypertension. Hypertension, 49(5),
pp.981-5.
Kelly, R. & Fitchett, D., 1992. Noninvasive determination
of aortic input impedance and external left ventricular
power output: a validation and repeatability study of a
new technique. Journal of the American College of
Cardiology, 20(4), pp.952-963.
Kips, J. et al., 2010. The use of diameter distension
waveforms as an alternative for tonometric pressure to
assess carotid blood pressure. Physiological
measurement, 31(4), pp.543-53.
Lamia, B. et al., 2005. Clinical review: interpretation of
arterial pressure wave in shock states. Critical care
(London, England), 9(6), pp.601-6.
Laurent, S. et al., 2006. Expert consensus document on
arterial stiffness: methodological issues and clinical
applications. European heart journal, 27(21),
pp.2588-605.
Padilla, J. M. et al., 2006. Assessment of Relationships
between Blood Pressure, Pulse Wave Velocity and
Digital Volume Pulse. Computers in Cardiology, 33,
pp.893-896.
Payne, R. a et al., 2007. Augmentation index assessed by
applanation tonometry is elevated in Marfan
Syndrome. Journal of cardiothoracic surgery, 2, p.43.
Pereira, T. et al., 2011. Optical Methods For Local Pulse
Wave Velocity Assessment. BIOSIGNALS 2011,
Rome, Italy.
Pereira, T. et al., 2011. Visible and infrared optical probes
for hemodynamic parameters assessment. 2011 IEEE
SENSORS Proceedings, pp.1796-1799.
Pereira T. et al., 2011. Signal Analysis in a New Optical
Pulse Waveform Profiler for Cardiovascular
Applications. Signal and Image Processing and
Applications / 716: Artificial Intelligence and Soft
Computing, (Sipa), pp.19-25.
Proudfoot, N. A., 2009. The acute effects of moderate
intensity exercise on vascular stiffness in children with
repaired coarctation of the aorta.
Rabben, S. I. et al., 2004. An ultrasound-based method for
determining pulse wave velocity in superficial arteries.
Journal of biomechanics, 37(10), pp.1615-22.
Safar, M. E., 2007. Arterial Stiffness : A Simplified
Overview in Vascular Medicine.
Atherosclerosis,
Large Arteries and Cardiovascular Risk, 44, pp.1-18.
Siebenhofer, a et al., 1999. The reproducibility of central
aortic blood pressure measurements in healthy subjects
using applanation tonometry and
sphygmocardiography. Journal of human
hypertension, 13(9), pp.625-9.
Sørensen, G. L. et al., 2008. Pulse Wave Velocity in the
Carotid Artery 1(1), pp.1386-1389.
Vermeersch, S. J. et al., 2008. Determining carotid artery
pressure from scaled diameter waveforms: comparison
and validation of calibration techniques in 2026
subjects. Physiological measurement, 29(11),
pp.1267-80.
Vermeersch, Sebastian J, Dynamics, B. & Society, L.,
2010. Determinants of pulse wave velocity in healthy
people and in the presence of cardiovascular risk
factors: “establishing normal and reference values”.
European heart journal, 31(19), pp.2338-50.
Weber, T. et al., 2004. Arterial stiffness, wave reflections,
and the risk of coronary artery disease. Circulation,
109(2), pp.184-9.
Wilkinson, I.B. et al., 2000. The influence of heart rate on
augmentation index and central arterial pressure in
humans. The Journal of physiology, 525 Pt 1, pp.263-
70.
Willum-Hansen, T. et al., 2006. Prognostic value of aortic
pulse wave velocity as index of arterial stiffness in the
general population. Circulation, 113(5), pp.664-70.
LocalPWVandOtherHemodynamicParametersAssessment-ValidationofaNewOpticalTechniqueinanHealthy
Population
69
