
Quantitative Analysis of the Effect of Prolonged Mechanical
Ventilation on Capnographic Indices
Carmen Caroline Rasera
1
, Pedro Miguel Gewehr
1
and Adriana Maria T. Domingues
2
1
Biomedical Engineering Programme, Parana Federal University of Technology (UTFPR) Parana, Brazil
2
Department of Cardiac Intensive Care Unit, Pequeno Principe Hospital, Parana, Brazil
Keywords: Monitoring Device, End-tidal Carbon Dioxide Pressure, Capnogram, Invasive Mechanical Ventilation.
Abstract: The monitoring of carbon dioxide pressure through Capnography has been clinically used as a continuous
and non-invasive measurement of alveolar ventilation. The patients with lung disease, respiratory and
hemodynamic instability and when in mechanical ventilation have a significant alteration in the waveform
of the capnogram. In this study, quantitative analysis between capnographic indices of the patients under
prolonged mechanical ventilation were obtained and compared to waveforms of spontaneously breathing
patients. The measurements were performed at the 10
th
day of invasive mechanical ventilation and 48 hours
after tracheal extubation, totalling 52 capnographic curves. PaCO
2
and PetCO
2
measurements maintained a
significant correlation in spontaneously breathing patients (r
2
= 0.97, p<0.001) and a weak correlation in
patients during prolonged mechanical ventilation (r
2
= 0.86). Four waveform parameters (intermediate slope,
alpha angle, beta angle and area ratio) were identified as altered. These altered parameters can provide
guidance to physicians about the physiological interpretation of capnograms and clinical decision. Proper
interpretation of the capnogram can alert a clinician to important changes in mechanical ventilatory
parameters in order to obtain a capnographic wave closest to normal thereby improving the lung function of
patients.
1 INTRODUCTION
Capnogram is the graphical waveform which
describes the carbon dioxide (CO
2
) concentration
throughout respiration, it is a curve obtained by
continuous and non-invasive recording of the CO
2
partial pressure in a sample of expiratory air,
providing a measurement of alveolar ventilation
(You et al., 1994); (Roy et al., 2007). Besides it is
useful to assess respiratory disorder in patients under
invasive mechanical ventilation (IMV), capnography
is also capable to detect changes in pulmonary blood
flow, monitoring the function alveolar and CO
2
production (Belpomme et al., 2005); (Cheifetz and
Myers, 2007).
The information provided by the capnography, as
end-tidal CO
2
pressure (PetCO
2
) and the waveform
capnogram can be used as a tool to diagnose
pulmonary problems and respiratory monitoring
during the time that the patient remains in IMV
(Thompson and Jaffe, 2005); (Roy et al., 2007). The
device can also be used to monitor patients in
emergency response situations, during anesthesia
procedure and pediatric intensive care unit (ICU)
(Langhan, 2009).
The normal capnogram has a rectangular wave
model, measured by alternating inspiratory and
expiratory phases (Gravenstein et al., 2011).
Expiration itself consists of three stages as follow:
Phase I represents the anatomical dead space, during
phase II occurs a mixture of anatomical and alveolar
dead space and phase III represents the expiration of
CO
2
rich gas (Figure 1) (Cheifetz and Myers, 2007).
Figure 1: Example of a normal capnogram with the
inspiratory (phase 0) and expiratory phases (I, II and III),
α and β angles and PetCO
2
value.
253
Rasera C., Gewehr P. and T. Domingues A..
Quantitative Analysis of the Effect of Prolonged Mechanical Ventilation on Capnographic Indices.
DOI: 10.5220/0004229102530256
In Proceedings of the International Conference on Biomedical Electronics and Devices (BIODEVICES-2013), pages 253-256
ISBN: 978-989-8565-34-1
Copyright
c
2013 SCITEPRESS (Science and Technology Publications, Lda.)

The maximum value reached at the end of phase
III is referred to PetCO
2
, which precedes the start of
the following inspiration. These three phases are
separated by two well-defined transitions: α and β
angles (Thompson and Jaffe, 2005).
Waveform indices of CO
2
can be easily
calculated. Furthermore, trends could provide useful
information for pulmonary diagnostic from patient.
However, it should be noted that their values cannot
be uniquely linked to physical respiratory
parameters. Other approaches to calculate waveform
parameters are necessary in pediatric practice
(Benallal and Busso, 2000); (Op Den Buijs et al.,
2006). Thus, the aim of this paper is to establish the
quantitative relationship between shape indices of
the patients under prolonged IMV after cardiac
surgery and the waveforms obtained 48 hours after
tracheal extubation of these patients in ICU.
2 METHODS
This study was approved by the ethics committee of
Pequeno Principe Hospital, Curitiba, Brazil. The
research was carried out in the hospital’s cardiac
ICU between September 2011 and January 2012.
Informed consent was obtained from the parents or
the caregivers responsible for the patients.
A total of 52 infants were evaluated from 2 days
to 3 months of age, both sexes. The characteristics of
the patients are presented in table 1. Patients who
had sepsis, some respiratory complication (e.g.
pneumonia and pleural effusion) or the children who
passed away were excluded.
The capnographic curves were analyzed in two
moments during the period that the patient remained
in ICU: A) Prolonged IMV: measurements were
performed at the 10
th
day of mechanical ventilation;
B) Spontaneously breathing: measurements were
performed two days after tracheal extubation with
the spontaneously breathing infant.
Table 1: Characteristics of the patient.
Characteristic Patient (n = 52)
Age (month) 1.37 ± 0.6
Sex (male/female) 19/33
Weight (kg) 2.32 ± 1.6
Vital Parameters
Cardiac Frequency
Respiratory Frequency
Body temperature (ºC)
Pulse Oxygen Saturation (%)
Instant A
79.3 ± 3.8
28 ± 2.3
36.1 ± 1.2
92.4 ± 3.2
Instant B
80.1 ± 1.4
18 ± 2.1
36.7 ± 1.3
99.2 ± 1.2
Values are expressed as mean ± standard deviation or number of
patients.
Patients undergoing IMV were ventilated by
Inter 5 Ventilator (Intermed, São Paulo, Brazil),
using limited pressure, time-cycled ventilators in
assistcontrol mode.
Samples for arterial blood gas analysis were
obtained from a catheter in the radial artery by using
a heparinised syringe (Monovette LH, Nümbrecht,
Germany). The blood gas measurements were
obtained using a Cobas B121 system (Roche,
Mannheim, Germany) that was calibrated daily.
PetCO
2
was monitored using a sidestream
capnography module (Figure 2) (CO
2
CGM OA1000,
Ronseda, Shenzhen, China) placed between
endotracheal tube and the circuit of ventilator
through an airway adapter in moment A; and it was
adapted to nasal catheter in moment B. The CO
2
monitoring began immediately after calibration.
Figure 2: Sidestream capnography module.
In order to measure the deformation of
capnogram related to time; some variations of
waveform parameter were calculated; they were
defined in relation to the beginning of expiration
(T
0
), i.e. from the start of phase II on the
capnographic curve.
Six waveform indices have been tested from a
single capnographic curve (Figure 3):
Three indices measured the capnogram slope
during the expiration period. The slopes were
obtained by linear regression of CO
2
versus time:
- S
1
:
initial slope measured from 0 to 0.2 s (phase
II);
- S
2
: intermediate slope measured from 0.8 to 1.2 s
(beginning of phase III);
- S
3
: final slope measured at the end of expiration
during half second preceding the end of expiratory
peak (end of phase III).
Three indices were measured indirectly:
- The α angle between the intermediate and the
initial slopes (S
2
/S
1
) × 100;
- The area ratio (AR) under the curve at angle α
(A
1
) to the area of the rectangle in which it is
inscribed;
BIODEVICES2013-InternationalConferenceonBiomedicalElectronicsandDevices
254
- The β angle was defined by the prolongation of
the line between the terminal slope (phase III) and
the descending slope (phase 0).
Figure 3: Schematic description of the capnographic
indices measured on a normal capnogram. See text for
details.
For comparison and quantitative analysis of CO
2
waveforms in two moments of each patient, it was
necessary to select good quality cycles according to
criteria of amplitude, duration and, when possible,
regularity of the curve. In this study, we
systematically eliminated the cycles that did not
meet the following criteria: 1) validity lasting
between 1 and 4 seconds; 2) symmetry for at least 5
cycles; and 3) good regularity of expiratory phases.
The data recorded were analyzed statistically; the
association between PetCO
2
and arterial carbon
dioxide pressure (PaCO
2
) values was analyzed using
the Pearson product-moment correlation coefficient
(r). Analysis of variance (ANOVA) was performed
to compare waveform parameters between infants
under prolonged IMV and 48 hours after tracheal
extubation. Significance was defined for two-tailed
values of p<0.05. Statistical analysis was performed
using MedCalc Statistical Software version 10.4.5.
3 RESULTS
The waveform analysis was assessed at the 10
th
day
of IMV in postoperative cardiac patients. For the 52
measurements, PaCO
2
was 39.4 ± 3.2 mmHg and
PetCO
2
was 37.6 ± 3.2 mmHg. The correlation
between PaCO
2
and PetCO
2
measurements was r
2
=
0.8618 (p<0.001) throughout the study period. The
mean P(a–et)CO
2
was 1.82 ± 1.2 mmHg with values
that ranged from –0.7 to 4 mmHg.
The mean period that the patients remained in
IMV was 16 days, the minimum and maximum time
of IMV were 12 and 19 days, respectively.
For the measurements in spontaneously
breathing patients the mean values for PaCO
2
and
PetCO
2
were 40 ± 3 mmHg and 39.5 ± 3 mmHg,
respectively. The PaCO
2
and PetCO
2
measurements
maintained a significant correlation (r
2
= 0.9787,
p<0.001) throughout the study period.
Six quantitative waveform parameters were
determined for each patient. In addition PaCO
2
and
PetCO
2
values also have been measured for
statistical analysis (Table 2). Significant differences
were noted between the mean of prolonged IMV and
spontaneously breathing patients for four waveform
parameters: intermediate slope, α and β angles, and
area ratio.
Table 2: Waveform parameter data.
Waveform parameter Instant A Instant B p-Value
S
1
15 13.4 0.08
S
2
0.25 0.57 < 0.001*
S
3
0.17 0.20 0.10
α angle 100.5º 117º 0.04*
β angle 90.7º 106.4 º 0.02*
AR 80.3 67 < 0.001*
PetCO
2
39.5 37.6 < 0.001*
PaCO
2
40 39.4 0.17
P(a-et)CO
2
0.5 1.8 < 0.001*
The CO
2
measurements are expressed in mmHg.
* Statistically significant.
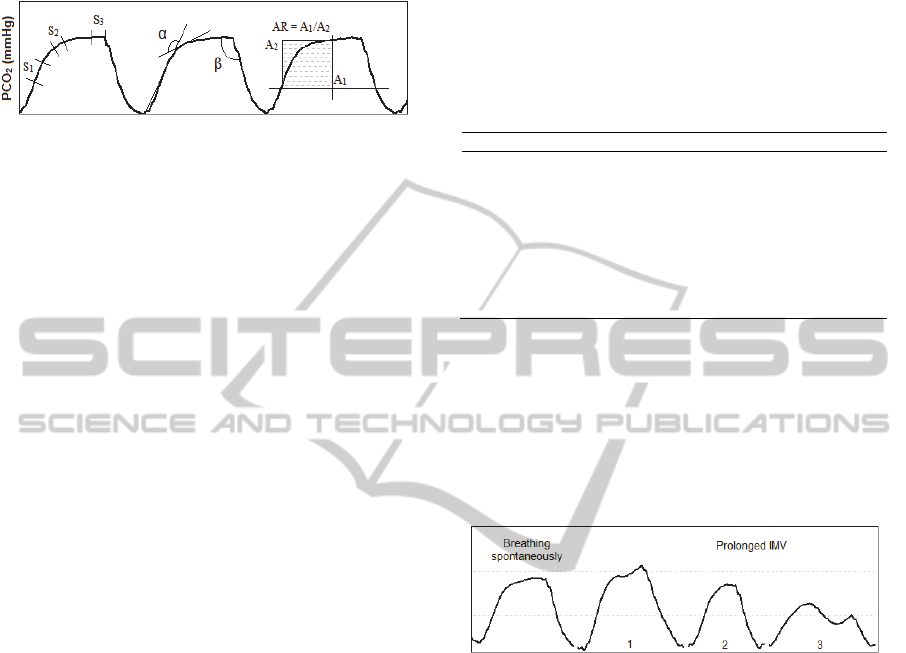
Patients under prolonged IMV had a steeper
ascending slope and a higher alpha angle, a fast
descent in phase III and larger descending angle
presented on 1 and 2 curves of Figure 4. The curve 3
found only in 6 patients at the 10
th
day of IMV
indicates asynchrony between patient and ventilator.
Figure 4: A sample recorded waveform from infant in two
different conditions; breathing spontaneously and
prolonged mechanical ventilation (10 days mean).
4 DISCUSSION
Capnography has become the standard of care for
basic respiratory monitoring for all intubated
patients in the ICU; the extension of this technique
to intubated infants has been limited by technical
problems associated with the capnographic indices.
Waveform analysis of infant patients has been
used to demonstrate several parameters that correlate
with the respiratory condition of intubated patients
for a long period. Alpha angle, alveolar plateau
slope and area ratios can be used clinically for
estimating the alveolar ventilation and the
pulmonary involvement in infants (Hagerty et al.,
2002); (Roy et al., 2007).
As expected there was a significant difference in
the PetCO
2
measurements and P(a–et)CO
2
gradient
QuantitativeAnalysisoftheEffectofProlongedMechanicalVentilationonCapnographicIndices
255

in patients under prolonged IMV when compared
with spontaneously breathing patients. The P(a–
et)CO
2
gradient is essentially an indicator of
alteration in ventilation/perfusion due to
cardiopulmonary causes and is directly proportional
to degree of dead space (Domingo et al., 2010).
You et al. (1994) found larger differences among
the indices in asthmatic patients than healthy
subjects, but the strongest differences were observed
analyzing indices in the intermediate phase of the
capnogram. These results are similar to the ones
found in our research for infant patients without
respiratory alteration but under prolonged IMV.
In 2002, Hagerty et al. carried out a study with
20 newborn patients who were receiving mechanical
ventilation for pulmonary diseases and for
postoperative condition and they found four
waveform parameters (ascending slope, alveolar
angle, alpha angle and descending angle), which
independently differentiated patients with
pulmonary disease from control group.
The analysis of CO
2
pressure through
capnography during prolonged IMV of neonates is
less documented in the pediatric literature
(Thompson and Jaffe, 2005). The additional dead
space, mechanical problems, low weight, small flow
and respiratory pressure may limit the clinical value
of capnography with infants.
In order to reduce these limitations we have used
the sidestream capnograph that requires a small
sample cell and, therefore, a low flow rate (50
ml/min). For the neonate with high respiratory rates
and low tidal volumes, this rate of gas avoids the
dilution of alveolar CO
2
. Thus, the device provides
precise measurements in newborns patients.
In this study, patients under prolonged IMV had
a steeper ascending slope and a higher alpha angle, a
rapid descent in phase III and little alveolar plateau
if any. These may be explained by the fact that
although the patients do not have respiratory disease,
the fact that they were submitted to IMV for a
prolonged period associated with high mechanical
ventilator parameters produces a commitment of
lung function, as well as a smaller dead space and
higher respiratory rate.
5 CONCLUSIONS
We have analyzed capnograms from our subjects,
and it was determined that the infant under
prolonged IMV can significantly alter the
characteristic waveform.
Patients under prolonged IMV had a steeper
ascending slope and a higher alpha angle, a rapid
descent in phase III and larger descending angle
(beta) than the normal waveform parameters found
in patients 48 hours after tracheal extubation.
The present results could be a guideline for
clinicians in the physiological interpretation of the
capnogram and it could help clinicians to get
accurate respiratory information about the infant
patient.
The knowledge of alteration in the CO
2
waveform can help the health professionals to
change the mechanical ventilatory parameters in
order to obtain a capnographic wave closest to
normal thereby improving the lung function of
patients.
REFERENCES
Belpomme, V., et al., 2005. Correlation of arterial PCO
2
and PetCO
2
in prehospital controlled ventilation.
American Journal of Emergency Medicine, vol. 23, pp.
852-859.
Benallal, H., Busso, T., 2000. Analysis of end-tidal and
arterial PCO
2
gradients using a brething model. Eur J
Appl Physiol, vol. 83, pp. 402-408.
Cheifetz, I. M., Myers, T. R., 2007. Should every
mechanically ventilated patient be monitored with
capnography from intubation to extubation? Respir
Care, vol. 52, pp. 423-442.
Domingo, C., Blanch, L., Murias, G., Luján, M., 2010.
State of the art sensor technology in Spain: Invasive
and non-invasive techniques for monitoring
respiratory variables. Sensors, vol. 10, pp. 4655-4674.
Gravenstein, J. S., Jaffe, M. B., Gravenstein, N., Paulus,
D. A., 2011. Capnography. Cambridge, 2
nd
edition.
Hagerty, J. J., Kleinman, M. E., Zurakowski, D., et al.,
2002. Accuracy of a new low-flow sidestream
capnography technology in newborns. Journal of
Perinatology, vol. 22, pp. 219-225.
Langhan, M., 2009. Continuous end-tidal carbon dioxide
monitoring in pediatric intensive care unit. J Crit
Care, vol. 24, pp. 227-230.
Op Den Buijs, J., Warner, L., Chbat, N. W., Roy, T. K.,
2006. Bayesian tracking of a nonlinear model of the
capnogram. Conf Proc IEEE Eng Med Biol Soc, vol. 1,
pp. 2871-2874.
Roy, T. K., Den Buij, J., 2007. Calculating the effect of
altered respiratory parameters on capnographic
indices. IFMBE Proceedings, vol. 14, pp. 123-126.
Thompson, J. E., Jaffe, M. B., 2005. Capnographic
waveforms in the mechanically ventilated patient.
Respir Care, vol. 50, pp. 100-108.
You, B., Peslin, R., Duvivier, C., et al., 1994. Expiratory
capnography in asthma. Eur Respir J, vol. 7, pp. 318-
323.
BIODEVICES2013-InternationalConferenceonBiomedicalElectronicsandDevices
256
