
Segmentation of Tracheal Rings in Videobronchoscopy Combining
Geometry and Appearance
Carles S´anchez
1
, Debora Gil
1
, Antoni Rosell
2
, Albert Andaluz
1
and F. Javier S´anchez
1
1
Comp. Vision Center, Comp. Science Dep. UAB, Barcelona, Spain
2
Pneumology Unit, Hosp. Univ. Bellvitge, IDIBELL, CIBERES, Barcelona, Spain
Keywords:
Video-bronchoscopy, Tracheal Ring Segmentation, Trachea Geometric and Appearance Model.
Abstract:
Videobronchoscopy is a medical imaging technique that allows interactive navigation inside the respiratory
pathways and minimal invasive interventions. Tracheal procedures are ordinary interventions that require
measurement of the percentage of obstructed pathway for injury (stenosis) assessment. Visual assessment of
stenosis in videobronchoscopic sequences requires high expertise of trachea anatomy and is prone to human
error. Accurate detection of tracheal rings is the basis for automated estimation of the size of stenosed trachea.
Processing of videobronchoscopic images acquired at the operating room is a challenging task due to the wide
range of artifacts and acquisition conditions. We present a model of the geometric-appearance of tracheal
rings for its detection in videobronchoscopic videos. Experiments on sequences acquired at the operating
room, show a performance close to inter-observer variability.
1 INTRODUCTION
Since the introduction of High Definition Camera
Compression (HDCC) in the early 90’s (Moreton
and Smith, 1994), the use of videobronchoscopy has
spread in diagnosis and treatment planning of airway
reduction (Bolliger and Mathur, 2000). Diagnosis
mainly focuses in assessing the percentage of the ob-
structed airway. Severe obstructions (Manno, 2010)
might require placing a stent or, even, a prothesis at
the diseased segment.
Determining the size of the prothesis requires a
precise measurement of the affected area. Therefore,
a robust method for quantifying the percentage and
size of the obstructed airway in the operating room
during the bronchoscopy procedure would allow im-
mediate and accurate diagnostic and treatment (Rozy-
cki et al., 1996).
Tracheobronchial rings are the main anatomical
structures used to perform measurements of the size
of airway segments. Although rings are clearly iden-
tified in bronchoscopic images, there is a need of an
automatic system providing objective accurate mea-
surements on their size. Current methods for mea-
suring the size of tracheal rings are based on either
visual inspection of images or contact invasive pro-
cedures (Jowett et al., 2008). In the first case, de-
termining the true measurements strongly depends on
the experience and the anatomical knowledge of the
pulmonologist. In the second case, the diameter of
tracheal rings is determined by inserting endotracheal
tubes with increasing stepwise size (Myer 3rd et al.,
1994; Hein and Rutter, 2006). The endotracheal tube
is inflated to fit the tracheobronchial airway to deter-
mine the size of the prothesis. A main concern is that
introducing endotracheal tubes can cause lesions to
the soft tissues of the tracheobronchial airway.
In any case, semi quantitative methods choose a
wrong prothesis in a 30% of the procedures, which
implies repeat the whole procedure (Norwood et al.,
2000; Vergnon et al., 1995).
Existing non-contact airway measurement tech-
niques can be divided into videobronchoscopic com-
puter analysis and bronchoscopic device improve-
ment. In (Jowett et al., 2008), modifying intralu-
minal optics provides measurements with microme-
ter precision. However, these technologies are not
available commercially. Concerning image process-
ing, early works just focused on correcting optical
distortion in order to extract 3D measurements. Only
in recent research, segmentation of tracheal structures
has been addressed. Existing works restrict to semi-
automatic segmentation of the luminal area (Masters
et al., 2005; McFawn et al., 2001; D¨orffel et al., 1999;
Forkert et al., 1996). On one hand, the lumen by it-
self does not suffice to compute the percentage of ob-
153
Sánchez C., Gil D., Rosell A., Andaluz A. and Sánchez F..
Segmentation of Tracheal Rings in Videobronchoscopy Combining Geometry and Appearance.
DOI: 10.5220/0004207401530161
In Proceedings of the International Conference on Computer Vision Theory and Applications (VISAPP-2013), pages 153-161
ISBN: 978-989-8565-47-1
Copyright
c
2013 SCITEPRESS (Science and Technology Publications, Lda.)

structed pathway, since such percentage is a relative
score that requires a reference complete ring for an ac-
curate estimation. On the other hand, semi-automatic
techniques are infeasible in the operating room.
Developing accurate computer procedures for ex-
tracting the ring area from videobronchoscopic im-
ages would constitute a significant breakthrough in
the field. This is challenging task due to the large
variety of acquisition conditions and devices, which
include, among others, flexible and rigid optics, dif-
ferent video camera resolutions and digital compres-
sions. Besides, processing videos acquired at the op-
erating room adds the unpredicted presence of surgi-
cal devices (such as probe ends), as well as, illumina-
tion and camera position artifacts. These multiple im-
age artifacts together with a large diversity of anatom-
ical structures not belonging to the set of tracheal
rings are prone to drop the performance of methods
exclusively relying on image intensity (S´anchez et al.,
2011).
This paper introduces a model of tracheal rings
that combines their appearance and geometric fea-
tures in videobronchoscopic images in order to mini-
mize the impact of non-tracheal structures. In video-
bronchoscopic sequences, the trachea is described as
a tube in conical projection. The appearance of rings
in the image follows a ridge-valleypattern that is geo-
metrically characterized by its concentric disposition
and an increasing radial thickness. The ridge-valley
profile is modelled by a bank of Normalized Steer-
able Gaussian Filters (NSGF) in order to minimize
the impact of illumination and camera position vari-
ations. In order to account for the concentric dispo-
sition, images are transformed to the polar domain.
Finally, the increasing thickness is taken into account
by analysing along each radius the scale of the maxi-
mum response to NSGF.
We present experiments on videos acquired at
the operating room with different devices, both, with
rigid and flexible cases. Final results show that the
error rate is very close to inter-observer variability.
This validates our methodology as a further tool for
helping pulmonologist in assessing the percentage of
stenosed trachea.
Paper contents are: Section 2 explains our mod-
elling of tracheal rings in terms of their appearance in
images (Section 2.1) and geometric structure (Section
2.2). Section 3 describes the video data set and vali-
dation protocol used (3.1), as well as, numeric results
(3.2). Finally, Section 4 concludes the paper.
2 TRACHEA
GEOMETRIC-APPEARANCE
MODEL
The trachea is a tubular structure located in front
of the esophagus that connects the pharynx to the
beginning of the bronchial tree (known as the ca-
rina). There are about fifteen to twenty incomplete
C-shaped cartilaginous rings that reinforce the ante-
rior and lateral sides of the trachea. In videobroncho-
scopic images, the trachea appears as a tube in coni-
cal projection. If the camera is centered at the carina,
the conical projection of the trachea is given by a set
of concentric circles corresponding to tracheal rings.
Considerable deviation from the center causes rings
to collapse at a certain pathway point. In this case,
measurements are not reliable and, thus, these images
are usually discarded by experts. For this reason, we
will only consider images having the camera centered
at the carina for our further analysis on ring detection.
The left image in figure 1 shows the main anatomi-
cal structures that can be identified in a videobroncho-
scopic frame acquired in central projection. The dark
central spot shows the two main bronchi separated by
the carina where the tracheal rings are the concentric
bright-dark structures around it. The brighter parts
show to the C-shaped cartilage and the dark ones to
separating soft tissue. The illumination intensity is
not uniform due to variations in the incidence angle
between camera light and ring surface. We also ob-
serve an increasing radial thickness of cartilage and
separating tissue due to the perspective projection of
the video camera. The plots in figure 1 show the im-
age profile for the radial lines with origin at the carina
labelled L1 and L2 and shown in solid white in the
right image of figure 1. The main anatomical struc-
tures observed across the radial profile are indicated
in both images. It is worth noticing that the profile
along L1 illustrates the fact that bronchial rings at the
carina have a radial local ridge-valley profile similar
as the tracheal ring ones.
2.1 Ring Appearance Modelling
As already pointed out in section 2, tracheal rings
have a ridge-valley intensity profile in videobroncho-
scopic images transformed into gray level. Among
current ridge-valley detectors, we have chosen convo-
lution with a second derivative of an anisotropic ori-
ented gaussian kernel (Freeman and Adelson, 1991).
Oriented anisotropic gaussian kernels are given by:
G
Σ,θ
= G
(σ
x
,σ
y
),θ
=
1
(2π)σ
x
σ
y
e
−
˜x
2
2σ
2
x
+
˜y
2
2σ
2
y
(1)
VISAPP2013-InternationalConferenceonComputerVisionTheoryandApplications
154
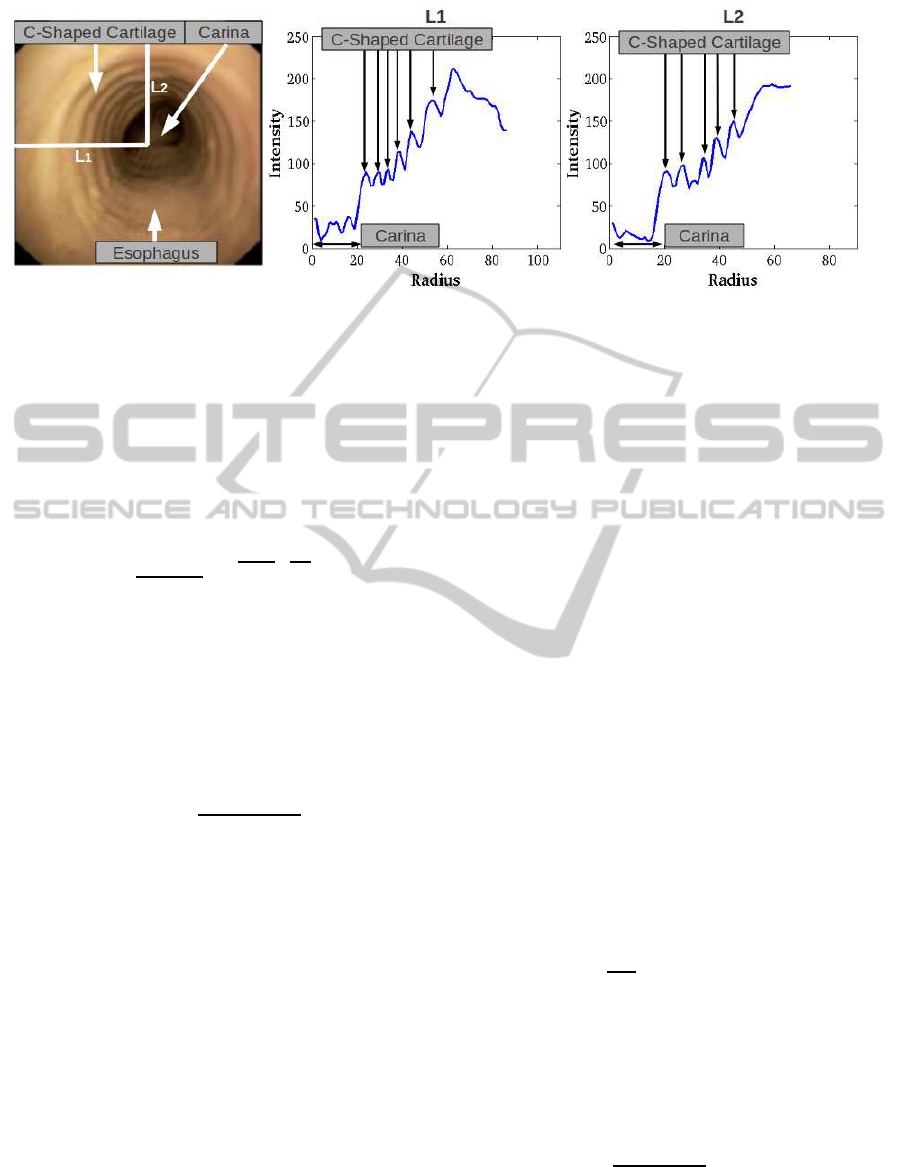
Figure 1: Tracheal Ring Geometric Appearance in Original Images: main anatomic structures in left image and radial ridge-
valley profile in right plots.
for ( ˜x, ˜y) the coordinates given by a rotation of angle
θ:
˜x = −xsinθ+ ycosθ
˜y = xsinθ − ycosθ
(2)
and the scale σ
x
> σ
y
usually given by σ
x
= 4σ
y
(Ga-
bor, 1946). Thus, the anisotropic bank of filters is
simply formulated as:
G
σ,θ
=
1
(2π)4σ
2
e
−
˜x
2
2(4σ)
2
+
˜y
2
2σ
2
(3)
The second partial derivative along the y axis con-
stitutes the principal kernel for computing ridges and
valleys:
∂
2
˜y
G
σ,θ
= (˜y
2
/σ
4
− 1/σ
4
)G
σ,θ
(4)
In order to account for non-uniform illumination arti-
facts, we use a normalized convolution operator:
NSGF
σ,θ
:=
k∂
2
˜y
G
σ,θ
∗ Ik
k∂
2
˜y
G
σ,θ
kkIk
(5)
for k · k the L
2
integral norm and ∗ denoting the con-
volution operator. The response of the operator is cal-
culated as the maximum response for a discrete sam-
pling of the angle and scale domains:
NSGF := max
i, j
NSGF
σ
i
,θ
j
(6)
Angular and scale samplings are defined according to
the geometric structure of tracheal rings as follows.
2.2 Ring Geometry Modelling
There are two main geometrical aspects of tra-
cheal rings that allow their discrimination from other
anatomical structures: an increasing thickness across
the radial direction and a concentric disposition
around the carina. These two features bound the an-
gular and scale ranges of the NSGF bank. Concentric
disposition implies that, for each pixel, the orientation
of filters should be perpendicular to radial rays emerg-
ing from the carina. Meanwhile, increasing radial
thickness implies that the scale of the filter achieving
the maximum response in (6) increases along each ra-
dial ray (see L1 profile in figure 1). The left scheme in
figure 2 illustrates the specific filter design modelling
the geometric features of tracheal rings in the original
image cartesian domain.
In order to better model concentric and radial geo-
metric features, images are transformed to polar coor-
dinates with origin centered at the carina. In the polar
domain the ridge-valley profile of tracheal rings fol-
lows approximately an horizontal line and the carina
becomes to a wide strip at the top of images as shown
in the right image of figure 2. Rows correspond to
radial coordinates and columns to the angular one.
It follows that, in the polar domain, the pixel-wise
radial orientation of the NSGF filters reduces to an
horizontal orientation given by θ = 0. In order to ac-
count for any deviation in the circular profile of rings
(see images extracted from sequence 2 and 4 shown
in figure 4 for an example) the sampling of the an-
gle defining NSGF(σ
i
,θ
j
) considers a small range
around 0 given by [−ε,ε]:
θ
j
= {
2εj
N
θ
− ε,∀ j = 0... N
θ
} (7)
for N
θ
the number of sampled angles.
Concerning scale sampling, we have that σ is re-
lated to the thickness of the valley. For a given se-
quence, let is range be given as [σ
m
,σ
M
], then the
scale sampling will be given by a uniform sampling
of the former interval:
σ
i
= {σ
m
+
i(σ
M
− σ
m
)
N
σ
,∀i = 1.. .N
σ
} (8)
for N
σ
the number of sampled scales.
Due to the perspective projection, the thickness
range is always within the same range for a given
SegmentationofTrachealRingsinVideobronchoscopyCombiningGeometryandAppearance
155
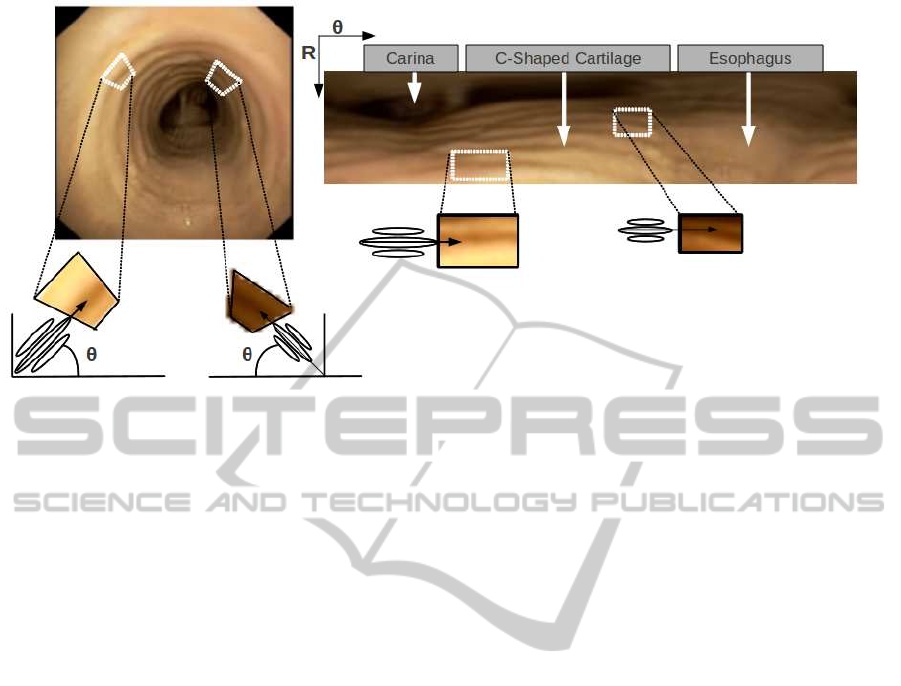
Figure 2: Modelling of concentric disposition of tracheal rings in the polar domain: steerable filters in the original cartesian
domain (right) and in the polar transform (left) .
video camera and digital resolution. By finding the
optimal scale range in one reference frame we can ap-
ply it to the rest of the sequence. What is more, we
can reuse this range by multiplying it by the resolu-
tion scaling factor between sequences (S´anchez et al.,
2012). The values for the reference sequence are set
using a Phong illumination model (Phong, 1975) onto
a synthetic trachea model simulated using sizes re-
ported for human adults (Prakash, 1994).
The maximum response (6) includes most tracheal
rings as well as the carina components and some sur-
gical devices (as illustrated in the left images of fig-
ure 3). Structures not belonging to tracheal rings are
removed by forcing rings increasing thickness across
the radial direction. In order to do so, we will explore
the radial profile of the scales achieving the maximum
value in (6). The bottom left image in figure 3 shows
the maximal scales at points achieving a local maxi-
mum of NSGF. Higher intensity values correspond to
larger scales as indicated by the colorbar. The right
plot shows the radial profile along the white line la-
belled L1 and shown also in the close-up in the left
part of the figure. The cross in the line L1 and its ra-
dial profile indicates the beginning of the carina. We
observe that, in the absence of non-ring artifacts (L1
profile), such profile keeps decreasing starting from
the most external detections as rings are traversed.
This is illustrated by the scales of higher radius in
the L1 profile corresponding to outermost rings in the
left image close-up. However, surgical devices and
the carina cause the profile of the maximal scales to
increase, thus, violating the radial increasing thick-
ness of rings (as illustrated by at the minimal radius
in L1 profile). Therefore, structures not belonging to
tracheal rings are removed by discarding the first en-
counter with increasing scale (as indicated by the ver-
tical dotted line in L1 profile). This greedy approach
chooses a set of candidate points on tracheal rings,
which are completed by hysteresis on the maximum
response (6).
3 EXPERIMENTS
3.1 Experimental Set-up
Our data set consists of four sequences of healthy and
pathological trachea cases provided by the Bellvitge
hospital. Sequences include rigid and flexible bron-
choscopies acquired at different resolutions. Scale
parameters have been tuned empirically for the se-
quence of lowest resolution and estimated for the re-
maining sequences by using the scaling ratio between
both resolutions. Scale ranges and video main fea-
tures for all videos are given in Table 1.
In order to assess our geometric appearance
model, we have compared automatically detected
rings with manual segmentations. Comparison has
been made over a set of 60 representative frames uni-
formly sampled on each video. Figure 4 shows some
of the frames chosen for each of the sequences.
Difference between manual and automatically de-
tected rings has been quantified in terms of true pos-
itives, TP, and false positives, FP. We have chosen
this goodness measures instead of standard distances
to curves because they are more sensitive and discrim-
inative for the amount of lost rings (given by TP) and
alien structures included in detections (given by FP).
VISAPP2013-InternationalConferenceonComputerVisionTheoryandApplications
156
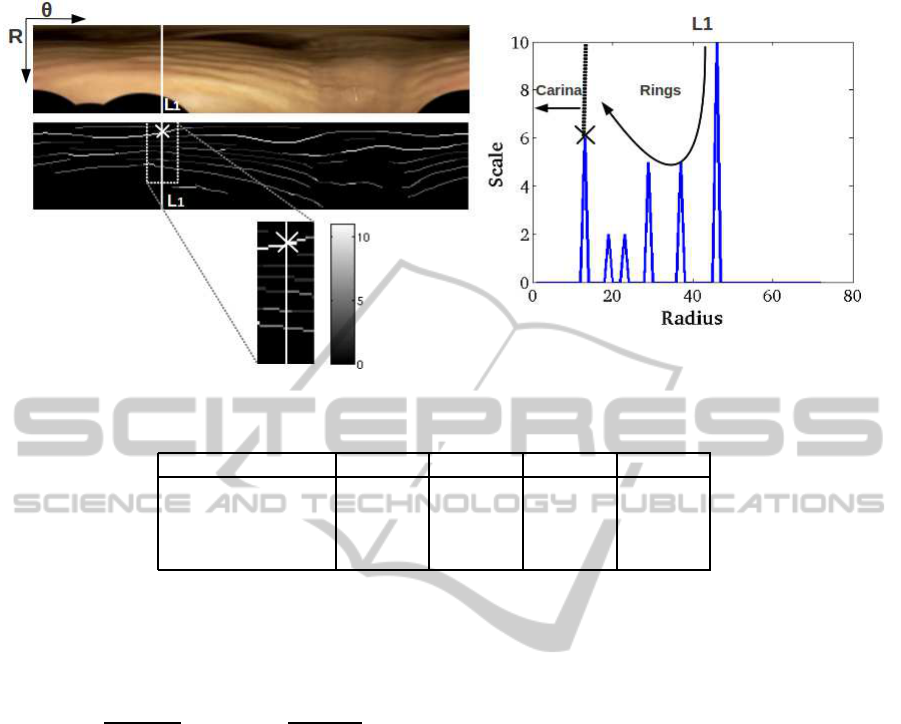
Figure 3: Modelling of tracheal rings radial thickness by analyzing the profile of maximal scales.
Table 1: Main features of our dataset: Scale ranges and bronchoscope type, pathologies and resolutions.
Seq
1
Seq
2
Seq
3
Seq
4
Bronchoscope type Flexible Rigid Rigid Flexible
Pathology No Yes Yes No
Resolution 192x144 512x288 360x288 512x288
σ [0.9,2.9] [2.2,6.8] [1.8,5.6] [2.2,6.8]
In order to account for accuracy in ring location, TP
are defined as those points 1 pixel distance away from
manual curves. The percentage of TP and FP are re-
ported in terms of sensitivity and precision scores:
Sens = 100
TP
TP+ FN
, Prec = 100
TP
TP+ FP
(9)
where FN is the number of false negatives.
Two experts have segmented our data set in order
to account for inter-observer variability. Comparison
to inter-observer variability was computed as follows.
Each expert was used as ground truth for computing
Sens and Prec scores achieved by automatic detec-
tions. Inter-observer variability was computed by tak-
ing one of the experts as ground truth and the other
one as detection output for computation of Sens and
Prec. The differences of Sens and Prec between ob-
servers and the automatic detections were analyzed
using a Wilcoxon signed-rank test.
3.2 Results
Table 2 and 3 report the statistical analysis compar-
ing automatic detections (labelled AUT) and inter-
observer variability (labelled IO) for the four video
sequences (rows). Table 2 reports Sens and Prec
ranges (given by mean ± standard deviation, com-
puted for the two experts) and table 3 the Wilcoxon
signed-rank test p − val and confidence intervals for
the difference in means between AUT and IO.
First, we observe that there is not a high agree-
ment between experts, especially for Seq
2
and Seq
3
.
Expert disagreement is mainly due to unmarked rings
at most inner (Seq
3
and Seq
4
in figure 5) and outer
parts (Seq
1
and Seq2 in figure 5) of the trachea (as il-
lustrated in figure 5). Such variability in most outer
and inner rings significantly increases for pathologi-
cal cases (Seq
2
and Seq
3
).
Second, it is worth noticing that our detection
includes the union of rings segmented by the two
manual trials. This increases sensitivity scores for
sequences with a lower agreement between experts,
such as the pathological Seq
2
and Seq
3
. It follows
that sensitivity compares to inter-observer variability
for Seq
1
, Seq
3
(although with positive bias in differ-
ences) and Seq
4
(p − val > 0.3 in table 3), but for
Seq
2
our method has sensitivity ranges above inter-
observer agreement.
Third, concerning precision ranges, our method-
ology might drop its performance up to a 20% com-
pared to inter-observer ranges. This is mainly due
to an over-detection of rings rather than inclusion of
non-anatomic artifacts. Figure 6 shows the results ob-
tained as well as ground truth for four representative
frames from four different sequences. For a better vi-
sualization, our detections are shown in black lines
and ground truth in thicker white lines. We observe
SegmentationofTrachealRingsinVideobronchoscopyCombiningGeometryandAppearance
157
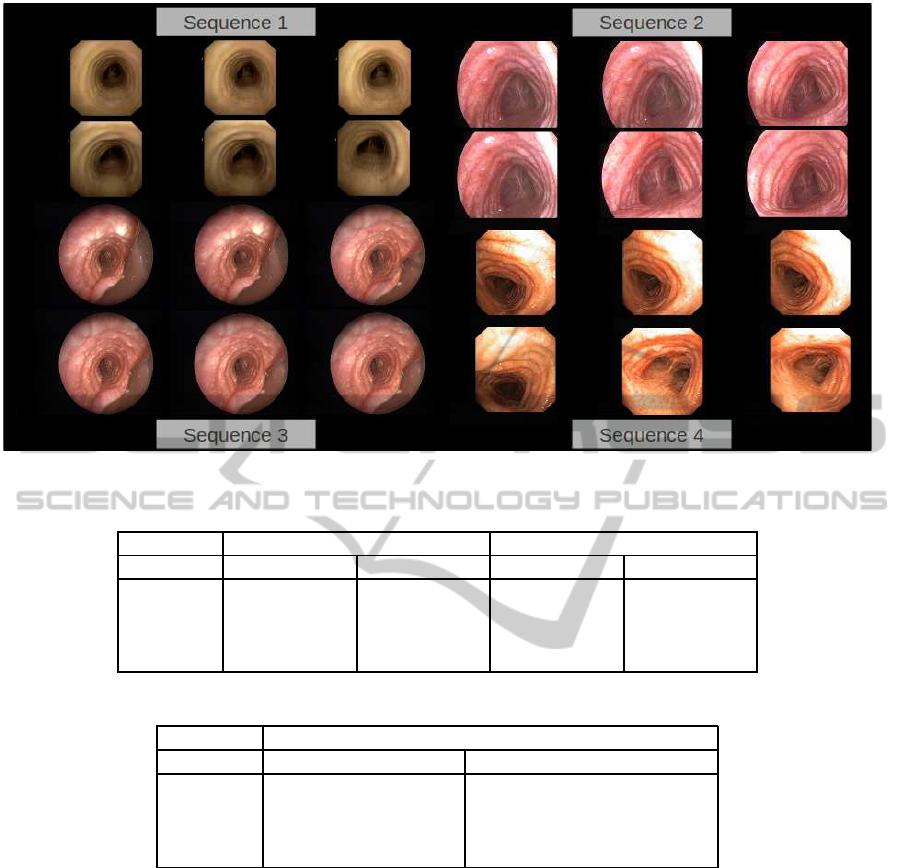
Figure 4: Trachea dataset.
Table 2: Comparison to Inter-observer Ranges.
AUT IO
Validation Sens Prec Sens Prec
Seq
1
[71.16, 96.20] [57.67,80.08] [71.21, 99.61] [71.70,98.87]
Seq
2
[66.11, 94.01] [52.22,67.72] [56.13, 72.84] [56.32,72.59]
Seq
3
[60.29, 83.53] [51.25,60.97] [59.56, 78.41] [59.70,78.23]
Seq
4
[57.87, 92.72] [51.16,75.90] [62.66, 86.35] [62.84,86.08]
Table 3: Wilcoxon signed-rank test and confidence intervals for difference in means between AUT and IO and p− val.
Wilcoxon(CI, p − val)
Validation Sens Prec
Seq
1
[−11.75,4.74],0.4856 [−23.58,−12.08], 0.0004
Seq
2
[7.94, 24.14],0.0006 [−11.06,−1.48],0.0183
Seq
3
[−0.70, 6.55],0.3481 [−17.09,−8.61],9.27∗ 10
−6
Seq
4
[−6.70, 8.27],0.9031 [−18.18,−3.68],0.0056
that, as expected, all rings are detected and include
the union of the rings marked by experts (as compar-
ison to images in figure 5 shows). This is the main
source of precision dropping in Seq1. Still, for some
cases there are some extra structures decreasing our
global precision. In particular, part of the end probe,
as well as, calcified spots are included at some frames
of Seq
3
. Also our method might include the ring con-
tinuation on the esophagus (bottom part of Seq
2
im-
ages in figure 6) which is generally discarded by clin-
ical experts.
Finally, it is worth noticing the absence of re-
sponse at the carina, which is a main source of error
in intensity-based approaches (S´anchez et al., 2011).
Figure 7 shows two frames segmented using only in-
tensity (second row) and our geometrical appearance
model (first row). Detections exclusively based on
image intensity include many responses at vessels and
the carina. These responses do not follow the ring
geometric characteristics and, thus, are suppressed in
our model.
4 CONCLUSIONS
Tracheal ring detection for stenosis assessment in
videobronchoscopic images is a novel research area.
This is a challenging task because there are many
structures, not necessarily anatomical, that have simi-
lar appearance in images to tracheal rings. This paper
VISAPP2013-InternationalConferenceonComputerVisionTheoryandApplications
158
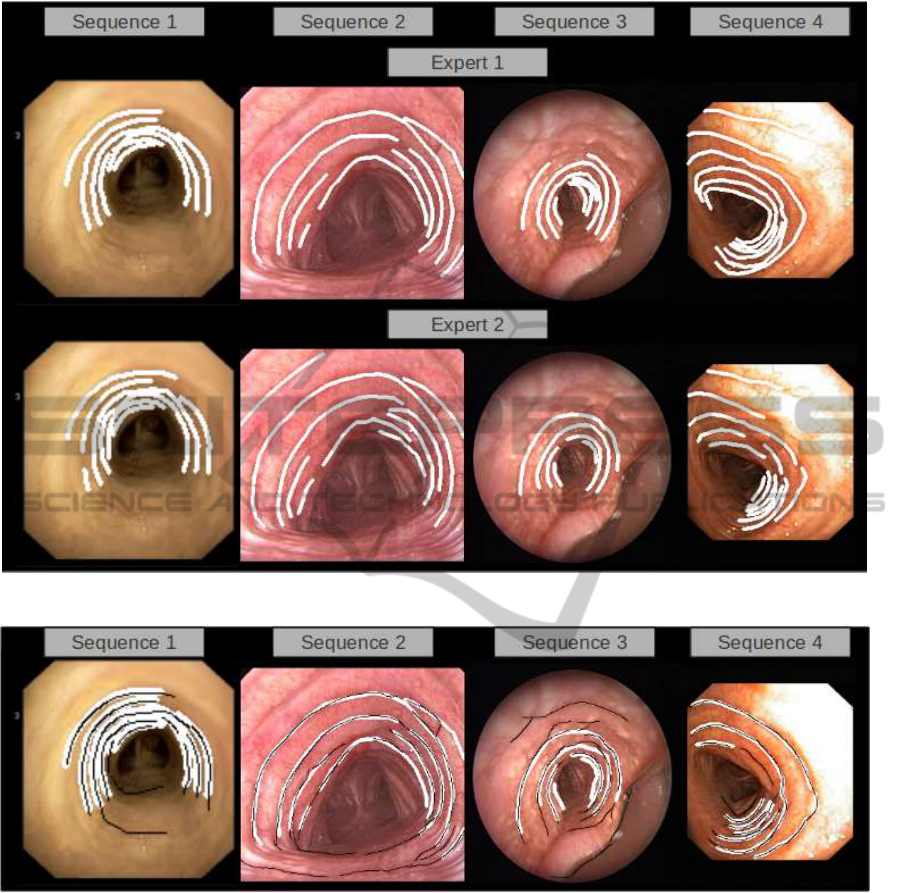
Figure 5: Inter-observer variability in manual segmentations.
Figure 6: Visual Assessment of Automatic Ring Detection.
introduces a geometric appearance model for tracheal
ring detection in videobronchoscopic images.
A strong point is that our geometrical structure
avoids any response at the carina and minimizes the
impact of surgical devices. This new contribution of
the geometrical appearance of the tracheal rings is an
important breakthrough with respect intensity-based
methods applied into transformed grey level broncho-
scopic images.
Our experiments show that our detection can re-
trieve most clinically relevant tracheal rings. This
is a promising result that indicates the value of the
proposed methodology as a tool for helping broncho-
scopists in the operating room. We are aware of the
limited dataset used in our experiments and enlarging
it including more types of pathologies is an ongoing
work.
ACKNOWLEDGEMENTS
This work was supported by the Spanish projects
TIN2012-33116, TIN2009-13618, TIN2009-10435
and CSD2007-00018. Debora Gil has been supported
by the Ramon y Cajal Program. Carles Snchez has
been supported by a UAB grant 471-01-2/2010.
SegmentationofTrachealRingsinVideobronchoscopyCombiningGeometryandAppearance
159
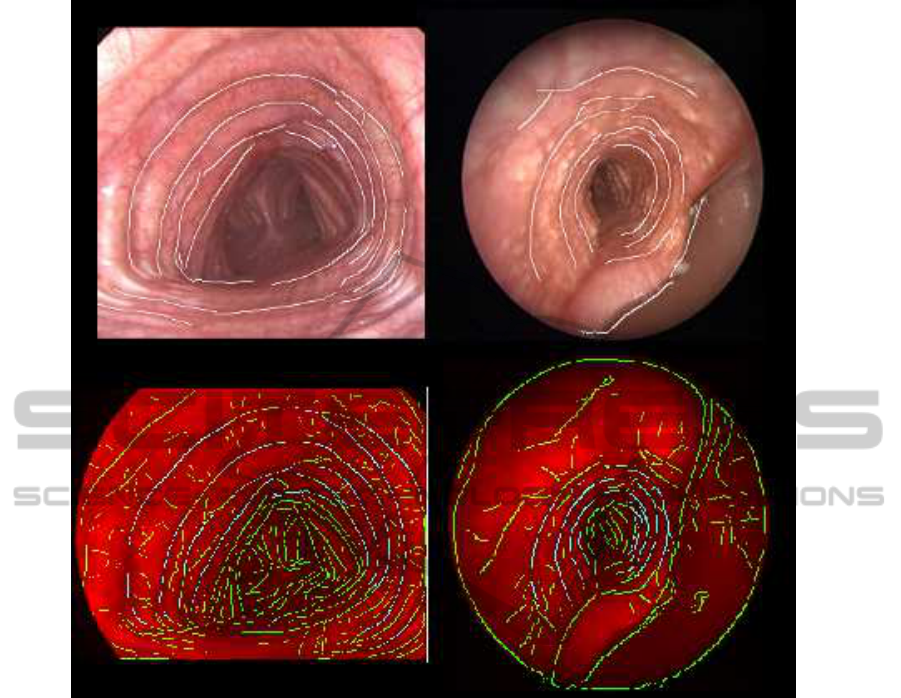
Figure 7: Advantages of combining appearance and geometry (1st row) of the tracheal rings compared to intensity-based
approaches (2nd row, images courtesy of (S´anchez et al., 2011)).
REFERENCES
Bolliger, C. and Mathur, P. (2000). Interve. bronchos., vol-
ume 30.
D¨orffel, W., Fietze, I., Hentschel, D., Liebetruth, J.,
R¨uckert, Y., Rogalla, P., Wernecke, K., Baumann, G.,
Witt, C., et al. (1999). A new bronchoscopic method
to measure airway size. European Respiratory Jour-
nal, 14(4):783–788.
Forkert, L., Watanabe, H., Sutherland, K., Vincent, S., and
Fisher, J. (1996). Quantitative videobronchoscopy:
a new technique to assess airway caliber. Ameri-
can journal of respiratory and critical care medicine,
154(6):1794.
Freeman, W. and Adelson (1991). The design and use of
steerable filters. PAMI, 13 (9):891–906.
Gabor, D. (1946). Theory of communication. J. Inst Elect.
Eng., 93:429–457.
Hein, E. and Rutter, M. (2006). New perspectives in pedi-
atric airway reconstruction. International anesthesiol-
ogy clinics, 44(1):51.
Jowett, N., Weersink, R., Zhang, K., Campisi, P., and
Forte, V. (2008). Airway luminal diameter and shape
measurement by means of an intraluminal fiberop-
tic probe: a bench model. Archives Otolaryngology-
Head and Neck Surgery, 134(6):637.
Manno, M. (2010). Pediatric respiratory emergencies: up-
per airway obstruction and infections.
Masters, I., Eastburn, M., and et al., W. (2005). A
new method for objective identification and measure-
ment of airway lumen in paediatric flexible videobron-
choscopy. Thorax, 60(8):652.
McFawn, P., Forkert, L., and Fisher, J. (2001). A new
method to perform quantitative measurement of bron-
choscopic images. ERJ, 18(5):817–826.
Moreton, H. P. and Smith, J. (1994). Hdcc: a software-
based compression algorithm for video conferencing.
In (SPIE), volume 2187, pages 190–195.
Myer 3rd, C., O’connor, D., Cotton, R., et al. (1994). Pro-
posed grading system for subglottic stenosis based on
endotracheal tube sizes. The Annals of otology, rhi-
nology, and laryngology, 103(4 Pt 1):319.
VISAPP2013-InternationalConferenceonComputerVisionTheoryandApplications
160

Norwood, S., Vallina, V., and Short, K. e. a. (2000). Inci-
dence of tracheal stenosis and other late complications
after percutaneous tracheostomy. Annals of surgery,
232(2):233.
Phong, B. T. (1975). Illumination for computer generated
pictures. Communications of ACM 18, (6):311–317.
Prakash, U. B. (1994). Bronchoscopy. Raven Press.
Rozycki, H., Van Houten, M., and Elliott, G. (1996). Quan-
titative assessment of intrathoracic airway collapse in
infants and children with tracheobronchomalacia. Pe-
diatric pulmonology, 21(4):241–245.
S´anchez, C., S´anchez, J., and Gil, D. (2011). Detect-
ing tracheal rings in videobronchoscopy images. In
CVCRD2011, pages 132–135.
S´anchez, C., S´anchez, J., Rosell, A., and Gil, D. (2012).
An illumination model of the trachea appearance in
videobronchoscopy images. ICIAR.
Vergnon, J., Costes, F., Bayon, M., and Emonot, A. (1995).
Efficacy of tracheal and bronchial stent placement on
respiratory functional tests. Chest, 107(3):741–746.
SegmentationofTrachealRingsinVideobronchoscopyCombiningGeometryandAppearance
161
