
Different Stimuli for Inference of Gene Regulatory Network
in Rheumatoid Arthritis
Peter Kupfer
1
, Sebastian Vlaic
1
, Ren
´
e Huber
2
, Raimund W. Kinne
3
and Reinhard Guthke
1
1
Leibnitz Institute for Natural Product Research and Infection Biology, Hans-Kn
¨
oll-Institute,
Beutenbergstr. 11a, D-07745 Jena, Germany
2
Institute of Clinical Chemistry, Hannover Medical School, Hannover, Germany
3
Experimental Rheumatology Unit, Department of Orthopedics, University Hospital Jena, Friedrich Schiller University,
Jena, Germany
Keywords:
Network Inference, Rheumatoid Arthritis, TNF-α, TGF-β1, IL-1, PDGF-D.
Abstract:
Since genetic and epigenetic factors are known to be involved in the pathogenesis of rheumatoid arthritis the
search for key players in this disease is one of the most important challenges. For this purpose gene regulatory
networks are one possibility to reveal underlying interactions for different stimuli. In this study we analyzed
the cellular response of synovial fibroblasts to 4 different stimuli. We infered a gene regulatory network that
is able to explain the observed data for stimulation by TNF-α, TGF-β1, IL-1 and PDGF-D simultaneously.
1 INTRODUCTION
Unveiling the dynamic and interlaced nature of gene
regulation is one of the most important aims in sys-
tems biology. The activity of functional gene products
is on the one hand influenced by transcription fac-
tors (TFs) and co-factors that influence transcription,
on the other hand by post-translational modification
of proteins as well as by the degradation of proteins
and transcripts. Gene regulatory networks (GRNs)
are a possibility to capture relations between molec-
ular entities. Networks are usually represented as
graphs consisting of nodes (representing genes and/or
proteins) and edges (representing molecular interac-
tions such as protein-protein and protein-DNA inter-
actions). In this publication we present a GRN that
integrates data of 4 different stimuli acting on syn-
ovial fibroblasts (SFBs) of rheumatoid arthritis (RA)
patients. RA is a multifactorial polygenic disease with
inflammatory impact of synovial joints. The inflam-
matory processes are triggered by cytokines and other
immune system-related genes. Several cytokines play
a critical role as mediators of immune regulation but
the precise molecular mechanisms are still unclear.
To investigate the therapeutic effects, cytokines like
TNF-α, TGF-β1, IL-1 and PDGF-D are used in clin-
ical practice. GRNs which describe the cellular re-
sponse to the individual stimulus are helpful in the in-
vestigation of the effects of cytokines. However, si-
multaneous investigations of multiple stimuli offer
the possibility to investigate the cellular actions from
multiple perspectives and therefore provide more in-
formation and better understanding.
2 MATERIALS & METHODS
2.1 Data
Synovial membrane samples were obtained following
tissue excision upon joint replacement/synovectomy
from RA patients (n = 6; all Caucasian) at the
Clinic of Orthopedics, Waldkrankenhaus ’Rudolf
Elle’ (Eisenberg, Germany) as outlined in Kupfer et
al. (Kupfer et al., 2012). Synovial fibroblasts were
stimulated with TNF-α, TGF-β1, IL-1 or PDGF-D for
0, 1, 2, 4, or 12 hours. By using U133 Plus 2.0 RNA
microarrays (Affymetrix, Santa Clara, CA, USA; to-
tal of 60 microarrays) the analysis of gene expression
was performed (for details see Kupfer et al. (Kupfer
et al., 2012)).
To resolve the problem of choosing reliable and
non-contradictory probesets for each transcript, the
alternative Chip Definition File (CDF) of Ferrari et
al. was used for annotating the genes (Ferrari et al.,
282
Kupfer P., Vlaic S., Huber R., W. Kinne R. and Guthke R..
Different Stimuli for Inference of Gene Regulatory Network in Rheumatoid Arthritis.
DOI: 10.5220/0004196402820287
In Proceedings of the International Conference on Bioinformatics Models, Methods and Algorithms (BIOINFORMATICS-2013), pages 282-287
ISBN: 978-989-8565-35-8
Copyright
c
2013 SCITEPRESS (Science and Technology Publications, Lda.)

2007). The microarray data were preprocessed us-
ing RMA in the default configuration (Irizarry et al.,
2003). Concerning the present study where a combi-
nation of different data sets was used we corrected the
data regarding the creation date were the microarrays
were generated with a modified version of ComBat
(Kupfer et al., 2012). The Sample Information File
was created as described in the ComBat manual. The
creation date of the microarrays was tagged as ’batch
effect’ and the parameters time point (total of 5), dis-
ease group (RA), and stimulation (TNF-α, TGF-β1,
IL-1 and PDGF-D) were marked as covariates for ev-
ery array.
To detect differentially expressed genes arisen
from microarray experiments, the R-package Limma
was used (Smyth, 2005). By using the expression
data, the contrast and the design matrix, differentially
expressed genes (DEGs) were obtained (Kupfer et al.,
2012). A combination of fold-change and p-value was
recommended by Shi et al. (Shi et al., 2008).
For testing the association between a given gene
list and Gene Ontology (GO) terms the Bioconductor
package GOstats was used (Falcon and Gentleman,
2007).
2.2 Network Inference
The transcription factor binding site integrating
LARS (TILAR) (Hecker et al., 2009) was used to
infer the gene regulatory network shown in Figure
1. The algorithm was modified to support time se-
ries data. The TILAR concept of modeling permits
gene regulation only via TFs for which the regulated
gene has a transcription factor binding site (TFBS) in
its promoter region and the regulating gene has not.
The advantage of this concept is that a initial prior-
knowledge network template of TF-to-gene relations
is constructed that automatically groups genes with
identical binding sites. This can decrease the num-
ber of possible edges in the network and therefore
lowers the complexity of the inference problem. The
information of the binding sites was extracted from
database Transfac (Matys, 2006). The least angle re-
gression (LARS) algorithm is then used for simulta-
neous selection of the gene-to-TF relations and opti-
mization of their weights. If such a relation is sup-
ported by prior-knowledge (expert knowledge or text
mining programs such as PathwayStudio) the TILAR
algorithm allows its soft integration. This results in
sparse network models with a high content of biolog-
ical prior-knowledge. Optimization of the network
template is performed by a stepwise forward selec-
tion procedure. In that, the algorithm starts with a
network template containing no TF-to-gene relation,
creates the model and calculates the residual sums of
squares (RSS) of the predicted to the measured ex-
pression values. For each TF-to-gene relation, the
new model is created according to the network tem-
plate, LARS is applied and the RSS is calculated. The
TF-to-gene relation that led to the lowest RSS is fixed.
This process is iteratively repeated until the RSS of
the new model is not lower then the RSS of the previ-
ous model.
2.3 Transfac
To extract TFBSs within the promoter regions of the
obtained differentially expressed genes Transfac can
be used (Matys, 2006). One advantage Transfac is
that the database contains experimentally validated
TFBSs.
2.4 PathwayStudio
For the extraction of validation knowledge Path-
wayStudio 9.0 was used with the integrated Mam-
malian database (Nikitin et al., 2003). With Path-
wayStudio it is possible to obtain literature knowl-
edge about the genes, the TFs and the corresponding
associations among each other.
3 RESULTS
3.1 Data Pre-processing
Starting with RMA-normalized data of the 60 arrays
for the time points 0, 1, 2, 4 and 12 hours, standard hi-
erarchical clustering dendrograms (using the R func-
tion hclust with Euclidean distances) were employed
to monitor possible batch effects. Furthermore the ex-
pression values were reviewed regarding differences
in their levels. To correct system biased differences
ComBat was applied.
3.2 Extracting Differentially Expressed
Genes
Limma was used to obtain differentially expressed
genes (DEGs; filtering by the conditions: > 2-fold-
change; p-value of 6 10
−10
) for the question concern-
ing a genetic difference between time point 0 and the
later time points within every single stimulus (TGF-
β1: 507 genes; TNF-α: 582 genes; IL-1: 333 genes
and PDGF-D: 534 genes). Creating the union of the
4 obtained gene lists provided a gene list contain-
ing 1448 genes. For the key question concerning RA
DifferentStimuliforInferenceofGeneRegulatoryNetworkinRheumatoidArthritis
283
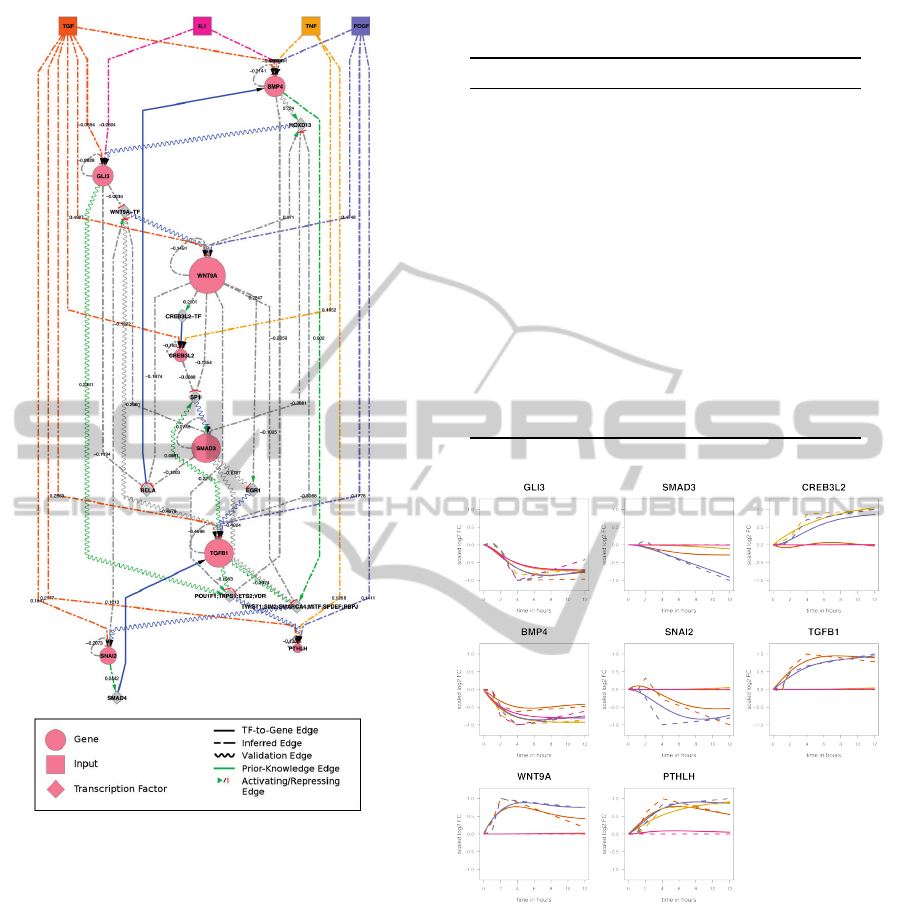
Figure 1: GRN describing the cellular response of 4 applied
stimuli.
and osteoarthritis (OA) a previous and published gene
list was used which contains genes differentially ex-
pressed between both diseases for the time point 0
(Kupfer et al., 2012). Using this list and the union
of the differentially expressed genes for all 4 stim-
uli the intersection of 541 genes was extracted. This
constitutes a genetic difference between RA and OA.
For the resulting list a gene enrichment analysis was
done with GOstats (p-value ≤ 0.05). As shown in Ta-
ble 1 the highest ranked GO term was cartilage devel-
opment with a p-value of 1.42
−07
and 18/134 genes.
With regard to the computational complexity of net-
work modeling we have chosen 8 out of the 18 ob-
tained genes of this GO term as highlighted in Table
2.
Table 1: Overrepresented GO categories in the set of DEGs
and the obtained p-values.
TermID Count Size Pvalue Term
GO:0051216 18 134 1.42e-07 cartilage development
GO:0002062 12 58 1.49e-07 chondrocyte differentia-
tion
GO:0048518 133 2898 1.87e-07 positive regulation of bi-
ological process
GO:0009888 61 1016 2.76e-07 tissue development
GO:0048522 122 2649 6.73e-07 positive regulation of cel-
lular process
GO:0048705 18 150 7.87e-07 skeletal system morpho-
genesis
GO:0001503 23 243 1.70e-06 ossification
GO:0006357 56 964 2.56e-06 regulation of transcrip-
tion from RNA poly-
merase II promoter
GO:0001649 15 116 2.56e-06 osteoblast differentiation
GO:0008284 38 551 2.61e-06 positive regulation of cell
proliferation
Figure 2: Measured and simulated expression profiles.
Dashed lines represent the measured log
2
-FC of the 4 stim-
uli. The simulated results are shown with solid lines.
3.3 Knowlege Extraction
By using Transfac we extracted all experimental vali-
dated TFBSs for the obtained genes for the following
network modeling. In the TILAR concept of mod-
elling, these TF-to-gene relations are used as a net-
work structure template. Furthermore, we extracted
literature knowledge for the genes, the TFs and the
extracted TFBSs by using Pathway Studio 9.0. There-
fore, we used the genes to be modeled, the obtained
regulating TFs and collected prior knowledge about
BIOINFORMATICS2013-InternationalConferenceonBioinformaticsModels,MethodsandAlgorithms
284

Table 2: Differentially expressed genes of the top-ranked
GO category (GO:0051216 cartilage development). Genes
used for network inference are highlighted in bold.
SYMBOL ENTREZ GENENAME UNIPROT
OSR1 130497 odd-skipped related 1 Q8TAX0
COMP 1311 cartilage oligomeric matrix
protein
P49747
DLX2 1746 distal-less homeobox 2 Q07687
FGF2 2247 fibroblast growth factor 2 P09038
GHR 2690 growth hormone receptor P10912
GLI2 2736 GLI family zinc finger 2 P10070
GLI3 2737 GLI family zinc finger 3 P10071
SMAD3 4088 SMAD family member 3 P84022
CHST11 50515 carbohydrate (chondroitin 4)
sulfotransferase 11
Q9NPF2
PTHLH 5744 parathyroid hormone-like
hormone
P12272
CREB3L2 64764 cAMP responsive element
binding protein 3-like 2
Q70SY1
BMP4 652 bone morphogenetic protein
4
P12644
BMP6 654 bone morphogenetic protein 6 P22004
SNAI2 6591 snail homolog 2 O43623
SNAI1 6615 snail homolog 1 O95863
TGFB1 7040 transforming growth factor,
beta 1
P01137
WNT9A 7483 wingless-type MMTV inte-
gration site family, member
9A
O14904
FGF18 8817 fibroblast growth factor 18 O76093
edges by Pathway Studio. The extracted knowledge
was verified manually.
3.4 Network Inference
Prior to the network inference, the gene expression
data of the three different experiments (TGF-β1 &
TNF-α, PDGF-D and IL-1) was scaled to a maximum
of 1. This was done to remove the experiment-specific
bias due to separate pre-processing and analysis. Sub-
sequently, for each gene which did not exceed a abso-
lute log
2
- fold change of 0.6 in the expression profile
of a treatment, all values of the corresponding profile
were substituted by 0. This way, small changes in the
expression which are likely to resemble noise were re-
moved preventing the algorithm from modeling artifi-
cial rather then the true biological signal. Linear inter-
polation was used to obtain measurements at equidis-
tant time points. We used a constant input function
to simulate the input of cell stimulation. TILAR was
then used for network inference. Identification of the
best algorithm parameters was performed in a param-
eter study optimizing the number of integrated prior-
knowledge edges with respect to the error between
the observed and the predicted log
2
- fold-changes.
The final network (Figure 1) was visualized in Cy-
toscape (Smoot et al., 2011) and is composed of 21
nodes (8 modeled genes, 9 bridging TFs and 4 in-
put perturbations) and 51 edges out of which 42 were
inferred by the algorithm (26 gene-to-TF edges and
16 input-to-gene edges). The remaining edges are
prior-knowledge TF-to-gene edges. Furthermore, 8
known direct gene-to-gene relations which were not
used by the algorithm during the inference were iden-
tified in the constructed network. The node size of the
modeled genes resembles their out-degree as visual-
ized in Figure 1. Together with the highest input-to-
gene edge weights, this property identifies especially
WNT9A as a signal distributing gene. The only gene
which is strongly affected by all four inputs is BMP4.
Regarding the fit of the simulated data compared to
the measured once we got akin dynamics as shown in
Figure 2.
3.5 Discussion
To our knowledge, this is the first network model
simulating the initial regulatory steps in SFBs dur-
ing stimulation with four different cytokines/growth
factors. An early event in fibroblast activation by
TNF-α, TGF-β1, IL-1, and PDGF-D is the expres-
sion of genes coding for additional secreted factors
also modulating cellular responses. In this context,
a variety of factors is synergistically induced in re-
sponse to two or more stimuli. For instance, both
TGF-β1 and PDGF-D are able to induce the expres-
sion of members of the TGF family (i.e., BMP4
and TGFB1), WNT9A (also known as WNT14), and
PTHLH (also known as PTHRP). PTHLH may also
be driven by TNF, whereas BMP4 could be induced
by all applied stimuli. Our model confirms other
studies reporting TGF- or TGF signalling-dependent
TGFB1, PTHLH, and WNT9A expression (Bascom
et al., 1989) (Kiriyama et al., 1993) (Spagnoli et al.,
2007) and TNF-dependent PTHLH or BMP4 expres-
sion (Funk et al., 1998) (Horiguchi et al., 2000) in
several cell types.
BMP4, WNT9A, and PTHLH are secreted factors
involved in tissue development, especially cartilage
and bone formation (Bramlage et al., 2006) (Hart-
mann and Tabin, 2001) (Karaplis et al., 1994). In
addition, PTHLH has been shown to mediate anti-
proliferative effects and to induce matrix-degrading
enzymes (Maioli et al., 2002) thus potentially in-
fluencing matrix and bone remodelling. The stim-
ulatory effects of these factors may trigger cellular
characteristics of SFB and other cell types in the
joint such as chondrocytes or osteoblasts (Tsumaki
et al., 2002)(Guo et al., 2004)(Amizuka et al.,
2000)(Ikegame et al., 2001). This cascade reflects
DifferentStimuliforInferenceofGeneRegulatoryNetworkinRheumatoidArthritis
285

the influence of activated SFB on development, func-
tion, and maintenance of the joints or, pathophysio-
logically, on joint destruction, synovitis, and fibrosis,
e.g., in the course of rheumatoid arthritis (Karouza-
kis et al., 2006)(Huber et al., 2006). Another set
of stimulation-dependent genes consists of selected
TFs, e.g., TGF- and IL-1-inducuble GLI3 and TGF-
inducible SNAI2 (also known as SLUG) which are
involved in regulating a variety of developmental pro-
cesses (Johnson and Tabin, 1997) (Nieto et al., 1994)
or TGF- and TNF-inducible CREB3L2 (also known
as BBF2H7) which participates in regulating cell sur-
vival and chondrogenesis (Sheng et al., 2010)(Saito
et al., 2009). In part, these findings are in good
agreement to the literature, since it has already been
shown that SNAI2 may be induced by TGF (Ao-
matsu et al., 2011). Further TFs are predominately
induced in response to secondarily secreted factors,
e.g., BMP4-induced HOXD13 which is also a regu-
lator of tissue/organ development (Goodman, 2002)
or WNT9A-induced EGR1 which contributes to ba-
sic processes such as tissue repair, (Braddock, 2001),
cellular growth regulation, and apoptosis (Liu et al.,
1998). Here, our model provides new insights into the
intricate successive regulation of TF-induction, since
indirect activation pathways are still inadequately
characterized in the literature. Following expression
and activation, these TFs mediate the regulation of
further target genes (which are not included in Figure
1) defining the superordinate cellular response of SFB
to the (combination of) different stimuli. However, in
the presented network, negative regulatory (feedback)
mechanisms occurring during TNF/TGF/IL-1/PDGF
stimulation are also predicted. They are mediated ei-
ther directly in response to the primary stimuli (e.g.,
inhibition of WNT9A TF, RelA, and GLI3 by TGF-
and IL-1-inducible GLI3) or indirectly in response to
secondarily secreted factors (e.g., POUF1, TRPS1,
ETS2, and VDR or TWIST1, SIM2, SMARCA4,
MITF, SPDEF, and RBPJ in response to WNT9A).
In consequence, a variety of genes is regulated via a
complex network of positively or negatively regulated
TFs representing the interplay between activating and
deactivating features during stimulation with several
cytokines/growth factors.
4 CONCLUSIONS
In this study we were able to present a single net-
work model that describes TGF-β1, TNF-α, IL-1 and
PDGF-D stimulation simultaneously. The fit to all ex-
pression profiles of genes included was excellent and
the robustness analysis showed that the obtained net-
work is reliable. Moreover, the biological meaning
of the infered GRN shows new insights like the intri-
cate successive regulation of TF-induction as well as
already published results regarding the single stimuli.
These results are now combined in one network.
ACKNOWLEDGEMENTS
This work was supported by grants from the German
Federal Ministry of Education and Research (BMBF
FKZ 0315719A (PK); 0315736 (SV); ERASysBio
PLUS; LINCONET and VIRTUAL LIVER).
REFERENCES
Amizuka, N., Henderson, J. E., White, J. H., Karaplis,
A. C., Goltzman, D., Sasaki, T., and Ozawa, H.
(2000). Recent studies on the biological action of
parathyroid hormone (pth)-related peptide (pthrp) and
pth/pthrp receptor in cartilage and bone. Histol
Histopathol, 15(3):957–70.
Aomatsu, K., Arao, T., Sugioka, K., Matsumoto, K.,
Tamura, D., Kudo, K., Kaneda, H., Tanaka, K., Fu-
jita, Y., Shimomura, Y., and Nishio, K. (2011). Tgf-
induces sustained upregulation of snai1 and snai2
through smad and non-smad pathways in a human
corneal epithelial cell line. Invest Ophthalmol Vis Sci,
52(5):2437–43.
Bascom, C. C., Wolfshohl, J. R., Coffey, Jr, R. J., Madisen,
L., Webb, N. R., Purchio, A. R., Derynck, R., and
Moses, H. L. (1989). Complex regulation of trans-
forming growth factor beta 1, beta 2, and beta 3 mrna
expression in mouse fibroblasts and keratinocytes by
transforming growth factors beta 1 and beta 2. Mol
Cell Biol, 9(12):5508–15.
Braddock, M. (2001). The transcription factor egr-1: a po-
tential drug in wound healing and tissue repair. Ann
Med, 33(5):313–8.
Bramlage, C. P., H
¨
aupl, T., Kaps, C., Ungeth
¨
um, U., Krenn,
V., Pruss, A., M
¨
uller, G. A., Strutz, F., and Burmester,
G.-R. (2006). Decrease in expression of bone morpho-
genetic proteins 4 and 5 in synovial tissue of patients
with osteoarthritis and rheumatoid arthritis. Arthritis
Res Ther, 8(3):R58.
Falcon, S. and Gentleman, R. (2007). Using GOstats to test
gene lists for GO term association. Bioinformatics,
23(2):257–8.
Ferrari, F., Bortoluzzi, S., Coppe, A., Sirota, A., Safran, M.,
Shmoish, M., Ferrari, S., Lancet, D., Danieli, G. A.,
and Bicciato, S. (2007). Novel definition files for hu-
man GeneChips based on GeneAnnot. BMC Bioinfor-
matics, 8:446.
Funk, J. L., Cordaro, L. A., Wei, H., Benjamin, J. B., and
Yocum, D. E. (1998). Synovium as a source of in-
creased amino-terminal parathyroid hormone-related
protein expression in rheumatoid arthritis. a possible
BIOINFORMATICS2013-InternationalConferenceonBioinformaticsModels,MethodsandAlgorithms
286

role for locally produced parathyroid hormone-related
protein in the pathogenesis of rheumatoid arthritis. J
Clin Invest, 101(7):1362–71.
Goodman, F. R. (2002). Limb malformations and the hu-
man hox genes. Am J Med Genet, 112(3):256–65.
Guo, X., Day, T. F., Jiang, X., Garrett-Beal, L., Topol, L.,
and Yang, Y. (2004). Wnt/beta-catenin signaling is
sufficient and necessary for synovial joint formation.
Genes Dev, 18(19):2404–17.
Hartmann, C. and Tabin, C. J. (2001). Wnt-14 plays a piv-
otal role in inducing synovial joint formation in the
developing appendicular skeleton. Cell, 104(3):341–
51.
Hecker, M., Goertsches, R. H., Engelmann, R., Thiesen,
H.-J., and Guthke, R. (2009). Integrative modeling of
transcriptional regulation in response to antirheumatic
therapy. BMC Bioinformatics, 10:262.
Horiguchi, M., Akiyama, H., Ito, H., Shigeno, C., and
Nakamura, T. (2000). Tumour necrosis factor-alpha
up-regulates the expression of bmp-4 mrna but in-
hibits chondrogenesis in mouse clonal chondrogenic
ec cells, atdc5. Cytokine, 12(5):526–30.
Huber, L. C., Distler, O., Tarner, I., Gay, R. E., Gay, S.,
and Pap, T. (2006). Synovial fibroblasts: key play-
ers in rheumatoid arthritis. Rheumatology (Oxford),
45(6):669–75.
Ikegame, M., Ishibashi, O., Yoshizawa, T., Shimomura, J.,
Komori, T., Ozawa, H., and Kawashima, H. (2001).
Tensile stress induces bone morphogenetic protein 4
in preosteoblastic and fibroblastic cells, which later
differentiate into osteoblasts leading to osteogenesis
in the mouse calvariae in organ culture. J Bone Miner
Res, 16(1):24–32.
Irizarry, R. A., Hobbs, B., Collin, F., Beazer-Barclay, Y. D.,
Antonellis, K. J., Scherf, U., and Speed, T. P. (2003).
Exploration, normalization, and summaries of high
density oligonucleotide array probe level data. Bio-
statistics, 4(2):249–64.
Johnson, R. L. and Tabin, C. J. (1997). Molecular models
for vertebrate limb development. Cell, 90(6):979–90.
Karaplis, A. C., Luz, A., Glowacki, J., Bronson, R. T., Ty-
bulewicz, V. L., Kronenberg, H. M., and Mulligan,
R. C. (1994). Lethal skeletal dysplasia from targeted
disruption of the parathyroid hormone-related peptide
gene. Genes Dev, 8(3):277–89.
Karouzakis, E., Neidhart, M., Gay, R. E., and Gay, S.
(2006). Molecular and cellular basis of rheumatoid
joint destruction. Immunol Lett, 106(1):8–13.
Kiriyama, T., Gillespie, M. T., Glatz, J. A., Fukumoto,
S., Moseley, J. M., and Martin, T. J. (1993). Trans-
forming growth factor beta stimulation of parathyroid
hormone-related protein (pthrp): a paracrine regula-
tor? Mol Cell Endocrinol, 92(1):55–62.
Kupfer, P., Guthke, R., Pohlers, D., Huber, R., Koczan, D.,
and Kinne, R. W. (2012). Batch correction of microar-
ray data substantially improves the identification of
genes differentially expressed in rheumatoid arthritis
and osteoarthritis. BMC Med Genomics, 5(1):23.
Liu, C., Rangnekar, V. M., Adamson, E., and Mercola, D.
(1998). Suppression of growth and transformation and
induction of apoptosis by egr-1. Cancer Gene Ther,
5(1):3–28.
Maioli, E., Fortino, V., Torricelli, C., Arezzini, B., and
Gardi, C. (2002). Effect of parathyroid hormone-
related protein on fibroblast proliferation and collagen
metabolism in human skin. Exp Dermatol, 11(4):302–
10.
Matys, V. (2006). TRANSFAC(R) and its mod-
ule TRANSCompel(R): transcriptional gene regu-
lation in eukaryotes. Nucleic Acids Research,
34(90001):D108–D110.
Nieto, M. A., Sargent, M. G., Wilkinson, D. G., and Cooke,
J. (1994). Control of cell behavior during vertebrate
development by slug, a zinc finger gene. Science,
264(5160):835–9.
Nikitin, A., Egorov, S., Daraselia, N., and Mazo, I. (2003).
Pathway studio–the analysis and navigation of molec-
ular networks. Bioinformatics (Oxford, England),
19(16):2155–2157. PMID: 14594725.
Saito, A., Hino, S.-i., Murakami, T., Kanemoto, S., Kondo,
S., Saitoh, M., Nishimura, R., Yoneda, T., Furuichi,
T., Ikegawa, S., Ikawa, M., Okabe, M., and Imaizumi,
K. (2009). Regulation of endoplasmic reticulum
stress response by a bbf2h7-mediated sec23a path-
way is essential for chondrogenesis. Nat Cell Biol,
11(10):1197–204.
Sheng, Z., Li, L., Zhu, L. J., Smith, T. W., Demers, A.,
Ross, A. H., Moser, R. P., and Green, M. R. (2010).
A genome-wide rna interference screen reveals an es-
sential creb3l2-atf5-mcl1 survival pathway in malig-
nant glioma with therapeutic implications. Nat Med,
16(6):671–7.
Shi, L., Jones, W. D., Jensen, R. V., Harris, S. C., and
Perkins, e. a. (2008). The balance of reproducibil-
ity, sensitivity, and specificity of lists of differentially
expressed genes in microarray studies. BMC Bioin-
formatics, 9(Suppl 9):S10. PMID: 18793455 PMCID:
2537561.
Smoot, M. E., Ono, K., Ruscheinski, J., Wang, P., and
Ideker, T. (2011). Cytoscape 2.8: new features for data
integration and network visualization. Bioinformatics
(Oxford, England), 27(3):431–432. PMID: 21149340.
Smyth, G. K. (2005). Limma: linear models for microarray
data. In Gentleman, R., Carey, V., Dudoit, S., Irizarry,
R., and Huber, W., editors, Bioinformatics and Com-
putational Biology Solutions using R and Bioconduc-
tor, pages 397–420. Springer, New York.
Spagnoli, A., O’Rear, L., Chandler, R. L., Granero-Molto,
F., Mortlock, D. P., Gorska, A. E., Weis, J. A., Lon-
gobardi, L., Chytil, A., Shimer, K., and Moses, H. L.
(2007). Tgf-beta signaling is essential for joint mor-
phogenesis. J Cell Biol, 177(6):1105–17.
Tsumaki, N., Nakase, T., Miyaji, T., Kakiuchi, M., Kimura,
T., Ochi, T., and Yoshikawa, H. (2002). Bone mor-
phogenetic protein signals are required for cartilage
formation and differently regulate joint development
during skeletogenesis. J Bone Miner Res, 17(5):898–
906.
DifferentStimuliforInferenceofGeneRegulatoryNetworkinRheumatoidArthritis
287
