
Activation of the Following Mode to Simulate Heterogeneous Pedestrian
Behavior in Crowded Environment
Laure Bourgois
1
, Thomas Heckmann
1
, Emmanuelle Grislin-Le Strugeon
2
and Jean-Michel Auberlet
1
1
Universit´e Paris Est, IFSTTAR-IM-LEPSIS, 53 Bd Lefebvre, 75732 Paris, Cedex 15, France
2
Universit´e Lille-Nord de France et LAMIH-UMR 8201, Universit´e de Valenciennes,
Le Mont Houy, 59313 Valenciennes Cedex, France
Keywords:
Agent, Simulation, Pedestrian Model, Navigation, Following Mode.
Abstract:
To simulate pedestrian crowds, most of the current studies use the microscopic approach, in which the pedes-
trian is modeled as an individual entity. With the microscopic approach, the heterogeneity in the pedestrian
population is mostly based on inter-individual difference in the agent model parameters, like speed, destina-
tion, etc. In fact, what can be seen in congested real situations, is some pedestrians choosing to temporarily
follow other ones in order to facilitate the flow while going on avoiding collisions. Each pedestrian can choose
to adopt and leave such a behavior according to his/her individual and local situation. In order to model and
simulate this behavior, we propose to include in the pedestrian agent navigational model a decision process
that allows to activate the following task in addition to the collision avoidance task. The decision depends on
the agent’s internal state and on what it perceives in its environment. Our proposition is an attempt to define
the conditions that must trigger the switching to another navigation mode, and the selection of the other agent
to be followed, i.e. the “leader”.
1 INTRODUCTION
The microscopic approach is widely used for model-
ing pedestrian crowds; each pedestrian is seen as an
individual and independent entity. The agent’s nav-
igation behavior, independently from the continuous
or discrete environment representation, results then
from a sum of forces (Helbing and Molnar, 1995) or
from a set of rules (Reynolds, 1987). In comparison
to the macroscopic approach based on flow models
and used to assess pedestrian quantities, the micro-
scopic approach is appropriate to predict interactions
and behavioral adaptation in a group.
One drawback of the actual microscopic approach
is its relative poorness for modeling heterogeneity in
the pedestrian population. Indeed the inter-individual
difference between pedestrians lie in the agent model
parameters, like shoulders size, speed, destination,
etc. In real life, it is usual to observe in congested sit-
uations that some pedestrians choose to temporarily
follow other ones in order to facilitate the flow while
going on avoiding collisions. Thus, each pedestrian
can choose to adopt and leave such a behavior accord-
ing to his/her individual and local situation. This is
the phenomenon we want to model and simulate.
Our aim is thus to include in the pedestrian agent
navigational model a decision process that allows to
switch between the collision avoiding behavior and
a behavior that combines two moving modes, i.e. the
collision avoidingand the following modes. The deci-
sion depends on the agent’s internal state and on what
it perceives in its environment. The difficulty is to de-
fine the conditions that must trigger the switching to
another navigation mode, and then to define the other
agent to be followed, i.e. the “leader”.
The rest of the article is organized as follows.
Section 2 presents related works based on the micro-
scopic approach in the pedestrian modeling and sim-
ulation field. Section 3 explains the global model that
makes the context of our works, then details the part
of the model proposed here and dedicated to the fol-
lowing task. The proposition has been implemented
and has been the subject of first evaluations reported
in section 4, before conclusion.
2 RELATED WORKS
In the microscopic approach, two main categories
of models can be used to simulate pedestrian move-
178
Bourgois L., Heckmann T., Grislin-Le Strugeon E. and Auberlet J..
Activation of the Following Mode to Simulate Heterogeneous Pedestrian Behavior in Crowded Environment.
DOI: 10.5220/0004195101780183
In Proceedings of the 5th International Conference on Agents and Artificial Intelligence (ICAART-2013), pages 178-183
ISBN: 978-989-8565-38-9
Copyright
c
2013 SCITEPRESS (Science and Technology Publications, Lda.)

ments: the models based on behavioral rules and the
models based on physical rules.
In the first category, the most known is the Boids
model, introduced in (Reynolds, 1987), used first
to simulate coordinated animal motion such as bird
flocks and fish schools, and then crowd path following
behaviors. Such models are based on the combination
of multiple behaviors (e.g., obstacle avoidance, path
following and entity separation), either by switch-
ing between them (an action selection problem) or by
blending when they are compatible (e.g., see (Hanon
et al., 2003)). The global model of the autonomous
character is composed as a hierarchy of three layers:
action selection (strategy), steering (path determina-
tion), and locomotion (animation). This produces
group behaviors with homogeneous behavior inside
the group. In comparison, we try to develop the pos-
sibility to get more differentiated behaviors.
Another model based on a set of behaviors is pre-
sented in the CROWD-MAGS project (Moulin and
Larochelle, 2010), with a tool to model and simu-
late crowds. The behaviors are complex and repre-
sented by hierarchical rules. The objective is to ex-
tend existing models with the help of the explicit no-
tion of social cohesiveness: any agent knows it be-
longs to a group and its decisions depend on this
knowledge. Group membership is determined by a
cognitive process (e.g., based on the aggressiveness
feeling). In comparison, our aim is to model crowd
made of anonymous persons, with low level interac-
tions.
In the second category of models, a well-known
model is the Social Force Model (SFM) by Helbing
and Molnar (Helbing and Molnar, 1995). This model
describes a pedestrian in a crowd as an entity subject
to attractive forces (e.g., its destination, the other en-
tities in the same group) and repulsive forces (e.g.,
walls, other external entities). The model is widely
used for reasons of simplicity and extensibility, each
author providing specific parameters depending on
the situations to be simulated. Social forces are for
example used to simulate pedestrian dynamics in the
Floor Field models (Schadschneider et al., 2002) in
the context of discretized environments (cellular au-
tomata). However, SFM involves limitations, because
it is essentially a reactive model, with passive percep-
tion and homogeneous pedestrian interactions.
Teknomo adds a second order term to manage col-
lisions in a similar model, based on the social force
notion (Teknomo, 2009), but with the same limita-
tions. Recent works (Moussaid et al., 2010), derived
from the Helbing’s model, present common character-
istics with the CROWD-MAGS project cited above,
because they include similar knowledge, or aware-
!"#$%&"'!"()
*+,""$"-)
!"
.(%,(!-$/)+!#!+)
0&++$1$&")
,#&$2,"/!)
!"
3,/4/,+)+!#!+)
5&4&")
/&"(%&+)
6*!%,4&",+)+!#!+)
78%18$()
94"!%,%:)
*,%(1)
/;,"-!1)
<+&=>+!#!+?)
.$(8,4&")
'&2!+)
*!%/!*4&")
*!%/!*4&")
*!%/!*4&")
*!%/!*4&
")
*!%/!*4&")
=>+!#!+
?)
5&
4&
94"!%,
@)
A) B)
C)
Figure 1: General model of the pedestrian agent.
ness, of group membership. The aim is to simulate,
by the use of attractive forces, some recurrent patterns
observed while groups are formed and their influence
on the crowd flow. For the same reason as for the
CROWD-MAGS, this does not match our aim. Qiu’s
work (Qiu and Hu, 2010) simulates crowd behaviors
either. Inside a group, the influence of the group
members is used to define the individual position and
moving direction. The model provided by Hoogen-
doorn (Hoogendoorn and Bovy, 2000)(Hoogendoorn
and Daamen, 2005) used concepts from the control
theory. In this model, the pedestrian optimizes a util-
ity function computed from costs associated to ac-
celeration, spatial proximity and path diversion. The
pedestrian architecture includes three levels:
• the strategic level, for long-term decision, like
itinerary planning;
• the tactical level, for middle-term decision, like
path or interaction type selection;
• the operational level, for short-term action, like
instantaneous physical motion.
Hoogendoorn suggests to make the levels collaborate,
but without any formalization, nor precise descrip-
tion. However, this architecture provides a structure
that offers common points with the human behavior
modeling, as Allen’s driving task model (Allen et al.,
1971), and thus can facilitate the integration of results
from this domain.
3 THE PEDESTRIAN MODEL
Our model of the pedestrian agent includes three lev-
els — the strategic, tactic and operational levels —
described in Fig. 1, adapted from the hierarchical ar-
chitecture proposed by Hoogendoorn (Hoogendoorn
and Bovy, 2000). Our purpose concerns more pre-
cisely the tactical and operational levels.
We propose a model in which the agent’s behavior
results from inter-levels and intra-level interactions.
At the operational level and with the perceived data (1
ActivationoftheFollowingModetoSimulateHeterogeneousPedestrianBehaviorinCrowdedEnvironment
179

in Fig. 1), the agent updates its representation of the
current situation, including its own state. The identi-
fied situation (2 in Fig. 1) is used at the tactical level
to select one of the navigation tasks and can be used
to move up to the strategic level if itinerary modifi-
cation is needed (3 in Fig. 1). Once a navigational
task is selected, the control returns to the lowest level
for the agent’s motion (4 in Fig. 1). The perception
process of our model has been detailed in previous
works (Bourgois et al., 2012). In this paper, we detail
the selection of the navigation task, and more specifi-
cally the conditions to activate the following task in a
crowded environment.
3.1 Navigation Tasks
In our model, the physical and internal states of the
pedestrian agent p are based on the Social Force
Model from Helbing (Helbing and Molnar, 1995) and
on the notation by Hoogendoorn (Hoogendoorn and
Daamen, 2005). We define the behavior b
p
(t) of the
pedestrian agent p at time t by three components,
which are the agent’s physical state S
p
(t), goal G
p
and behavioral thresholds T
p
:
b
p
(t) = (S
p
(t),G
p
,T
p
)
The agent’s physical state is defined at time t by
its location r
p
(t), velocity v
p
(t) and direction vector
~
d
p
(t):
S
p
(t) = (r
p
(t),v
p
(t),
~
d
p
(t))
The agent’s internal state is only detailed concern-
ing the agent’s goal, which is assumed to be invariant
during the simulation and defined by a final location
d
p
and a desired velocity (free speed) v
∗
p
:
G
p
= (d
p
,v
∗
p
)
The behavior of the agent p is parameterized ac-
cording to a set of thresholds T
p
that determine its
reaction to the current situation. In previous works
(Bourgois et al., 2012), we have defined the intensity
and the sensibility thresholds that are used to quantify
the force exerted by an agent on another. Our aim is
here to study a sub-set of T
p
dedicated to the follow-
ing task.
3.2 Activation of the Following Task
At the tactical level, we focus on two tasks included
in the navigation activity and that can be antagonist:
the collision avoidance task and the following task.
The agent activates these tasks according to its inter-
nal state and the surrounding situation. Particularly,
the following task is triggered by the decision process
on the base of the population density in the agent’s
neighborhood, and the agent’s velocity and direction.
At time t, three factors are combined to change the
internal state, and lead to make the decision: one sit-
uational factor, which is the agent p’s neighborhood
density N
p
(t); two self-awareness factors, which are
the difference from the agent’s direction
~
d
p
(t) to its
ideal direction
~
d
∗
p
(t) (calculated on the base of its final
location goal d
p
) and the difference from the agent’s
velocity v
p
(t) to its ideal velocity v
∗
p
. The values of
these factors are compared to three associated thresh-
olds to decide on the following task activation:
• s
N
p
is the neighborhood density threshold,
• s
d
p
is the direction threshold, and
• s
v
p
is the velocity threshold.
The activation of the following task depends on
three conditions relatively to these thresholds:
if
(N
p
(t) > s
N
p
)
and
(|
~
d
p
(t) −
~
d
∗
p
(t)| < s
d
p
)
and
(|v
p
(t) −
∑
N
p
(t)
i
v
i
(t)
N
p
(t)
| < s
v
p
)
then
leader
← selectLeader()
;
if (leader exists) then
activateFollowingTask()
;
We point out that the agent can decide to activate
the following mode, but in some case, it can not find
a leader. Indeed, the following task is composed of
two process, one to recognize the situation and one
to choose the most relevant one to follow. The first
condition to trigger the following mode is to exceed
a defined amount of neighbors. The pedestrian den-
sity N
p
(t) that is taken into account at time t by the
agent p in its neighborhood is computed on the base
of a relevance distance. We have evaluated this rel-
evance distance in previous works (Bourgois et al.,
2012), in which we have shown that the set of neigh-
bors really taken into account varies according to the
raw number of neighbors perceived by the agent in its
field of vision: higher is the raw number of neighbors
perceived, smaller is the radius at which the neigh-
bors are taken into account. The relevance distance
has been empirically determined according to the raw
number of neighbors perceived by the agent in a 9m-
deep field of vision. The second condition to trigger
the following mode is to go close enough to the ideal
direction. This condition defines the maximal differ-
ence between the current direction and the ideal direc-
tion. When the condition is not validated, the agent is
currently steering towards a point that is too far from
the ideal to benefit from the following mode.
ICAART2013-InternationalConferenceonAgentsandArtificialIntelligence
180

!"
#$%$&'"()*+"+)!,-"
.+)/01*,2345"
6177)',"+$7)68&'"."""""""""5"
!
d
p
(t)
7)*)90'6)"
+$%,0'6)"
Figure 2: Vision and relevance fields from pedestrian p
viewpoint. Pedestrians are represented by the (small) cir-
cles.
The third condition to trigger the following mode
is to have a velocity that is close enough to the aver-
age velocity in the neighborhood. This condition de-
fines the maximal difference between the agent’s cur-
rent velocity and the average velocity of its neighbors.
When the condition is not validated, the agent is sup-
posed to be either too slow or too fast to be able to fol-
low its neighbors. However, the condition can make
the agent lose the opportunity to follow one member
in the group that would be faster than the others.
The potential leaders are then the other agents that
are located in the half-circle whose radius is the rel-
evance distance (Cf. Fig. 2). To start the following
activity, one of these agents must be selected as the
leader. We have studied three criteria that can be rel-
evant to make the selection:
1. the distance: the leader is the one that minimizes
the difference between its location and the agent’s
current location (i.e., r
p
(t));
2. the direction: the leader is the one that mini-
mizes the difference between its direction and the
agent’s ideal direction (i.e.,
~
d
∗
p
(t));
3. the velocity: the leader is the one that minimizes
the difference between its velocity and the agent’s
current velocity (i.e., v
p
(t)).
For example, in Fig. 3, with two potential lead-
ers at a relevant distance from the agent p, the agent
a would be chosen to be the leader if the direction is
used as the unique selection criterion; it would be the
agent b if the distance is used as the criterion. An-
other possibility would be to combine these criteria.
If two leaders can be chosen, then the first in the list
is selected.
Finally, we remind that this activation process is
made at each step of the simulation. Thus to deacti-
vate the following task is equivalent to not activate the
task.
3.3 The Following Task
When the following task is activated, our model cal-
!"
!
d
p
(t)
#"
$"
!
d
b
(t)
!
d
a
(t)
!
d
*
p
(t)
d
p
p
d
(
t
)
$"
$"
d
p
(
t
)
!
d
(
t
)
p
p
!
d
Figure 3: Selection of the leader to be followed by pedes-
trian p.
culates a sum of forces: the repulsive one are com-
puted according to the standard SFM but the attractive
one is now determined by the leader. Obviously, the
chosen leader is not taken into account in the calculus
of the repulsive forces. Therefore, in the following
task, the final destination is momentarily replaced by
the follow-up of the leader. In such a way, one pedes-
trian agent may have at its disposal a new temporary
destination at every time step. We point out that this
solution is a preliminary one; in this paper we focus
on the conditions of the activation of the following
mode. Moreover, this solution handles the following
case: if an obstacle suddenly interferes in the trajec-
tory of one agent then a repulsive force is applied on
the agent by this obstacle as in the standard model.
The following section details our first results.
4 SIMULATION AND FIRST
EVALUATIONS
In these experiments and as a first attempt, we have
evaluated the relevance of each leader selection crite-
rion (i.e., distance, direction and velocity) separately.
To create easily a sufficient density value, the en-
vironment constrains the agents to move in a 10m
width by 60m length corridor. The input generates
6000 pedestrians per 30 simulated mn on the base of
a Poisson law. This rate is considered to be realistic
because it is consistent with the study in (Huat et al.,
2005) that refers to Fruin’s book (Fruin, 1971).
4.1 Model Variants Evaluation
At first, the thresholds related to the following mode
are parameterized with the values: s
N
p
= 2 pedestrians,
s
d
p
= 15
◦
, and s
v
p
= 0.6 m.s
−1
. We have collected the
simulation data in a 30m width window in the mid-
dle of the corridor to have a stable situation, without
noise due to pedestrian generation or to destination
reaching.
Then three variants of the model based on three
different selectLeader functions have been evaluated,
ActivationoftheFollowingModetoSimulateHeterogeneousPedestrianBehaviorinCrowdedEnvironment
181
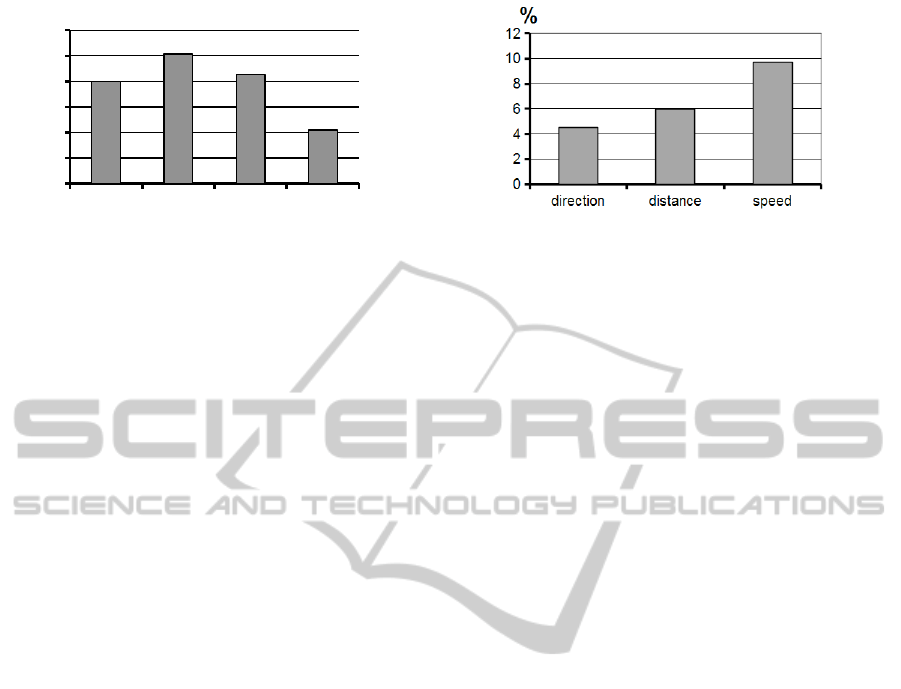
!"#$%&"'( !")&*(%$ )+$$! ,$-."(/
0!01
0!02
0!03
0!04
0!1
0!11
0!12
!"#
Figure 4: Pedestrians’ average velocity in the three variants
of our model and in the Social Force Model.
according to the three possible criteria for the selec-
tion. The following measures are used for the evalua-
tion:
• average velocity,
• average itinerary length,
• average collision number.
The two first measures are frequently used as perfor-
mance indicators to evaluate or validate traffic mod-
els. We see the last one as a quality (or resp. error)
indicator. Indeed, it has been demonstrated that the
Helbing’s model allows the pedestrians to choose po-
sitions that are sufficiently close to create collisions
(i.e., having a non empty intersection of their occu-
pying ground surface). We calculate then the number
of collisions with the intent to consider the smaller
number the best.
The results of these experiments are the following.
• In the evaluated situation, which is congested, our
model enables to improve the pedestrians’ veloc-
ity, whatever the variant is used, compared to the
Helbing’s model alone (see Fig. 4). The distance
variant gives the best results among the three vari-
ants when evaluated by the velocity criterion.
• Using the average collision number criterion, our
model provides significative improvements com-
pared to the Helbing’s model alone (see Fig. 5).
However, among the variants, the results are dif-
ferent from what was found with the velocity cite-
rion, because the velocity-based variant gives here
the best gain (i.e., the highest diminution of the
collisions).
• Finally, the average itinerary length remains iden-
tical whatever model variant is used.
In summary, these results show that the introduc-
tion of the following mode in complement to the SFM
allows some improvements in the simulation fluidity.
We explain this result by a higher homogeneity in the
group flow, regarding its direction and velocity, when
the agents can activate the following mode to face
high density.
Figure 5: Gain in the pedestrians’ average number of colli-
sions (in %) in the three variants of our model compared to
the Social Force Model taken as reference.
4.2 Threshold Values Evaluation
In these second experiments, in the same conditions
as the first ones about the simulation environment,
we have compared different values of the thresh-
olds: s
N
p
∈ {2,3, 4} pedestrians, s
d
p
∈ {20, 30, 60}
◦
,
and s
v
p
∈ {0.4, 0.5, 0.6} m.s
−1
. The combination of
the different values together with each variant of the
model produces 81 possibilities, which have been
evaluated using the velocity and collision number cri-
teria used in the first experiments. We will not give
here all the results, but only the most significant of
them that concern the direction variant.
The standard deviation in the velocity remains
similar with the different threshold values. We can
notice however that the lowest deviations, i.e. the
weakest difference of speeds between agents, are
given for the values s
d
p
= 60
◦
and s
v
p
= 0.5 m.s
−1
,
which means this combination produces a more ho-
mogeneous flow.
Regarding the number of collisions, the results
show improvements compared to the SFM, as in the
first experiments. Excepted that the collisions rise
when s
N
p
is low and s
d
p
and s
v
p
are high, especially with
the combination s
N
p
= 2, s
d
p
= 60 and s
v
p
= 0.6. Such
a situation makes the conditions to activate the fol-
lowing mode easier to be validated, and thus a higher
amount of agents decide to switch to the following
mode. Our explanation, at this step of the study, for
the increase in the amount of collisions, is that the fol-
lowing mode tends to decrease the velocity, and thus
can lead to more congested situations, with more col-
lisions.
5 CONCLUSIONS
We have proposed a following mode to be included
in a perception-oriented hierarchical architecture to
model and simulate the pedestrian behavior. The fi-
nal aim is to simulate heterogeneous pedestrian pop-
ICAART2013-InternationalConferenceonAgentsandArtificialIntelligence
182

ulation, including pedestrians who follow and other
ones who avoid. The proposition enables the pedes-
trian agent to activate the following mode depending
on the situation, on the base of its internal state and
its perception. In addition to the positions of the oth-
ers like in Helbing’s model, the proposed model al-
lows to take into account other criteria, i.e. neigh-
borhood density, current direction and velocity. First
experiments were realized with three variants of the
model concerning the selection of the leader for the
following mode. Evaluations made with performance
and quality indicators (average velocity and number
of collisions) seem promising. They show that, in
crowded environment, the model allows to improve
the flow with a higher average velocity while lower-
ing the number of collisions.
A lot of work remains to be done. We have to
carry out new experiments in different environments,
to confirm and better understand the effects of the
model on the flow, and the parameterization of the
distances. Additional indicators could help us to char-
acterize the three variants of the model. Moreover,
we would like to be able to reproduce the stop-and-go
phases simulated in Lemercier’s study about waiting
files (Lemercier et al., 2011). Further works are cur-
rently done (Ketenci et al., 2010), which we intend to
integrate as parts of the pedestrian global model.
ACKNOWLEDGEMENTS
This work forms a part of the TerraDynamica project,
with funding from the French Fonds Unique Intermin-
ist
´
eriel (FUI).
REFERENCES
Allen, T. M., Lunenfeld, H., and Alexander, G. (1971).
Driver information needs. Highway Research Board,
36:102–115.
Bourgois, L., Saunier, J., and Auberlet, J.-M. (2012). To-
wards contextual goal-oriented perception for pedes-
trian simulation. In Filipe, J. and Fred, A. L. N., edi-
tors, ICAART (2), pages 197–202. SciTePress.
Fruin, J. (1971). Pedestrian planning and design.
Metropolitan Association of Urban Designers and En-
vironmental Planners.
Hanon, D., Grislin-Le Strugeon, E., and Mandiau, R.
(2003). A behavior based architecture for the control
of virtual pedestrians. In The 2nd Int. Conf. on Comp.
Intell., Robotics and Aut. Syst. CIRAS, pages 125–132.
Helbing, D. and Molnar, P. (1995). Social force model for
pedestrian dynamics. Physical Review E, 51:4282–
4286.
Hoogendoorn, S. P. and Bovy, P. (2000). Gas-kinetic model-
ing and simulation of pedestrian flows. Transportation
Research Record, pages 28–36.
Hoogendoorn, S. P. and Daamen, W. (2005). Pedestrian
behavior at bottlenecks. J. Transp. Sc.
Huat, L., Ma’Some, D., and Shankar, R. (2005). Revised
walkway capacity using platoon flows. In Eastern
Asia Society for Transportation Studies, volume 5,
pages 996–1008.
Ketenci, U., Br´emond, R., Auberlet, J., and Grislin-Le Stru-
geon, E. (2010). Bounded active perception. In 8th
European Workshop on Multi-Agent Systems EUMAS.
Lemercier, S., Jelic, A., Hua, J., Fehrenbach, J., Degond,
P., Appert-Rolland, C., Donikian, S., and Pettre, J.
(2011). Un mod`ele de suivi r´ealiste pour la simu-
lation de foules. Revue Electronique Francophone
d’Informatique Graphique, 5(2).
Moulin, B. and Larochelle, B. (2010). Crowdmags, multi-
agent geo-simulation of the interactions of a crowd
and control forces. Modelling, Simulation and Identi-
fication, pages 213–237.
Moussaid, M., Perozo, N., Garnier, S., Helbing, D., and
Theraulaz, G. (2010). The walking behaviour of
pedestrian social groups and its impact on crowd dy-
namics. PLoS ONE.
Qiu, F. and Hu, X. (2010). Modeling group structures in
pedestrian crowd simulation. Simulation Modelling
Practice and Theory, 18(2):190–205.
Reynolds, C. (1987). Flocks, herds, and schools: A
distributed behavioral model. Computer Graphics,
21(4):25–34.
Schadschneider, A., Kirchner, A., and Nishinari, K. (2002).
Ca approach to collective phenomena in pedestrian
dynamics. In Cellular Automata, volume 2493 of
LNCS, pages 239–248. Springer.
Teknomo, K. (2009). Application of microscopic pedestrian
simulation model. Transp. Res., Part F, 9:15–27.
ActivationoftheFollowingModetoSimulateHeterogeneousPedestrianBehaviorinCrowdedEnvironment
183
