
Seven-day Analysis of Atrial Fibrillation and Circadian Rhythms
Rebeca Goya-Esteban
1
, Frida Sandberg
2
,
´
Oscar Barquero-P
´
erez
1
, Arcadio Garc
´
ıa-Alberola
3
,
Leif S
¨
ornmo
2
and Jos
´
e Luis Rojo-
´
Alvarez
1
1
Department of Signal Theory and Communications, Rey Juan Carlos University, Madrid, Spain
2
Department of Electrical and Information Technology and Center for Integrative Electrocardiology (CIEL),
Lund University, Lund, Sweden
3
Arrhythmia Unit, Hospital Universitario Virgen de la Arrixaca de Murcia, Murcia, Spain
Keywords:
Atrial Fibrillation, Morphology, Principal Component Analysis, Sample Entropy, Circadianity.
Abstract:
In the present work, f-wave morphology is characterized by principal component analysis and a novel temporal
parameter defined by the cumulative normalized variance of the 3 largest principal components (r
3
). The 7-
day behavior of persistent atrial fibrillation (AF) was studied in 9 patients using r
3
, AF frequency, and sample
entropy (SampEn). Detection of circadian rhythms depended on the parameter considered: rhythms were
found in 6 (r
3
, SampEn) and 5 (AF frequency) patients, but interestingly not always in the same patients. Two
patients had significant circadian rhythm in all parameters. When a circadian rhythm was significantly present
in 7 days, it was usually only significantly present in some of the 24-h segments. It is concluded that detailed
AF characterization can be achieved with complementary parameters.
1 INTRODUCTION
Atrial activity during atrial fibrillation (AF) has often
been studied as a random phenomenon, nonetheless,
several studies have demonstrated the presence of or-
ganization during AF, indicating that a certain degree
of local organization exists, likely caused by deter-
ministic mechanisms of activation (Bollmann et al.,
2006). Given the heterogeneity of the underlying AF
pathophysiology and its different symptomatic impact
on each patient, different treatment strategies should
be adopted. The efficacy of treatment may be deter-
mined by accurate characterization of each particular
case.
Several studies have investigated AF frequency,
estimated from the surface ECG, as a marker of AF
organization. However, no single parameter is likely
to be sufficient for characterizing such a complex
arrhythmia as AF, but a set of parameters is rather
needed. Parameters reflecting irregularity (Alcar
´
az
and Rieta, 2008) and changes in f-wave morphol-
ogy (Stridh et al., 2009) may be complementary in
conveying information on AF organization. Virtually
all studies on AF organization have been conducted
on short recordings, whereas the characterization of
AF evolution over several days remains to be addres-
sed. Such information will help to understand patho-
physiological aspects of AF as well as to distinguish
between different types of AF.
Despite the fact that the assessment of circadian
rhythms in 24-h recordings has limited statistical sig-
nificance, circadian variations in AF frequency have
nevertheless been investigated using such record-
ings (Bollmann et al., 2000; Sandberg et al., 2010).
Long-term monitoring makes it possible to determine
more accurately the existence of circadian rhythms
than when using 24-h.
The aim of this work is threefold. First, time do-
main characterization of f-wave morphology, based
on principal component analysis (PCA), is proposed.
This parameter, denoted r
3
, is defined as the percent-
age of the cumulative normalized variance of the 3
largest principal components (PCs). Second, 7-day
evolution of AF frequency, SampEn, and r
3
is stud-
ied for the first time, previously only studied in 24-h
recordings or shorter. Finally, the reproducibility of
circadian patterns is studied for the purpose of com-
paring detection performance when analyzing 24-h
and 7-day data.
20
Goya-Esteban R., Sandberg F., Barquero-Pérez Ó., Garcia-Alberola A., Sörnmo L. and Luis Rojo-Álvarez J..
Seven-day Analysis of Atrial Fibrillation and Circadian Rhythms.
DOI: 10.5220/0004191400200024
In Proceedings of the International Conference on Bio-inspired Systems and Signal Processing (BIOSIGNALS-2013), pages 20-24
ISBN: 978-989-8565-36-5
Copyright
c
2013 SCITEPRESS (Science and Technology Publications, Lda.)

2 METHODS
2.1 Dataset and Preprocessing
Our database consisted of 14 7-day Holter record-
ings from patients with persistent AF. The orthogo-
nal X, Y, Z leads were acquired using a commercially
available device (Lifecard CF
T M
, Del Mar Reynolds).
Since QRST cancellation of the entire recordings
was not possible due to computational restrictions, the
first 5 min of each hour throughout the 7 days were
analyzed. The residual ECG was obtained using spa-
tiotemporal QRST cancellation. Furthermore, QRST-
related residuals were replaced by spline interpolation
if they exceeded ±6 times the standard deviation of
the residual.
Despite preprocessing, 5 recordings still had sig-
nificant QRS-related residuals and had to be excluded
since f-waves characterization could not be done.
Thus, the remaining dataset consisted of 9 recordings.
2.2 Morphology, Frequency and
Irregularity Parameters
The morphology of f-waves is characterized in indi-
vidual leads using PCA information (Jackson, 1980).
For this purpose, the parameter r
3
is introduced,
which exploits the short-term temporal redundancy in
the AF signal. It is obtained by first dividing each 5-
min segment into 1-s segments, and then computing
the sample covariance matrix from the resulting 300
segments. The resulting eigenvectors are arranged in
order of decreasing eigenvalues λ
i
. The variance con-
centrated to the 3 largest eigenvalues can be assessed
by the percentage of their cumulative normalized vari-
ance r
3
, i.e.,
r
3
=
∑
3
i=1
λ
i
∑
300
i=1
λ
i
· 100. (1)
This parameter is computed for each 5-min segment
throughout the 7-day recordings, and thus provides an
hourly characterization. Higher values of r
3
reflect
more regular and organized f-wave morphology since
the 3 first PCs explain most of the variance, and vice
versa. An advantage with r
3
is that no assumption is
required on an underlying signal model.
The AF frequency, which reflects the repetition
rate of the f-waves, plays a central role when analyz-
ing atrial activity. Several studies have demonstrated
a significant correlation between AF frequency and
the likelihood of spontaneous or drug-induced AF
termination (Mainardi et al., 2009; Bollmann et al.,
2006; Nilsson et al., 2006). The AF frequency trend
is here estimated by short-term Fourier analysis of the
residual signal. In order to reduce the influence of
intermittent noise, HMM-based tracking is employed
which yields an optimal trend from a sequence of ob-
served AF frequencies (Sandberg et al., 2008). AF
frequency is determined every 5 min to be compara-
ble with the other parameters.
SampEn holds certain properties which are suit-
able for the study of physiological signals (Richman
and Moorman, 2000). SampEn is the negative natural
logarithm of the conditional probability that two se-
quences which are similar for m points remain similar
for m + 1 points. In order to compute SampEn, the
embedded dimension m, i.e., the length of the vec-
tors to be compared, and the noise filter threshold r
need to be specified. For the AF signal different val-
ues for m and r were estudied in (Alcar
´
az and Rieta,
2008), accordingly SampEn is computed for every 5-
min segment, using m = 2 and r = 0.2 · the standard
deviation of the signal segment.
2.3 Circadianity Analysis
Circadian rhythms are assessed in 7-day recordings
using hourly values of the parameters under study.
The data sequence can be represented by a temporal
regression model known as the cosinor model (Bing-
ham et al., 1982), defined by
y
n
= M + A
0
cos(2π f
0
t
n
+ ϕ
0
) + e
n
, (2)
where M denotes the rhythm-adjusted mesor (i.e.,
mean value), A
0
the fitted cosine amplitude, f
0
the
fundamental frequency (set to 24 hours) and ϕ
0
the
acrophase (i.e., the lag from a defined reference time
point to the crest time in the cosine curve fitted to
the data). The random variable e
n
corresponds to the
residuals, this is, the difference between the observed
sample y
n
and the value provided by the estimated re-
gression model ˆy
n
. The least squares method is ap-
plied to determine the regression parameters.
The significance of a circadian rhythm is de-
termined here by means of a bootstrap hypothesis
test (Efron and Tibshirani, 1993). The circadian
model ( ˆy
n
) is compared against a model consisting
of the mesor component (M). The mean square er-
ror between the signal and each model (E
ˆy
n
, E
M
) is
computed to obtain the difference between the resid-
uals of the two models (∆E = E
M
− E
ˆy
n
). The sta-
tistical relevance of ˆy
n
versus M is assessed using a
paired bootstrap hypothesis test. B random resam-
plings with replacement of residuals are made to ob-
tain ∆E for each resampling (B = 2500). A suitable
statistical hypothesis test contrasts the null hypothesis
that the models have the same unexplained variance
(∆E = 0) against the alternative hypothesis that both
Seven-dayAnalysisofAtrialFibrillationandCircadianRhythms
21
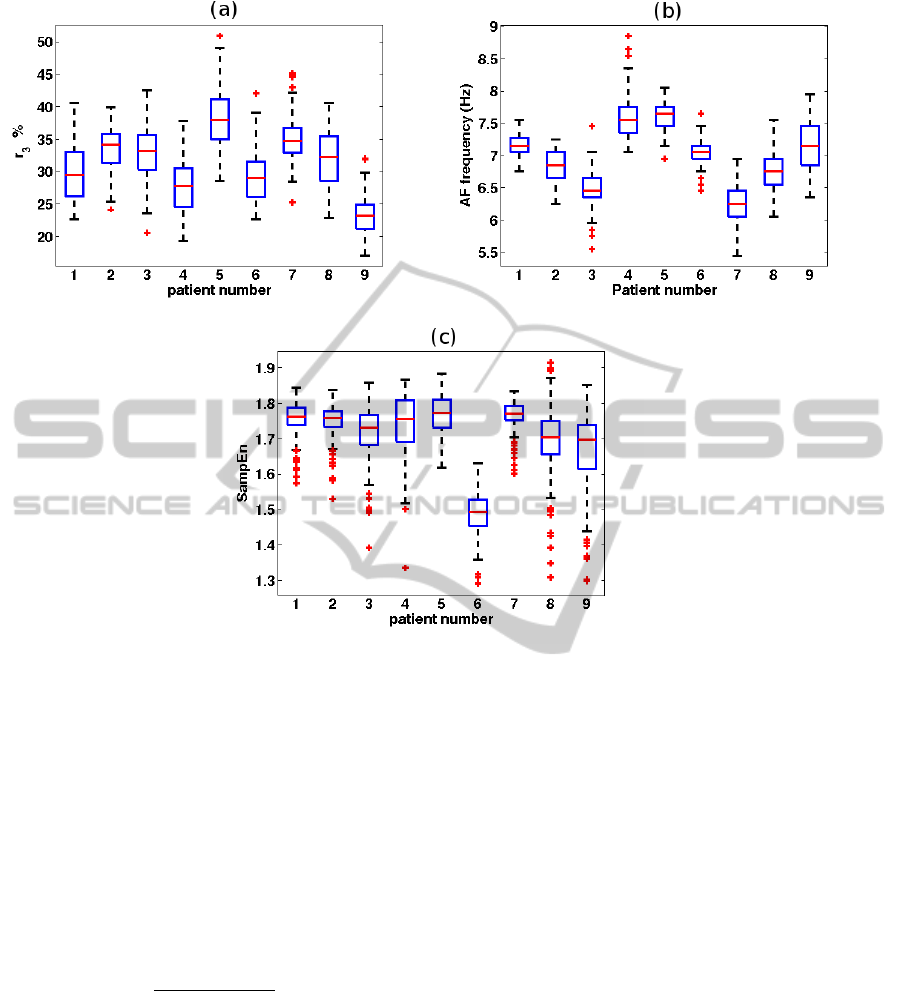
Figure 1: Boxplots for (a) r
3
, (b) AF frequency, and (c) SampEn for each of the patients. For each box, the central mark is
the median, the edges of the box are the 25th (q1) and 75th (q3) percentiles, the whiskers extend to the most extreme data
points (excluding outliers), and outliers (points larger than q3 + 1.5(q3 − q1) or smaller than q1 − 1.5(q3 − q1)) are plotted
individually.
models have different unexplained variance (∆E ±0).
The paired bootstrap hypothesis test determines that
the circadian model is significant when at least 97.5%
of the B values, for the estimated probability density
function of ∆E, are on the right-hand side of 0.
The goodness of the model fit is quantified as the
percentage of the signal variance explained by the cir-
cadian model with respect to the mesor,
P
m
=
(
1 −
∑
N
n=1
(y
n
− ˆy
n
)
2
∑
N
n=1
(y
n
− M)
2
)
· 100. (3)
The reproducibility of the circadian patterns is
also studied in order to determine whether signif-
icant circadian rhythms can be consistently deter-
mined when analyzing 7-day and 24-h recordings.
3 RESULTS
3.1 AF Signal Characterization
Figure 1 shows boxplots of r
3
, AF frequency, and
SampEn for the 9 patients. There was a considerable
inter-patient variability in r
3
, and AF frequency, while
this variability was less pronounced in SampEn.
Figure 2 displays four 4-s AF signals from patient
#3, comparing high and low r
3
with high and low AF
frequency. It can be seen that in situations when AF
frequencies were very similar, e.g., 6.8 and 6.9 Hz, the
f-wave morphology was quite different when quanti-
fied by r
3
.
3.2 Circadian Rhythms
Significant circadian rhythm was found in 6 patients
for r
3
and SampEn, and in 5 patients for AF fre-
quency. Table 1 shows P
m
and the hour M
h
at which
the maximum of the circadian model occurs, for each
BIOSIGNALS2013-InternationalConferenceonBio-inspiredSystemsandSignalProcessing
22
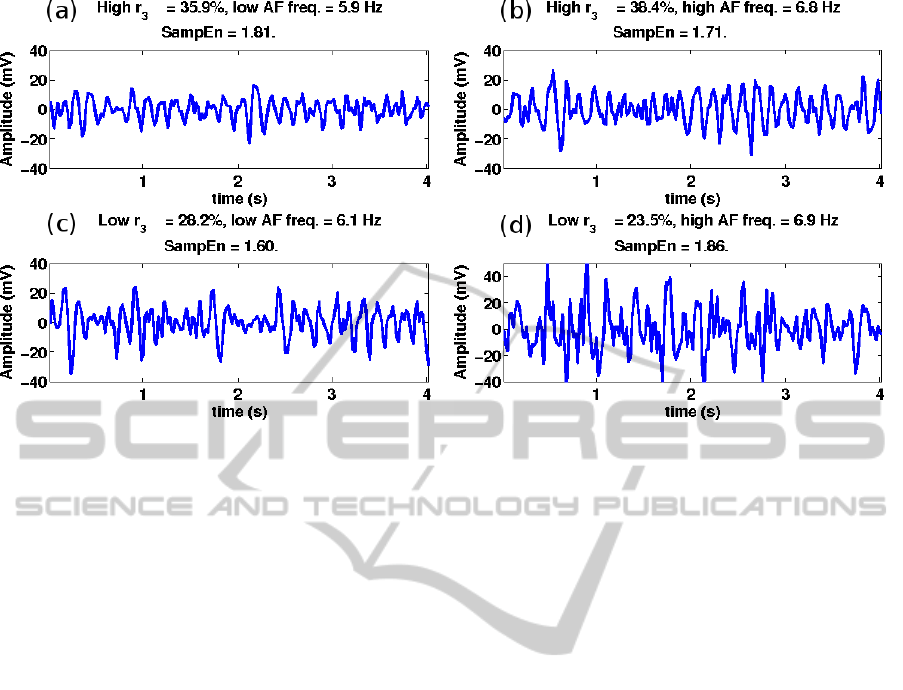
Figure 2: Patient #3. AF frequency versus r
3
. (a) High r
3
and low AF frequency, (b) high r
3
and high AF frequency, (c) low
r
3
and low AF frequency, (d) low r
3
and high AF frequency, corresponding to (a) 5 pm, (b) 11 pm, (c) 8 am, and (d) 6 am.
patient and each parameter. According to the circa-
dian models, the highest r
3
was found in the morning
for 3 patients and in the afternoon for the other 3 pa-
tients. The highest AF frequency was found in the
morning for 3 patients and at night for 2 patients. Re-
garding SampEn, the highest irregularity was found
in early morning or at late night.
Figure 3 shows the 7-day trend for patient #1, with
r
3
and SampEn showing significant circadian varia-
tion, whereas AF frequency does not.
Circadian rhythms, found to be significant for
the 7-day recordings, were usually significant only
in some of the 7 24-h segments. The higher the
value of P
m
of the circadian rhythm for the 7-day sig-
nal, the more 24-h segments showed significant cir-
cadian rhythm. For example, patient #6 showed sig-
nificant circadian variation in all 24-h segments for r
3
(P
m
= 54.5%), in three 24-h segments for SampEn
(P
m
= 27.5%), and in one 24-h segment for AF fre-
quency (P
m
= 14.1%).
4 CONCLUSIONS
The analysis of Holter recordings is typically synony-
mous to the analysis of AF signals corrupted by noise
due to muscular activity or insufficient QRST can-
cellation. Of the studied parameters, AF frequency
is probably the one to suffer the most from noise.
SampEn is sensitive to high amplitude noise, since
the noise threshold r is affected when outliers fall
within a signal segment. Since r
3
is obtained from
the 3 largest principal components the influence of
noise is largely eliminated, thereby making character-
ization of f-wave morphology particularly well-suited
for analysis of Holter recordings. The parameters r
1
and r
2
were also considered but there were not large
differences between the three approaches, r
3
was fi-
nally selected since the transition between successive
segments was smoother for this choice.
The time evolution over 7 days was assessed for
r
3
, SampEn, and AF frequency. The results showed
that these parameters reflect complementary aspects
of the AF signal since there was not always a cor-
relation between their values. Higher AF frequency
or higher irregularity parameters were frequently not
followed by lower r
3
. A more thorough investiga-
tion of r
3
will be done in a future study. The results
reveal that these parameters vary considerable over
time. The patterns differed from patient to patient,
i.e., the highest values of a given parameter were not
always found at the same time of the day for all pa-
tients. Such long-term information could be poten-
tially useful in AF studies since short-term evaluation
of parameters characterizing AF is prone to bias.
Significant circadian rhythms were found in most
patients and reflected by most parameters—this is
an additional piece of information about chronic
AF mechanisms being related to the physiological
equilibrium of patients and the long-term regulation
mechanisms of the cardiovascular system. The aim of
the circadian model is to extrat the daily component
of the AF signal, rather than to be the best regression
model in terms of lowest prediction error. A study on
reproducibility of circadian rhythms verified that dif-
Seven-dayAnalysisofAtrialFibrillationandCircadianRhythms
23
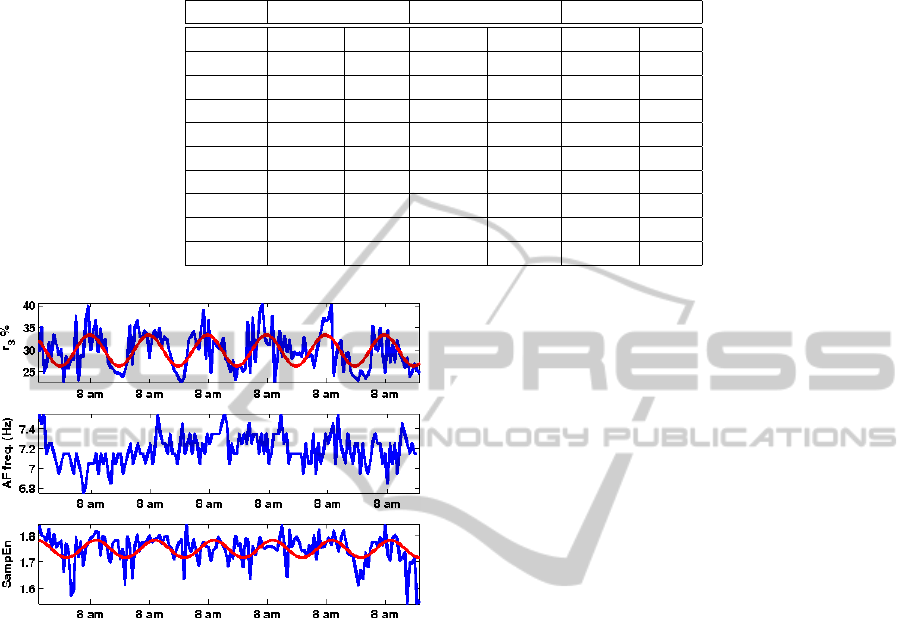
Table 1: Circadian rhythm. Percentage of the signal variance explained by the circadian model with respect to the mesor (P
m
)
and the hour of the maximum of the circadian model (M
h
). “–” denotes absence of significant circadian variation.
Patient r
3
AF f req. SampEn
P
m
(%) M
h
P
m
(%) M
h
P
m
(%) M
h
1 33.2 7 am – – 16.9 9 am
2 11.5 9 am 38.5 8 am 10.6 7 am
3 21.0 3 pm 22.2 7 am – –
4 11.1 4 pm – – 10.7 3 am
5 – – 11.3 10 pm 8.6 6 am
6 54.5 8 am 14.1 12 pm 27 .5 7 am
7 – – – – – –
8 19.8 4 pm 14.2 7 am – –
9 – – – – 11.3 7 am
Figure 3: Circadian patterns. 7-day trends for patient #1,
plotted together with the fitted circadian model (solid red
line).
ferent results are obtained when using 24-h and 7-day
recordings, the latter producing more accurate detec-
tion of circadianity.
ACKNOWLEDGEMENTS
This work has been partially supported by Research
Projects from Medtronic Ib
´
erica and from the Spanish
Goverment TEC2010-19263. Oscar Barquero-P
´
erez
is supported by FPU grant AP2009-1726.
REFERENCES
Alcar
´
az, R. and Rieta, J. J. (2008). A non-invasive method
to predict electrical cardioversion outcome of per-
sistent atrial fibrillation. Med Biol Eng Comput,
46(7):625–635.
Bingham, C., Arbogast, B., Guillaume, G., Lee, J., and Hal-
berg, F. (1982). Inferential statistical methods for es-
timating and comparing cosinor parameters. Chrono-
biologia, 9(4):397–439.
Bollmann, A., Husser, D., Mainardi, L., Lombardi, F., Lan-
gley, P., Murray, A., Rieta, J. J., Millet, J., Olsson,
S. B., Stridh, M., and S
¨
ornmo, L. (2006). Analysis of
surface electrocardiograms in atrial fibrillation: tech-
niques, research, and clinical applications. Europace,
8(11):911–26.
Bollmann, A., Sonne, K., Esperer, H., Toepffer, I., and
Klein, H. (2000). Circadian variations in atrial fibril-
latory frequency in persistent human atrial fibrillation.
PACE, 23(11):1867–71.
Efron, B. and Tibshirani, R. (1993). An Introduction to the
Bootstrap. Chapman & Hall.
Jackson, J. E. (1980). Principal components and factor anal-
ysis: Part I – principal components. JQT, 12(4):201–
213.
Mainardi, L., S
¨
ornmo, L., and Cerutti, S. (2009). Under-
standing Atrial Fibrillation: The Signal Processing
Contribution. Morgan & Claypool.
Nilsson, F., Stridh, M., Bollmann, A., and S
¨
ornmo, L.
(2006). Predicting spontaneous termination of atrial
fibrillation using the surface ECG. Med Eng & Phys,
28(8):802–808.
Richman, J. S. and Moorman, J. R. (2000). Physiolog-
ical time-series analysis using approximate entropy
and sample entropy. Am J Physiol Heart Cir Physiol,
278(6):2039–49.
Sandberg, F., Bollmann, A., Husser, D., Stridh, M., and
S
¨
ornmo, L. (2010). Circadian variation in dominant
atrial fibrillation frequency in persistent atrial fibrilla-
tion. Physiol Meas, 31(4):531–542.
Sandberg, F., Stridh, M., and S
¨
ornmo, L. (2008). Frequency
tracking of atrial fibrillation using hidden Markov
models. IEEE Trans Biomed Eng, 55(2):502–511.
Stridh, M., Husser, D., Bollmann, A., and S
¨
ornmo, L.
(2009). Waveform characterization of atrial fibrilla-
tion using phase information. IEEE Trans Biomed
Eng, 56(5):1081–1089.
BIOSIGNALS2013-InternationalConferenceonBio-inspiredSystemsandSignalProcessing
24
