
Modeling the Design of Value in Service-oriented Business Models
Arash Golnam
1
, Paavo Ritala
2
, Vijay Viswanathan
1
, Valerian Hanser
1
and Alain Wegmann
1
1
Ecole Polytechnique Fédérale de Lausanne, School of Computer and Communication, Sciences (I&C),
Systemic Modeling Laboratory (LAMS), Station 14, CH-1015 Lausanne, Switzerland
2
Lappeenranta University of Technology, School of Business
PO Box 20, FI-53851 Lappeenranta, Finland
{arash.golnam, vijay.viswanathan, valerian.hanser, alain.wegmann}@epfl.ch, ritala@lut.fi
Keywords: Amazon.com, Modeling, Service-Oriented Business Models, Value Capture, Value Creation.
Abstract: Many firms redesign their business models to be service-oriented in light of the increasingly central role that
services play in their business models. Two fundamental questions should be addressed in designing
service-oriented business models: how is value created for and with the customers by the service provider?
and, how is the value captured by the service provider?. The first question deals with “value creation” while
the second addresses “value capture” in the “service value equation”. A service-oriented business model that
addresses these two questions can sustain the viability and competitiveness of the firm as a service provider.
The extant research mainly focuses on the service design from the value creation perspective. Thereby, there
has been little discussion about service providers’ value capture and its trade off with value created for and
with service customers. In this paper, adapting a holistic perspective, we introduce a modeling framework
that can assist in understanding, analysis and design of value (i.e. value creation and capture and their
interplay) in service-oriented business models. Our modeling framework is grounded in insights and
conceptualizations of the extant theories, constructs and frameworks on value creation and capture in
business and service systems. We illustrate the applicability of our framework by conducting a descriptive
case study of the value creation and capture in Amazon service system in the period between 1997 and
2001.
1 INTRODUCTION
A business model is defined as a generic platform
between strategy and practice, describing the design
or architecture of the value creation, delivery, and
capture mechanisms the firm employs (e.g. Teece,
2010). Due to the increasing and even focal role of
services in their businesses and strategy, many firms
have been forced to completely re-think their
business models (Teece, 2010). In fact, this recent
tendency of business model redesign has led to the
emergence of “service-oriented business models”.
This development can be explained from the
perspective of “service-dominant (S-D) logic”
(Vargo and Lusch, 2004 and 2008), that attempts to
view and extend the concept of service beyond a
“particular” kind of intangible good as traditionally
viewed in the “goods-dominant (G-D) logic”. S-D
perspective conceptualizes a firm’s offerings not as
an output, but as an input for the customer's value-
creation process.
Central to the service-oriented business models
are the concepts of value creation and capture. In
order to understand how a service-oriented business
model remains viable and competitive, two
fundamental questions should be addressed: “how is
value created for and with the customers by the
service provider?” and, “how is the value captured
by the service provider” (for discussion, see e.g.
Grönroos and Ravald, 2011; Bowman and
Ambrosini, 2011; Pitelis, 2009; Ritala et al., 2011).
In the search for understanding such questions, the
extant research has developed value modeling
frameworks such as (Gordijn and Akkermans, 2003;
Weigand et al. 2009; Pijpers and Gordijn, 2007; Yu,
1997; Weigand, 2009; Osterwalder and Pigneur,
2010) that provide conceptual tools to support the
design of service offerings. However, such tools and
framework mainly address the service design from
the service customers’ perspective and do not
sufficiently address suppliers’ value capture in the
“service value equation”. The same gap can be
broadly identified in the service literature in general,
81
Golnam A., Ritala P., Viswanathan V., Hanser V. and Wegmann A.
Modeling the Design of Value in Service-oriented Business Models.
DOI: 10.5220/0004461400810093
In Proceedings of the Second International Symposium on Business Modeling and Software Design (BMSD 2012), pages 81-93
ISBN: 978-989-8565-26-6
Copyright
c
2012 by SCITEPRESS – Science and Technology Publications, Lda. All rights reserved

where value creation and co-creation issues have
been emphasized over value capture. In addition, the
interplay between value creation for and with
customers and value capture by the suppliers has not
been explicitly investigated in the design and
analysis of service offering in service-oriented
business models.
In this study, we propose a holistic approach that
takes into account both value creation (for and with
customers) and value capture (by service providers)
in order to fully understand and model the new logic
of service provisioning process in service-oriented
business models. To this end, our research aims to
provide a modeling framework that can assist in
understanding, analysis and design of value (i.e.
value creation and capture and their interplay) in
service-oriented business models. We illustrate the
applicability of our framework by means of a
descriptive case study of the value creation and
capture in Amazon.com service system. In a
descriptive case study, the researcher pursues to
describe a phenomenon of interest that occurs within
the data. This type of research begins with an a
priori theoretical perspective. Then, a pattern
matching is conducted to describe the phenomenon
in the data in a rigorous way (Yin, 2009). More
specifically, the descriptive case we conduct can be
labelled as an instrumental case study (Stake, 1995),
where we aim to illustrate the applicability of the
suggested framework. The case study focuses on one
of the services offered by Amazon.com, more
particularly; the sales of used and new books in
Amazon.com over the period 1997-2001.
We have used data triangulation in order to
gather rich evidence on Amazon.com, various
aspects of its business model and its service
offerings over time. We began the data gathering
process in January 2009. Since then, a variety of
secondary data sources have been accessed,
analyzed and synthesized in order to gain an
accurate understanding of diverse facets of
Amazon.com’s service offerings and implementation
in Amazon Marketplace. Such sources include:
• Amazon.com annual reports between 1997–
2010 (Amazon, 2011a); presentations and
news releases (Amazon, 2011b).
• Books published on Amazon.com such as;
Afuah and Tucci, 2002; Spector, 2002;
Kalpanik and Zheng, 2011), etc.
• Harvard Business Review (HBR) cases
published between 2000 and 2010 such as
(Applegate 2002 and 2008)
• Journal articles such as (Heck and Vervest,
2007), etc.
There are several advantages in using secondary
sources. For instance, in Ambrosini et al. (2010)
suggest that teaching cases are an unexploited and
rich source of data that should be used when primary
data is not available. They also suggested using
reputable sources for teaching cases (we mainly use
Harvard Business Review cases here) and combine it
with other sources to attain data triangulation.
Analyzing multiple sources of objective and
subjective evidence has enabled us to combine
evidence in a way that gives an overall
understanding of the research topic.
The paper is structured as follows. In Section 2
we present a conceptual model that summarizes the
theoretical insights and perspectives on value
creation and capture. In Section 3, after a brief
introduction to Amazon.com we represent the design
of value Amazon.com’s business model applying
our value modeling framework. Section 4 includes
the related work and in section 5, we present the
conclusion and the future work.
2 THE CONCEPTUAL MODEL
In this section, we develop a theoretical framework
examining value creation and capture in service
systems. The theoretical insights are presented in
form of a conceptual model illustrated in Figure 1.
In the following, we first discuss the tenets of
customer value creation and then we proceed to
examine how the service provider eventually
captures value.
2.1 Customer Value Creation
Conceptualizations
Creating value for the customers is the fundamental
reason why any company exists and thrives in
competition (e.g. Bowman and Ambrosini, 2000),
and customer value creation is most pronounced in
service-oriented companies (Chesbrough and
Spohrer, 2006). Customer value creation is a
process, where the service provider delivers the
customer a service offering that creates value when
the customer uses the service, i.e. the use value (see
e.g. Grönroos and Ravald, 2011). In this setting, the
service provider (and its value network) is
responsible in producing the service, and actual
customer value (co-)creation takes place when
customer receives/uses the service (ibid.). The main
interface where the service provider can affect
customer value creation (e.g. time saving
convenience) is through a concrete service offering
Second International Symposium on Business Modeling and Software Design
82
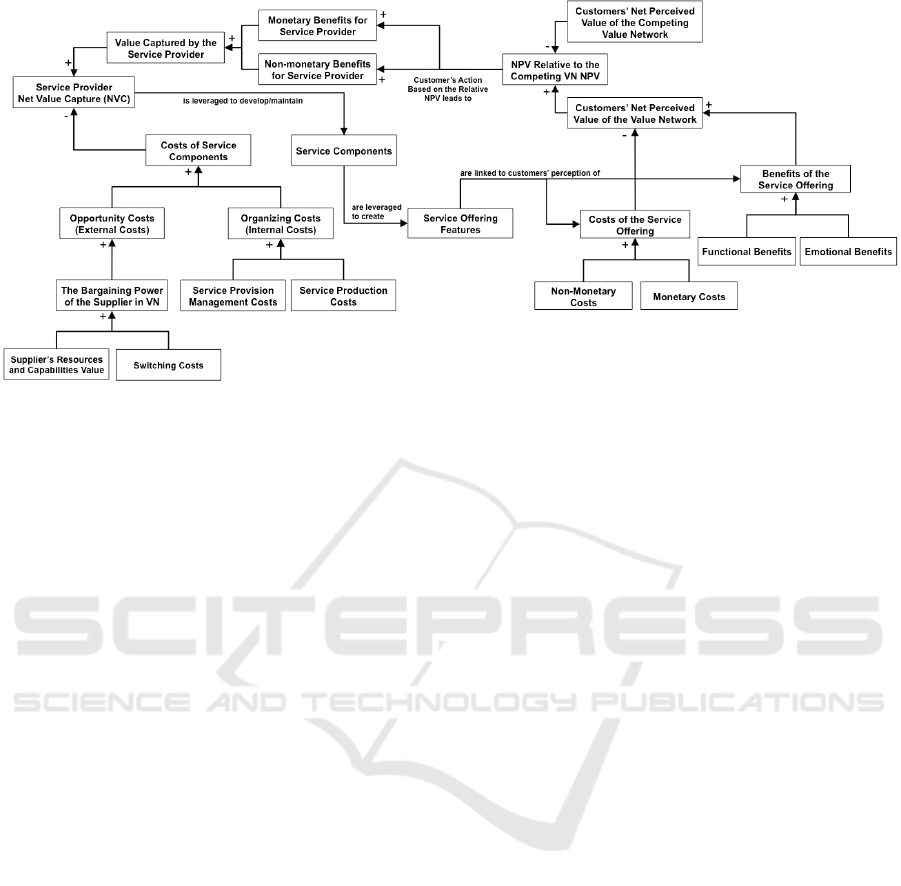
Figure 1: The conceptual model.
(e.g. transportation, entertainment). In order to
provide any type service offering, the provider has a
set of service components that are leveraged to
create the service offering (Golnam et al., 2012).
These components are created by the service
provider and its value network, and they reflect the
underlying resources and capabilities that are put to
use to provide a certain set of service components.
Thus, service components can be seen as a way of
organizing the service, while service offering
features are those that are linked to the actual
customer’s perceptions of service value.
2.1.1 Net Perceived Value (NPV)
In understanding customer value creation from the
customer perspective, the net perceived value has
been seen as a key concept, which is related to the
overall benefits minus the costs of receiving the
service (e.g. Kotler, 2000; Day, 1990; Huber, 2001).
A related concept is the consumer surplus, in
layman’s terms often expressed as “value for
money”, that Bowman and Ambrosini (2000) define
more precisely as the difference between the
monetary amount the consumer is willing to pay and
the actual price paid. It is important to recognize that
consumer surplus or net perceived value is assessed
ex-ante, i.e. prior to the transaction. This is precisely
the reason why benefits and costs are assessed as
“perceived”; this is in contrast to complementary
concepts such as consumer satisfaction, which are
ex-post. For instance, if a service offering consists of
entertainment services, the customer perceives a
certain value for being entertained, while costs of
receiving
it are linked to e.g. to time spent to going
to the venue, as well as the monetary costs involved.
Thus, in any situation where a transaction
actually occurs it is expected that net perceived
value will be positive. That is, the customer is
willing to pay an amount in excess of the costs
(including monetary and non-monetary costs), and
thus made the purchase, pocketing the “surplus”.
The larger this surplus is the more eager the
consumer will be to make the purchase; the converse
is also true, the smaller this surplus becomes, the
less eager the consumer is in willing to engage in the
transaction. The borderline situation is that of the
monopoly supplier, where the firm is able to charge
exactly the maximum amount the consumer is
willing to pay, thus netting zero surplus for the
consumer. Therefore net perceived value can only
increase through one of the following situations: (1)
an increase in perceived benefits while maintaining
perceived costs unchanged; (2) a decrease in
perceived costs while maintaining perceived benefits
unchanged; or (3) a simultaneous increase in
perceived benefits with a decrease in perceived
costs.
2.1.2 Customers’ Perception of Service
Offering’s Benefits
Customer’s perceptions of the benefits are related to
the use value of the service for the customer (e.g.
Grönroos and Ravald, 2011). Use value covers the
specific characteristics of the product or service
perceived by the customer as potentially serving
their needs. Bowman and Ambrosini (2000)
emphasize the subjective nature of use value - it
maps uniquely to each customer. Use value itself can
Modeling the Design of Value in Service-oriented Business Models
83

be further categorized into two sub-components,
namely functional and emotional benefits.
Functional benefits represent the tangible
benefits of the product or service that fulfill the
primary needs the consumer had in seeking the
solution, and Grönroos (2000) calls this the “core
value” of the service. Kotler’s (2000) pinpoints that
these benefits – although functional – are expressed
in customer terms, further reinforcing their
subjective nature. Furthermore, as discussed by
Amabile (1996), customers make their subjective
assessment of appropriateness of the functional
benefit of the service. In the majority of cases, where
the product and context are well understood and
established, the process is straightforward. However,
in cases of innovation and disruptive products, or
change in social and cultural context, buyers might
not be able to properly make their assessment,
resulting in a net negative impact on functional
benefits.
Emotional benefits are made up of the intangible
extras that the firm is able to offer that go above and
beyond meeting primary needs; the analogous
terminology of Grönroos (2000) is added value.
Kotler (2000) highlights various specific strands of
these types of benefits, such as personal interaction
value and image value. Groth (1994) also suggests
that customers buy products and services for other
than just “pure [i.e. functional] utilitarian reasons”.
He provides the example of consumers not assigning
significant value to near-perfect replications of
famous art work as a case-in-point. Groth terms this
kind of utility, serving the psychic needs of people,
as an exclusive value premium (EVP).
2.1.3 Customers’ Perceptions of Service
Offering’s Costs
In addition to various types of benefits, there are
always costs incurring to the customers of receiving
a service. The extant literature details the many
types of such costs. The most obvious is the actual
monetary cost (i.e. exchange value, Bowman and
Ambrosini., 2000) In addition, it is also important to
take into account the non-monetary costs. Regarding
these, Kotler (2000) identifies three other varieties:
time, energy, and psychic costs. Time cost is made
up by the sum of durations the consumer has to
spend in acquiring and acquainting oneself with the
product or service. Energy cost is the net of energy
that needs to be expended by the customer. Finally
psychic costs form a complement to psychic utility -
the cognitive stress experienced by the customer in
purchasing and using the product.
2.1.4 Competing Value Networks and the
Relative Net Perceived Value
In addition to the value created by the focal firm and
its value network, the net perceived value created by
competing value networks’ offerings should also be
taken into account. In analyzing this, we refer to
relative net perceived value, which is the net
perceived value created by the focal firm’s offering
in relation to the competing offerings. The higher the
relative net perceived value is, the higher is the
competitiveness of the focal firm in the eyes of the
customers.
2.2 Service Provider Value Capture
Conceptualizations
Value capture (also termed as value appropriation or
retention in some sources) by the focal firm is an
issue of much interest in management research and
even more so in organizations themselves. Value
capture is related to the actualized profit-making of a
certain party. Regarding this, an in-depth discussion
is provided by Bowman and Ambrosini. (2000)
where they address the importance of analytical
distinction between value creation and capture.
Lepak et al. (2007) also makes a point of mentioning
that “the process of value creation is often confused
or confounded with the process of value capture or
value retention” and that the two should be
understood as distinct processes.
While there is certainly a strong correlation
between the two, it is essential to recognize the
former neither automatically nor fully translates into
the latter. Bowman and Ambrosini (2000) argue that
while value is created for the customer by
organizational members (i.e. the value network),
value capture has a different set of determinants,
including “perceived power relationships between
economic actors” (in other words, the bargaining
power between the firm and other entities, which is
explored at depth below). Lepak et al. (2007) and
Ritala and Hurmelinna-Laukkanen (2009) follow a
similar line of argumentation, suggesting that only
through the use of specific mechanisms is the creator
of value able to capture it, and that value creation
and capture may have sometimes have completely
different determinants and timeframes.
2.2.1 Net Captured Value (NCV)
In our model, value capture by the service provided
is determined by the benefits/compensation it can
extract from the markets. Furthermore, the net
Second International Symposium on Business Modeling and Software Design
84

captured value (NCV) of the service provider
consists of two factors: the benefits for the service
provider minus the costs of service components. It is
notable that this view is symmetrical to the customer
side where the net perceived value of the customer is
also dependent on benefits and costs. However, the
perspective is different in that the service provider is
the producer of the value (which incurs costs), and is
receiving various types of compensation for doing
that.
In our model, the benefit side of net value
capture is fundamentally affected by customer’s
action, which are based on the net value of the
service as perceived by the customer. Customer’s
action means the activities that result in generating
more or less tangible (e.g. annual subscription fee)
and intangible (e.g. referrals, word-of-mouth,
loyalty) contributions by the customer for the service
provider as a compensation for the net perceived
value of the service offering. From the service
provider’s perspective, these actions then lead to
actual monetary and non-monetary benefits, which
are discussed next, and are followed by the
discussion on the costs of providing the service.
2.2.2 Benefits for the Service Provider
Benefits from the service provider range from direct
monetary benefits (i.e. revenue streams) to non-
monetary benefits (e.g. customer loyalty, learning).
While monetary benefits for the service provider are
quite straightforward to interpret (e.g. bulk price,
subscription fees etc.), the non-monetary benefits are
more varied and ambiguous. This is partly because
non-monetary benefits consist of non-negotiable
value, which means that these types of compensation
cannot be clearly agreed on between the parties.
Ulaga (2003) proposes various types of non-
negotiable value coming from the customers, such as
commitment, trust, satisfaction, and loyalty. Of
course non-negotiable values in and of themselves
are not the ultimate end for profit-seeking firms.
Thus arises the discussion as to conversion
mechanisms for non-negotiable value into negotiable
forms. Allee (2008) offers significant insight in this
regard, offering two pathways that this conversion
can take: (a) direct conversion into monetary value,
and (b) an intermediate conversion into a negotiable
form that can be bartered. For instance, customer
loyalty involves major (non-monetary) benefits for
the service provider, which may also contribute to
the monetary benefits in both short and long term. In
fact, customer loyalty manifests itself in the form of
repeat purchases and is thus strongly linked with
superior profits: Reicheld (1994) found out that “a
small increase in customer retention leads to a major
increase in net present value profits.”
In addition, organizations learn by doing and
thus constantly evolve themselves (e.g. Nelson and
Winter, 1982). Thus, one type of non-monetary
benefit is also linked to the organizational learning
in the form of trial-and-error, customer feedback,
and therefore improved service offerings. This type
of value is highly non-negotiable, but it may
translate into improved service offerings and value
creation in the future.
In assessing the received benefits for the
provider, the offerings of competing value networks
should also be taken into account. Receiving both
monetary and non-monetary benefits are linked to
the customer’s net perceived value relative to the
competing offerings, since this determines the
compensation customers are willing to pay (here:
customer’s actions) and contribute to compensate a
particular service provider. Thus, issues concerning
competitive pressure and competitors’ offerings are
important determinants on the eventual value
capture. Regarding this, Lepak et al. (2007) explains
that a consequence of competition is increased
supply, which following fundamental economic
principles, results in decrease in exchange value (i.e.
price). We suggest competition also decreases the
possibility of achieving non-monetary benefits, since
the potential places of customer loyalty, learning and
other benefits may be decreased if competitors are
too attractive.
2.2.3 Costs of the Service Components
In addition to the monetary and non-monetary
benefits for the service provider, the costs of
providing the service components affects value
capture. We divide these costs into two broad
categories: the internal organizing costs, and the
external opportunity costs. Combined, these costs
decrease the value captured by the service provider.
First, the organizing costs refer to the internal
costs of the service provider related to producing the
service components. These costs are comprised of
the production costs, related to producing firm's
offerings, and the management costs, related to
administration, control, monitoring, and incentives
in organizing firm’s operations (e.g. Masten et al.,
1991; Blomqvist et al., 2002).
Second, in addition to the organizing costs, the
value network includes costs dependent on the
suppliers of various independent or jointly provided
service components. Following Brandenburger and
Modeling the Design of Value in Service-oriented Business Models
85

Stuart (1996), we refer to the costs of the service
components provided by the suppliers/partners in the
service provider value network as opportunity costs.
Opportunity cost is defined as the financial
compensation provided to the suppliers in exchange
to the service components they provide to the
offering, also taking into account the highest
alternative compensation that they could receive
from utilizing their resources in other context (ibid.).
Thus, the economic rationale of the suppliers’
involvement in the service system is tied to the
opportunity costs of the suppliers in providing
certain service components. Opportunity cost is a
widely-recognized economic concept that is a
measurement of the best alternative passed up on. In
this analytic context opportunity cost is the option a
supplier foregoes in choosing instead to deal with
the focal firm – and in effect this determines the
eventual cost burden that needs to be taken into
account when analyzing the costs related to
maintaining the external network of suppliers and
partners.
The key issue affecting the opportunity costs of
the suppliers is the relative bargaining power.
Indeed, Bowman and Ambrosini (2000) argue that a
firm’s ability to bargain with suppliers and buyers
from a position of strength positively influences the
value it is able to capture. Macdonald et al. (2004)
reinforce this line of argumentation, with a formal
model, stating that bargaining is what determines a
firm’s “precise” level of capture. Similarly
Brandenburger and Stuart (1996) state that it is
bargaining power between the “players” that
determines the division of value, and further that
bargaining power is what determines the price of
exchange between supplier and firm. Simply put, the
higher the bargaining power of a focal firm relative
to its suppliers and partners, the lower are the
eventual costs that it has to pay for suppliers to be
involved in the value network, and vice versa. There
are several issues that affect the relative bargaining
power of actors. At its most basic level bargaining
power is garnered by the relative value of resources
and capabilities of different actors, determined by
e.g. rarity, inimitability, and non-substitutability of
those (see e.g. Barney, 1991). The relative
bargaining power is also affected by the switching
costs of the supplier. Switching costs is a general
microeconomics concept identifying the redundant
investment (monetary and otherwise) that a supplier
needs to make when switching customers. Porter
(1980) highlights the proportional relationship
between high switching costs and high bargaining
power. This means that the higher are the switching
costs of suppliers, the higher is the relative
bargaining power of the focal firm.
2.3 Net Captured Value and Future
Value Creation
The cyclical feedback that net captured value offers
to future value creation activity remains a relatively
unexplored domain in the literature. However, we
suggest that this should be taken into account when
building a practically oriented model of value
creation and capture. As the most evident issue, the
actual monetary value and related resources (i.e. the
revenue streams coming to service provider) directly
help to maintain service providing activities in that
they provide funding for the on-going operations.
In addition, and more important in longer term,
is the development of value creation activities that
take place over time. Lepak et al. (2007) touches on
this point in his conclusion, suggesting that “a key
question is whether actors learn from past value
creation efforts in terms of the amount of value they
capture and use this knowledge for decisions
regarding future value creation activities.” In other
words organizational learning accumulated by value
capture over time can guide a firm to better structure
its value creation efforts.
Thus, we suggest that over time, there is a
feedback loop from value capture to developing and
maintaining service components. In terms of
development of service components, the feedback
loop is a result of organizational learning, leading to
improved capabilities and resources related to
service production. This can lead to either increasing
the customers’ value, or cost reduction on the
service provider’s side, or both. In general, these
improvements can be linked to Porter’s (1980)
generic strategies of cost leadership and the second
as differentiation.
3 MODELING THE DESIGN OF
VALUE IN AMAZON.COM
BUSINESS MODEL
In July 1995 Amazon.com began as an online
bookseller and by September 1995, the company
was selling $20,000 per week. After nearly three
years as an online bookseller, the company began
aggressively diversifying its offerings to include
other product categories beyond books, initially
adding music, videos, toys, and electronics (
Afuah
and Tucci, 2002)
. Such diversifications were followed
Second International Symposium on Business Modeling and Software Design
86

by the launch of several other stores such as home
improvement software and etc. In parallel with such
product diversifications, in October 1998,
Amazon.com expanded geographically by launching
its first international sites Amazon.co.uk and
Amazon.de through the acquisition of UK-based
online bookstore Bookpages and German-owned
Telebook (Applegate, 2002). The rationale behind
such diversifications was Amazon.com’s strategy of
“get big fast” to turn Amazon into the biggest mass
merchandiser or E-mall in the online world (Spector,
2002).
Following its evolution from an online bookseller
or to an e-tailer by diversifying its product offering
through new store openings, Amazon.com extended
its business model to become a third-party market
place by launching Amazon Marketplace in
November 2000. Marketplace idea was then
implemented in Amazon.com’s international
websites, UK and Germany in 2002, and France,
Canada and Japan in 2003.
In the case study analyzed in this paper, we focus
on the Amazon.com’s evolution from an online
bookseller to a third-party Marketplace in the online
bookselling segment. From a service perspective, we
model the value creation and capture in
Amazon.com’s transition from selling new books to
establishing a partnership with other booksellers to
sell used and new books. To this end, we develop a
value model representing the design of value
creation and capture in Amazon.com business model
circa 1997. In order to map our modeling framework
to the theoretical discussions in the previous section
and to gain a better understanding of the modeling
constructs and notations, we present the model in
three parts (i.e. customer value; customer value
creation; and provider value capture) and explain
each part step by step. Finally, we discuss the
rationale behind changes in the business model of
Amazon.com in 2001 in light of the theoretical
insights embodied in our modeling framework.
3.1 Modeling Customer Value in
Amazon.com’s Business Model
The first part of our modeling framework deals with
the service value attributes as perceived by
Amazon.com’s customers circa 1997. In Figure 2,
we have listed a number of value attributes to reflect
the perceptions of customers about the benefits and
costs of Amazon.com’s online book selling service.
In Section 2.1, we discussed that a customer assesses
a service based on its net perceived. The next step is
to understand the relative importance of value
Figure 2: Modeling customer value.
attributes in terms of their impact on the net
perceived value. As illustrated in Figure 2, we use
minuses and pluses to represent the nature of impact
(i.e. negative or positive) and its intensity (medium
or strong).
Information on customers’ perception and their
relative importance can be gathered through direct
interaction with customers or customer surveys.
Revealed preference methodologies (Carson et al.,
1996) can also be used to understand customer’s
needs and preferences based on their behavior. In
this paper, the information provided on the value
attributes the Amazon.com customers perceive and
their relative importance has been gathered through
the secondary sources outlined in Section 1.
As illustrated in Figure 2, different customers
can perceive different value attributes of the service
offered by the service provider. Similarly a value
attribute can have different impacts on different
customers. For instance as shown in Figure 2, the
value attributes “Ease of payment” and “Book
delivery” do not have any impact on Customer X’s
perception of Amazon.com’s service offering. By
the same token, “Submitting reviews” and
“Interaction and socialization” do not influence
Customer Y’s perception of service value.
Moreover, “Book price” and the “Reliability of
service” are more important for Customer Y.
Whereas, Customer X cares more about value
attributes such as (availability of) “Out-of-print
books” and “Knowing about similar books”.
Finally, as already discussed in Section 2, it is
important to identify the strategic positioning of the
Modeling the Design of Value in Service-oriented Business Models
87
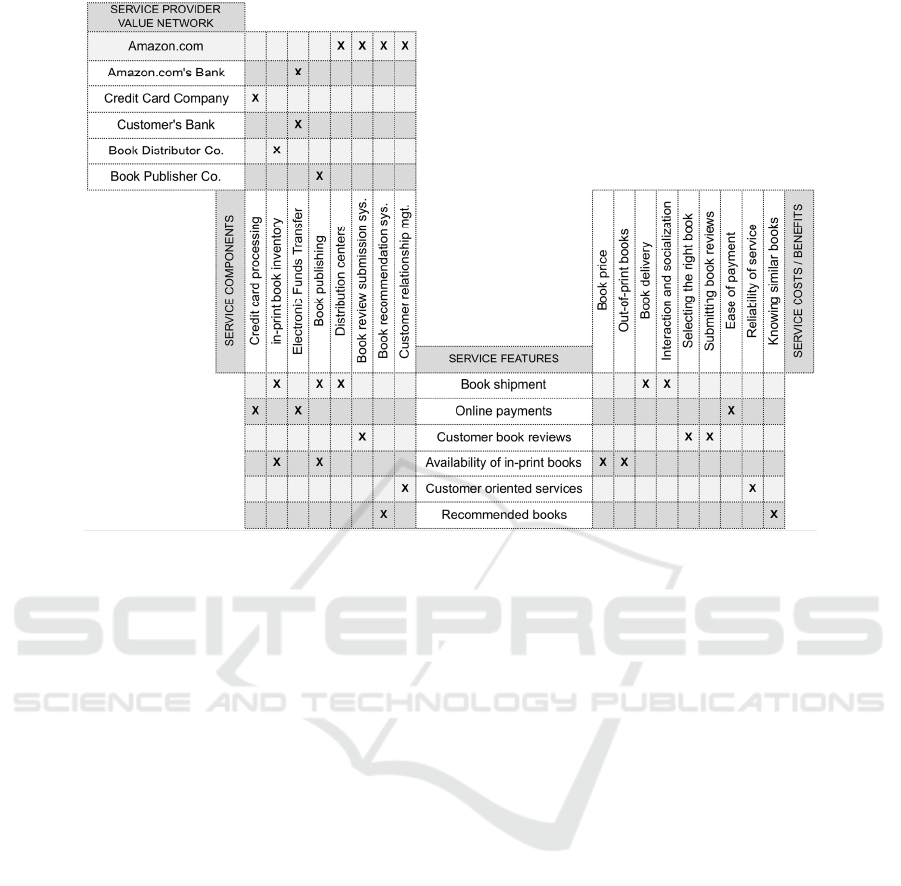
Figure 3: Modeling customer value creation.
service provider by understanding where the
provider is standing relative to the competing value
networks in terms of the value attributes. This assists
the service provider in identifying the service
improvement opportunities as well as analyzing
whether delivering the perceived value attributes
results in a competitive advantage. In our example
we compare Amazon.com, Barnes & Noble and the
Bookstores with respect to the value attributes listed
in the model. By Bookstores we refer to small and
independent bookstores that were not a part of the
book superstores or chains such as Barnes and Noble
or Borders. As illustrated, Bookstores were doing
better in the price and availability of out-of-print
books. Bookstores superiority in these two value
dimensions was mainly due to selling used books.
3.2 Modeling Customer Value Creation
in Amazon.com’s Business Model
The previous section focused on the analysis of
value attributes and their impact on net perceived
value as well as the strategic positioning of the
service relative to the competition. In this section we
present the design of the value creation process.
Figure 3 illustrates the value creation process in
Amazon.com business model wherein we model the
service features created by the service components
that are provided by the service provider and its
value network and their corresponding value
attributes. In the model, we put an X to map the
service components to service features and service
features to the value attributes. More concretely, we
can see that for instance, Amazon.com provides the
service component “Book recommendation system”
which creates the service feature “Recommended
books” that is linked to the value attribute “knowing
similar books”. Similarly, the Distributor Co. holds
an “In-print book inventory” that creates the feature
“Availability of in-print books” which pertains to the
value attribute “Book delivery”.
3.3 Modeling Service Provider Value
Capture in Amazon.Com’s
Business Model
In Section 2 we explored different choices available
to service providers to increase their net captured
value (NCV). As discussed in section 2.2.2 the
monetary and non-monetary benefits created by the
customers determine the value captured by the
service provider that increases the net value captured
by the service supplier. The costs of the service
components (i.e. organizing cost of service provider
and the opportunity cost of the suppliers in the value
network) reduce the net captured value by the
service supplier.
Second International Symposium on Business Modeling and Software Design
88

Figure 4: The overall modeling framework, including service provider value capture.
To model the service provider’s net captured
value we start our analysis from the customer side.
As discussed in Section 2.2, the customers of the
service offering take actions based on their
perceptions of the net perceived value of the service
provider relative to the competing offerings. As
illustrated in Figure 4, both Customer X and Y buy
books on Amazon.com. This action generates the
monetary benefit of “Book sales” which leads to
“Sales revenues” as the value captured by
Amazon.com. As illustrated, revenues have a strong
positive impact on Amazon.com’s net captured
value. Similarly, Customer X “Writes reviews” and
generates the non-monetary benefit of “Book
reviews” which results in an “Increase in the service
value” of Amazon.com and thereby a higher net
perceived value that can lead to more sales and
revenues. Thereby, a non-monetary benefit can lead
to the generation of monetary benefit by the passing
of time. As shown in the model “Increase in the
service value” has a medium positive impact on the
net value captured by Amazon.com. Finally,
Customer Y “Recommends Amazon.com to
friends”. The non-monetary benefit of “word of
mouth” results in “Growth in potential customers”
and a strong positive impact on Amazon.com net
captured value by the passing of time. The gray
background denotes that this impact will not occur
immediately.
To model the cost of service components, we
represent the “opportunity cost” and “organizing
cost” concepts as elaborated in Section 2.2.3, by
“cost of sales” and “operating expenses” constructs.
We define these two indicators based on the
definitions in the Amazon.com’s annual reports
1997 – 2010 (Amazon, 2011b). As our study focuses
on the book segment of Amazon.com’s business, we
modify these definitions to match the scope of our
analysis.
• Cost of sales consists of the purchase price of
the books sold by Amazon.com, inbound and
outbound shipping charges to Amazon.com,
packaging supplies, etc.
• Operating expenses comprise; marketing and
sales expenses (i.e. advertising, promotional
and public relations expenditures including the
related expenses for personnel engaged in
marketing, selling and fulfillment activities.
Modeling the Design of Value in Service-oriented Business Models
89

Product development expenses, and general
and administrative expenses (i.e. payroll and
related expenses).
As illustrated in Figure 4, we link the service
components to the cost of sales and the operating
expenses. More specifically, to represent the
organizing and opportunity costs, the service
components provided by Amazon.com are linked to
the “Operating expenses” and the service
components provided by the suppliers in
Amazon.com value network are connected to the
“Cost of sales”.
In 1997, books could be acquired from publishers
or from a network of distributors. Both the
publishers and the distributors had very high
opportunity costs. Months before publishing a book,
the publishers should determine the number of
copies they intend to print. Publishers could not
come up with an estimate before negotiating a deal
with the booksellers that grant the booksellers the
permission to return the unsold books. In 1994 for
instance, 35% of the 460 million books shipped by
the publishers were returned to them. The
distributors, on the other hand carried around
500,000 titles in their inventories to ensure they met
the demand (Spector, 2002). Moreover,
Amazon.com was also suffering from its high
organizing costs that were mainly related to
managing its huge distribution centers. In November
of 1997 Amazon.com opened up its second
distribution center. The 200,000-square-foot state-
of-the-art Delaware distribution center, the length of
three football fields, together with the expansion of
its Seattle distribution center, drastically increased
the operating expenses.
In the late 1990s, Amazon.com’s net captured
value capture had decreased, mainly due to: high
opportunity costs of publishers and distributors; high
operating expenses of its operations, and the
attributes reducing the net value perceived by its
customers (see Figure 4.). This reduction in the net
captured value had placed Amazon.com on the brink
of bankruptcy. As a matter of fact, by the summer of
2000, Amazon's stock price had dropped by more
than two-thirds and by the end of 2000, was down
more than 80% of the beginning of 2000. Wall
Street speculated that Amazon would file for
bankruptcy or that another company would buy it.
Analysts assert that if Amazon had not been able to
borrow $680 million in February of 2000, it would
have run out of cash and gone bankrupt (Applegate,
2002 and 2008).
3.4 Value Redesign in Amazon.com
Business Model Circa 2001
In November 2000, Amazon.com introduced its
new service offering, Amazon Marketplace. In the
online book value segment, Marketplace allows
bookstores to sell new, used (including out-of-print
books) on the same page that Amazon.com sells its
new books. This side-by-side placement
dramatically expanded the book selection available
to the book buyers by enabling them to choose
between new and used books from multiple
booksellers including Amazon.com on one single
store (Spector, 2002) and thereby, led to an increase
in the value perceived by the customers by
expanding the titles available.
By launching the Marketplace services,
Amazon.com put itself in a head-on price
competition with the bookstores to win over
customer orders.
Amazon Marketplace increased customer’s net
perceived value by reducing the book prices and the
availability of out-of-print books. Amazon.com and
the bookstores had to think out ways to decrease
their organizing costs so that they could offer the
book at the lowest price possible in a reverse bidding
process in order to win customer orders. This
competition resulted in a reduction in book prices on
Amazon Marketplace. In addition, the presence of
the Bookstores in Amazon Marketplace led to the
sales of used books on Amazon Marketplace that
could once more result in a lower prices and
availability of out-of-print books
Amazon Marketplace enables sellers to utilize the
e-commerce services and tools to present their
products alongside Amazon.com’s on the same
product detail page on Amazon.com’s website
pursuing what Bezos phrased as “single store
strategy”. To realize this single-store strategy, by
adapting a coopetitive (simultaneously competitive
and cooperative) strategy, Amazon.com provided
third-part sellers with automated tools to migrate
their catalogs of millions of used and out-of-print
books onto the new single product pages inside the
Amazon books tab and thereby, reducing the
bookstores’ opportunity cost by decreasing their
costs of doing business with Amazon.com. More
importantly, the Marketplace created the opportunity
for the bookstores to merchandise their products on
the highly trafficked web pages that historically had
sold only Amazon products. This, in effect, would
mean higher volume of orders and thus lower
opportunity costs for bookstores.
Second International Symposium on Business Modeling and Software Design
90

The Marketplace led to the generation of
significant business and thereby considerable
increase in net sales and gross profit helping
Amazon.com to offset operating expenses and sales
costs and achieve profitability in 2003 for the first
time after its establishment. The Marketplace was
the major factor behind Amazon.com’s profitability.
Amazon reported that third-party transactions
accounted for 20% of its North American units sold
in the second quarter of 2002 (Applegate, 2008).
4 RELATED WORK
e3Service (Kindern and Gordijn, 2008) is a method
for semi-automatically reasoning about matching
service offerings with service adopter needs. In
order to make this semi automatic reasoning
possible, e3Service assumes that the service adopter
and service supplier share the same ontology, that
the service adopter specifies her needs in the same
vocabulary as the service supplier specifies its
offering. We precisely avoid making this simplifying
assumption. This comes at the cost of enormously
complicating automatic or event semi-automatic
reasoning with the benefit of models that more
accurately reflect reality. Also, e3Service defines the
value of a service only from the point of view of the
service adopter.
House of Quality (Clausing and Hauser, 1988) is
an improvement method, in which the main
modeling artefact is very similar to the modeling
framework presented in this paper. The House of
Quality was derived from Quality Function
Deployment (QFD), a method that was developed by
Japanese companies to improve manufacturing
processes for greater service adopter satisfaction.
House of Quality is, therefore, more geared toward
manufacturing processes.
Strategy canvas (Kim and Mauborgne, 2004 and
2005) is a diagnostic framework for strategy
development. It allows an organization to visualize
the competitive factors and the current state of play
of those factors within a market place and to
compare the organization’s offering with those of
the industry in general.
The Business Model Canvas (Osterwalder and
Pigneur, 2010) is a strategic management tool,
which assists in the development of new and
improvement of existing business models. The
canvas includes the nine blocks of a business model:
key partners; key activities; key resources; value
propositions; customer relationships; channels, and
customer segments. While Business Model Canvas
presents all the building blocks of a business model
it does not provide a holistic view where the
interplay and the linkages between the building
blocks are modeled.
Value model in this paper is an extension to the
SAR (Supplier Adopter Relationship) diagram in
(Golnam et. al, 2010 and 2011). The SAR is a part
of the Systemic Enterprise Architecture
Methodology (SEAM) (Wegmann, 2003).
5 CONCLUSIONS AND FUTURE
WORK
In this paper we proposed a modeling framework to
conceptualize and represent the design of value in
service-oriented business models. Our framework is
theoretically grounded in the theoretical insights
from management science and economics, drawing
principally upon work from the past two decades on
value creation and capture including theories,
frameworks, constructs, and other models. Thanks to
the theoretical rigour embedded our framework the
modeling artefact is generic enough to be applicable
in the representation of value design in service-
oriented business models.
We illustrated the usability and applicability of
our framework by modeling value creation and
capture in Amazon.com service system circa 1997
and gained insights into the changes that occurred in
Amazon.com’s business model circa 2001.
Future work will seek to validate and refine the
proposed model by way of applying it to an actual
firm and it’s ecosystem. In this way this research,
which has already drawn on the knowledge base for
its foundations, will draw upon the environment
(composed of people, organizations, and technology)
through its real business needs for feedback and
validation. Following this a justification and
evaluation process should take place, eventually
leading to the next iteration of the model.
REFERENCES
Afuah, A. , Tucci, C. L. 2002. Internet business models
and strategies: Text and cases, McGraw-Hill Higher
Education.
Amazon 2011a. Amazon Media Room: News Releases
http://phx.corporate-ir.net/phoenix.zhtml?c=176060,
p=irol-news.
Amazon 2011b. Amazon.com Investor Relations: Annual
Reports and Proxies http://phx.corporate-ir.net/
phoenix.zhtml?c=97664,p=irol-reportsannual.
Modeling the Design of Value in Service-oriented Business Models
91

Ambrosini, V., Bowman, C. , Collier, N. 2010. Using
teaching case studies for management research.
Strategic Organization, 8, 206.
Applegate, L. 2002. Amazon. com: 1994-2000. Case#: 9-
801-194, Harvard Business School.
Applegate, L. M. 2008. Amazon. com: The Brink of
Bankruptcy. Harvard Business School Case, 9-809.
Barney, J. 1991. Firm resources and sustained competitive
advantage. Journal of management, 17, 99.
Blomqvist, K., Kylaheiko, K. , Virolainen, V. M. 2002.
Filling a gap in traditional transaction cost
economics::: Towards transaction benefits-based
analysis. International Journal of Production
Economics, 79, 1-14.
Bowman, C. , Ambrosini, V. 2000. Value creation versus
value capture: towards a coherent definition of value
in strategy. British Journal of Management, 11,
1–15.
Brandenburger, A. M. , Stuart Jr, H. W. 1996. Value based
Business Strategy. Journal of Economics and
Management Strategy, 5, 5-24.
Carson, R. T., Flores, N. E., Martin, K. M. , Wright, J. L.
1996. Contingent valuation and revealed preference
methodologies: comparing the estimates for quasi-
public goods. Land Economics, 80-99.
Chesbrough, H., Spohrer, J., 2006. "A research manifesto
for services science," Communications of the ACM,
Vol. 49, No. 7, pp. 35-40.
Clausing, D. , Hauser, J. R. 1988. The house of quality.
Harvard Business Review, 66, 63-73.
Clulow, V., Barry, C. , Gerstman, J. 2007. The resource-
based view and value: the customer-based view of the
firm. Journal of European Industrial Training, 31, 19-
35.
Cousins, P. D. , Spekman, R. 2003. Strategic supply and
the management of inter-and intra-organisational
relationships. Journal of Purchasing and Supply
Management, 9, 19-29.
Daum, J.H., 2003. “Intangible assets and value creation”.
John Wiley & Sons.
Day, G.S., 1990. “Market Driven Strategy: Processes for
Creating Value” Journal of Marketing, vol. 55, no. 4,
pp. 116.
De Kinderen, S. , Gordijn, J. E 3 Service: A Model-Based
Approach for Generating Needs-driven E-Service
Bundles in a Networked Enterprise. Proceedings of the
16th European Conference on Information Systems
(ECIS), Galway, Ireland, 2008.
Dierickx, I., Cool, K., 1989. “Asset stock accumulation
and sustainability of competitive advantage,”
Management science, pp. 1504–1511.
Eggert, A., Ulaga, W., 2002. “Customer perceived value: a
substitute for satisfaction in business markets?,”
Journal of Business & Industrial Marketing, vol. 17,
no. 2/3, pp. 107-118.
Freel, M. 2006. Patterns of technological innovation in
knowledge intensive business services. Industry and
Innovation, 13, 335-358.
Golnam, A., Regev, G., Ramboz, J., Laparde, P. ,
Wegmann, A, 2010. Systemic Service Design:
Alaigning Value with Implementation. In: Snene, M.,
Ralyté, J. & Morin, J.-H., eds. 1st International
Conference on Exploring Services Sciences, Geneva,
Switzerland. Springer, 150-164.
Golnam, A., Regev, G., Ramboz, J., Laprade, P. ,
Wegmann, A, 2011. Aligning Value and
Implementation in Service Design - A Systemic
Approach. International Journal of Service Science,
Management, Engineering, and Technology
(IJSSMET), In Press.
Golnam, A., Ritala, P., Viswanathan, V., Wegmann, A,
2012. Modeling Value Creation and Capture in
Service Systems. In: SNENE, M., ed. Third
International Conference on Exploring Services
Sciences, February 2012 Geneva, Switzerland.
Springer, 155-169.
Gordijn, J. , Akkermans, J. 2003. Value-based
requirements engineering: Exploring innovative e-
commerce ideas. Requirements Engineering, 8, 114-
134.
Gordijn, J., Yu, E. , Van Der Raadt, B. 2006. E-service
design using i* and e 3 value modeling. IEEE
software, 23, 26-33.
Grant, R. M. 1996. Toward a knowledge-based theory of
the firm. Strategic Management Journal, 17, 109-122.
Grönroos, C., 2000. “Service Management and
Marketing” European Journal of Marketing, vol. 15,
no. 2, pp. 3-31.
Grönroos, C. , Ravald, A. 2011. Service as business logic:
implications for value creation and marketing. Journal
of Service Management, 22, 5-22.
Heck, E. , Vervest, P. 2007. Smart business networks: how
the network wins. Communications of the ACM, 50,
28-37.
Jacobides, M.G., Knudsen, T., Augier, M., 2006.
“Benefiting from innovation: Value creation, value
appropriation and the role of industry architectures,”
Research Policy, vol. 35, no. 8, pp. 1200-1221.
Johannesson, P., Andersson, B., Bergholtz, M. , Weigand,
H. 2009. Enterprise modelling for value based service
analysis. The Practice of Enterprise Modeling, 153-
167.
Kalpanik, S. , Zheng, C. 2011. Inside the Giant Machine -
An Amazon.com Story, Center of Artificial
Imagination, Inc. 2nd Edition.
Khalifa, A.S., 2004. “Customer value: a review of recent
literature and an integrative configuration,”
Management Decision, vol. 42, no. 5, pp. 645-666.
Kim, W. C. , Mauborgne, R. 2004. Blue ocean strategy. If
you read nothing else on strategy, read thesebest-
selling articles., 71.
Kim, W. C. , Mauborgne, R. E. 2005. Blue Ocean
Strategy: How to Create Uncontested Market Space
and Make Competition Irrelevant, Harvard Business
Press.
Kothandaraman, P. , Wilson, D. T. 2001. The Future of
Competition:: Value-Creating Networks. Industrial
Marketing Management, 30, 379-389.
Kotler, P. 2000. Marketing management, millennium ed.
Second International Symposium on Business Modeling and Software Design
92

Lepak, D., Smith, K., Taylor, M., 2007. “Introduction to
Special Topic Forum: Value Creation and Value
Capture: A Multilevel Perspective,” The Academy of
Management Review ARCHIVE, vol. 32, no. 1, pp.
180-194.
Masten, S. E., Meehan, J. W. , Snyder, E. A. 1991. The
costs of organization. Journal of Law, Economics, and
Organization, 7, 1.
Moller, K. , Svahn, S. 2006. Role of Knowledge in Value
Creation in Business Nets*. Journal of Management
Studies, 43, 985-1007.
Norman, R. , Ramirez, R. 1993. From Value Chain to
Value Constellation. Harvard Business Review, 71,
65-77.
Osterwalder, A. , Pigneur, Y. 2010. Business model
generation: A handbook for visionaries, game
changers, and challengers, Wiley.
Peppard, J., Rylander, A., 2006. “From Value Chain to
Value Network:: Insights for Mobile Operators,”
European Management Journal, vol. 24, no. 2-3, pp.
128-141.
Pijpers, V. , Gordijn, J. 2007. e 3 forces : Understanding
Strategies of Networked e 3 value Constellations by
Analyzing Environmental Forces. Advanced
Information Systems Engineering.
Pitelis, C. N. 2009. The co-evolution of organizational
value capture, value creation and sustainable
advantage. Organization Studies, 30, 1115.
Ritala, P., Andreeva, T., Kosonen, M. , Blomqvist, K.
2011. A Problem-Solving Typology of Service
Business. Electronic Journal of Knowledge
Management, 9, 37-45.
Ritala, P., Hurmelinna-Laukkanen, P. 2009. What's in it
for me? Creating and capturing value in innovation-
related coopetion. Technovation, 29, 819-828.
Spector, R. 2002. Amazon. com: Get big fast, Harper
Paperbacks.
Stake, R. E. 1995. The art of case study research, Sage
Publications, Inc.
Teece, D. J. 2009. Dynamic capabilities and strategic
management: organizing for innovation and growth,
Oxford University Press, USA.
Tether, B. S. , Hipp, C. 2002. Knowledge intensive,
technical and other services: patterns of
competitiveness and innovation compared. Technology
Analysis and Strategic Management, 14, 163-182.
Vargo, S. L. , Lusch, R. F. 2004. Evolving to a new
dominant logic for marketing. Journal of marketing,
68, 1‚17.
Vargo, S. L. , Lusch, R. F. 2008. Service-dominant logic:
continuing the evolution.
Journal of the Academy of
Marketing Science, 36, 1.
Vargo, S. L., Maglio, P. P. , Akaka, M. A. 2008. On value
and value co-creation: A service systems and service
logic perspective. European Management Journal, 26,
145–152.
Weigand, H. 2009. Value Encounters: Modeling and
Analyzing Co-creation of Value. Software Services for
e-Business and e-Society, 51-64.
Weigand, H., Johannesson, P., Andersson, B. , Bergholtz,
M. Value-based service modeling and design: Toward
a unified view of services. 2009. Springer, 410-424.
Yin, R. K. 2009. Case study research: Design and
methods, Sage Publications, Inc.
Yu, E. 1997a. Proceedings of the 3rd IEEE International
Symposium on Requirements Engineering. Citeseer.
Yu, E. S. K. 1997b. Towards modelling and reasoning
support for early-phase requirements engineering.
Requirements Engineering, 1997., Proceedings of the
Third IEEE International Symposium on.
Modeling the Design of Value in Service-oriented Business Models
93
