
A New Tool for the Analysis of Heart Rate Variability of Long
Duration Records
Ricardo Chorão
1
, Joana Sousa
2
, Tiago Araújo
1,2
and Hugo Gamboa
1,2
1
Physics Department, FCT-UNL, Lisbon, Portugal
2
PLUX Wireless Biosignals S.A., Lisbon, Portugal
Keywords: ECG, Heart Rate Variability, Interactive Tool.
Abstract: The increased masses of data confronting us, originate a pressing need for the creation of a user interface for
better handling and extracting knowledge from it. In this work we developed such a tool for the analysis of
Heart Rate Variability (HRV). The analysis of HRV in patients with neuromuscular diseases, sleep
disorders and cardiorespiratory problems has a strong impact on clinical practice. It has been widely used
for monitoring the autonomic nervous system (ANS), whose regulatory effect controls the cardiac activity.
These patients need to be continuously monitored, which originates data with huge sizes. Our interactive
tool can perform a fast analysis of HRV from such data. It provides the analysis of HRV in time and
frequency domains, and from non-linear methods. The tool is suitable to be run in a web environment,
rendering it highly portable. It includes a programming feature, which enables the user to perform additional
analysis of the data by giving direct access to the signals in a signal processing programming environment.
We also added a report generation functionality, which is extremely important from a clinical standpoint, on
which the evolution in time of relevant HRV parameters is depicted.
1 INTRODUCTION
The ever increasing development of clinical systems
for patients’ biosignals monitoring has given the
clinician and the researcher a way of assessing the
patients’ health state (Silva et al., 2011). The
possibility of drawing relevant medical conclusions
from the analysis of biosignals arises from the fact
that they contain information which is directly
related to the physiological mechanisms that
originated them (Bronzino, 2000).
The constant monitoring of ambulatory patients,
with conditions such as neuromuscular diseases,
sleep disorders or chronic heart problems, has great
value and may provide the clinician with a way for a
more objective therapy (Davenport et al., 2009). It
also plays a preventive role, enabling the clinician to
undertake a faster medical response.
Recordings of several hours originate huge
amounts of data, which need to be processed and
analysed rapidly.
The Heart Rate Variability (HRV) is a very
important tool to analyse ECG signals with detail. In
HRV analysis, the oscillations between consecutive
heartbeats are measured, both in time and frequency
domains.
Since the HRV is strongly associated with neuro-
regulation mechanisms, it also allows one to
evaluate the modulation of the heart rate by the ANS
(Ryan et al., 2011).
The first step of HRV analysis is the
measurement of all the inter-beat intervals, which
can be achieved through the detection of the peaks in
the ECG record, as shown in figure 1.
Figure 1: Highlight of 3 ECG peaks (the R peaks) and
measurement of 2 heartbeat intervals (or RR intervals).
There are several methods of analysis of HRV
that can be divided mainly into Time and Frequency
215
Chorão R., Sousa J., Araújo T. and Gamboa H..
A New Tool for the Analysis of Heart Rate Variability of Long Duration Records.
DOI: 10.5220/0004166602150220
In Proceedings of the International Conference on Signal Processing and Multimedia Applications and Wireless Information Networks and Systems
(SIGMAP-2012), pages 215-220
ISBN: 978-989-8565-25-9
Copyright
c
2012 SCITEPRESS (Science and Technology Publications, Lda.)

domain methods (Camm et al., 1996).
Time domain analysis of HRV allows calculation
of statistical parameters concerning the RR intervals,
tachogram (evolution of the RR interval duration in
time) and instant heart rate representations. These
visual representations are extremely important to
identify disturbances of the cardiac rhythm, such as
arrhythmias or skipped heartbeats.
Frequency domain analysis methods are
particularly useful for analysing long term ECGs.
They are based on power spectral density (PSD)
analysis of RR intervals and provide information
about how power distributes itself among the various
frequencies. The power in different frequency bands
is closely related to different branches of the ANS,
which makes the power distribution a very important
tool to identify ANS related problems.
We present a new tool capable of performing a
HRV analysis from several hour long ECG records.
There are many HRV analysis tools available,
such as “Biopac HRV Algorithm”, “HRVAS: HRV
Analysis Software” (using Matlab) and the “HRV
Toolkit” (PhysioNet). They all provide frequency
and time domain analysis of ECG records. However
they are not interactive or do not allow one to deal
directly with long duration ECGs, which was our
main concern. In our tool, the HRV analysis begins
in the very ECG records, in spite of the available
tools, which assume the ECG peak detection was
made elsewhere. Our tool also surpasses the
currently available tools in what portability is
concerned, since it can be executed in a web
environment.
The analysis takes only a few seconds despite of
the recording length of several hours. Its flexibility
and possibility of a personalized and detailed
analysis make it suitable for both the clinician and
the researcher.
Its user-friendliness makes it pleasant to use and
easy to learn, two very important characteristics in
any software project according to (Holzinger, 2005).
In the following section the programming
architecture of the application is explained and the
features of the developed tool are depicted. Finally,
we discuss some improvements that can be made,
and conclude the work at the end of the paper.
2 HRV ANALYSIS TOOL
We developed a user-friendly and interactive tool
which runs in a web environment, and therefore can
be accessed easily from anywhere with an internet
connection. It gives the user control over powerful
signal processing algorithms, enabling a human-
computer interaction and the exploration of large
datasets comprising biological signals.
The developed tool allows a detailed analysis of
ECG records with several hours. It is coupled to a
previously developed biosignals visualization tool
(Gomes, 2011); (Gomes et al., 2012) making it
possible to simultaneously visualize the portion of
the signal being analysed and the processing results.
The analysis tool also includes a report
generation feature, in which the evolution of the
patient’s heart rate, among other significant
parameters can be tracked. The report is extremely
important from a medical point of view, making the
processing results portable and an extension of the
patient’s clinical file.
For fast and random accessing of processing
results, we used the HDF5 file format, specifically
designed to store and access large datasets (The hdf
group, 2012).
2.1 Acquisition System
The signals were acquired with the aid of a chest
wrap, which integrates respiration, ECG and
accelerometer sensors. They are sampled at 1 kHz
and with a 12 bit resolution and are then sent by
Bluetooth to a mobile phone.
The acquisition process is occurring under
project “wiCardioResp”. This project is developing
technology to remotely monitor patients with
neuromuscular diseases and cardiorespiratory
problems while the patients are comfortably at home
(PLUX, 2012). The acquisitions were carried out
with their agreement, during the night, and last
approximately 7 hours.
2.2 Application Platform
We coupled the HRV analysis tool to a previously
developed web-based biosignals visualization tool.
The application is executed in a web browser,
rendering it highly portable, and giving it the
potential of being accessed from anywhere with an
internet connection.
All signal processing algorithms were written in
Python and used SciPy (SciPy, 2012), a Python
package for scientific computing. The application
platform was created using JavaScript and HTML,
browser-supported languages.
2.3 Programming Architecture
HRV analysis requires the detection of the different
SIGMAP2012-InternationalConferenceonSignalProcessingandMultimediaApplications
216

heartbeats. This is typically achieved using an ECG
peak detection algorithm, because the ECG peak
morphology (see figure 1) makes it an easily
detectable feature in the ECG waveform.
The utilized peak detector was an adaptation of
the Pan and Tompkins algorithm (Pan and
Tompkins, 1985).
To apply an ECG peak detection algorithm over
a long duration record, as a whole, is unfeasible,
because of the amount of memory required to
perform the computation. The strategy employed to
solve this issue consisted in partitioning the record
into several equally sized portions, processing them
individually. This approach gives rise to possible
detection errors in the borders, which we overcame
considering a fixed number of overlapping samples
between consecutive portions. We used an overlap
of 400 ms, carefully chosen after analysing several
ECG records. The bigger the overlapping period, the
longer the processing will last. However, when
dealing with long duration records, the additional
processing time due to the overlapping size is
negligible (at worst a few seconds more in a record
with several hours).
The strategy that we undertook regarding double
peak detections (one of them in an overlapping
region and the other in the beginning of the
subsequent portion of the signal) has a physiological
basis, as following explained:
When a muscle contracts, an action potential is
generated. Then, there is a long absolute refractory
period, which, for the cardiac muscle, lasts about
250 ms. During this period, the cardiac muscle can’t
be re-excited, which results in an inability for heart
contraction (Widmaier, Raff and Strang, 2005).
Thus, we can theoretically consider a maximum
heart rate of about 4 beats per second, or 240 beats
per minute. Under this assumption, considering that
in a signal sampled at 1 kHz, 250 ms would be
represented by 250 samples, and after a thorough
observation of the behaviour of the peak detection
algorithm, we stated that if the same peak were
detected twice, the detection would never occur with
such deviation in samples. Therefore, we
considered that if two R peaks were detected and
separated by less than 50 ms, we were dealing with a
double detection and only considered one of them.
With a tolerance of 50 ms, we ensured that double
detections would not occur on the overlapping
regions, while not dismissing any occurrence of a
physiologically possible RR interval.
The amount of time it takes for the peak
detection to complete depends on several factors: the
sampling frequency at which the signals were
acquired, the signals’ duration, the peak detection
algorithm and the processing unit of the machine in
which the computations take place. It took us about
8 minutes to process a 7 hour long ECG, sampled at
1 kHz on a single 2.2 GHz processor.
The peak detection phase can be regarded as pre-
processing and only has to be done once. Its duration
may be easily decreased applying parallel
programming techniques, due to the embarrassingly
parallel nature of the problem.
The peak detection information was stored in a
.h5 file (HDF5 file extension) for fast and random
access, a necessary feature to make the analysis of
portions of the signal possible.
For analysing a specific part of the ECG, for
instance, between the first and second hour of the
recording, all that has to be done is accessing the
processing results in the .h5 file and select the
samples between the first and second hour. This
information is then analysed in just a few seconds.
The simultaneous visualization of the signal and the
processing results is an extremely important
capability allowing a more detailed and accurate
analysis by the clinician and the researcher.
2.4 Tool Features
The HRV analysis provided is composed of time and
frequency domain parameters and also of some
visual representations, which, allied to the biosignals
visualization tool allow a more detailed data
inspection.
The time and frequency domain parameters
provided are depicted in figure 2.
Figure 2: The most important HRV analysis parameters
provided by our tool.
Besides time and frequency domain parameters,
our tool includes several important visualization
features as well:
tachogram and instantaneous heart rate (figure
3). Since each point in these representations is
directly associated with a cardiac cycle, we included
a zooming feature, directly synchronized with the
ANewToolfortheAnalysisofHeartRateVariabilityofLongDurationRecords
217
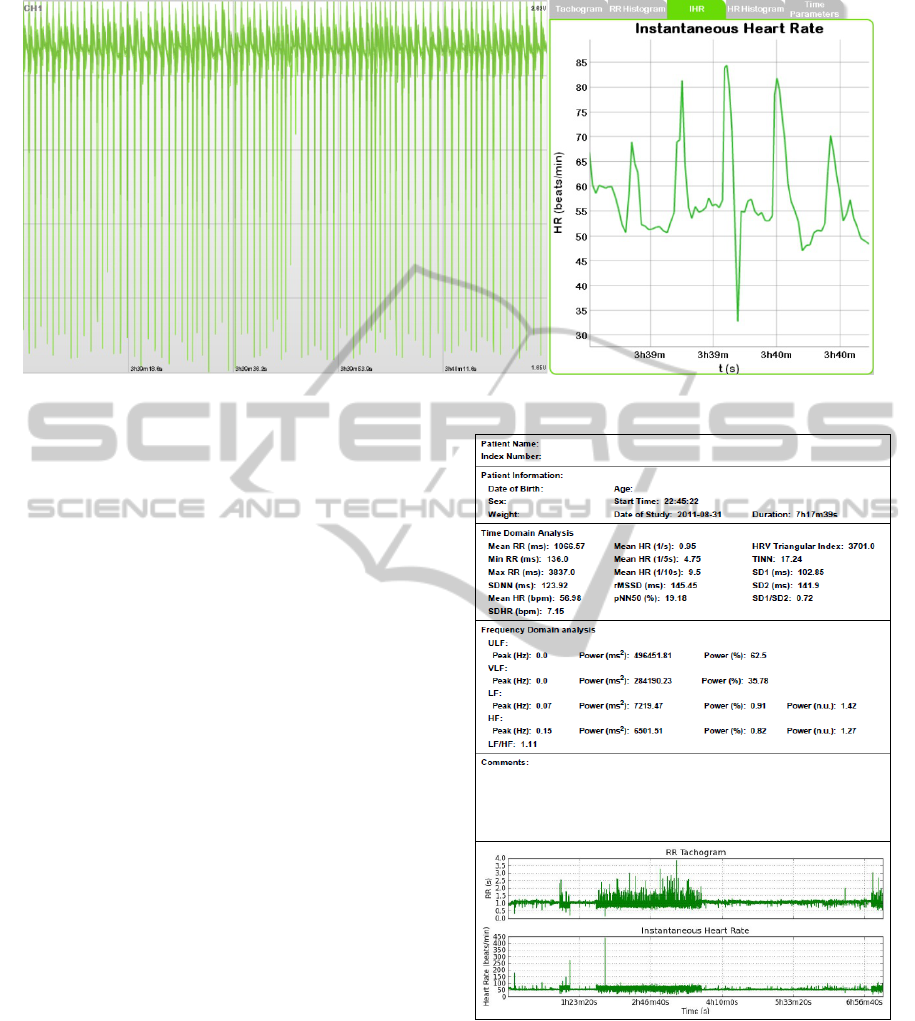
Figure 3: Instantaneous Heart Rate of a 1m30s period from a night recording with a duration of 7h17m.
ECG visualization. This makes the inspection of the
processing results interactive and gives the clinician
the possibility to rapidly identify periods of
arrhythmia or other significant events and observing
them on the ECG record;
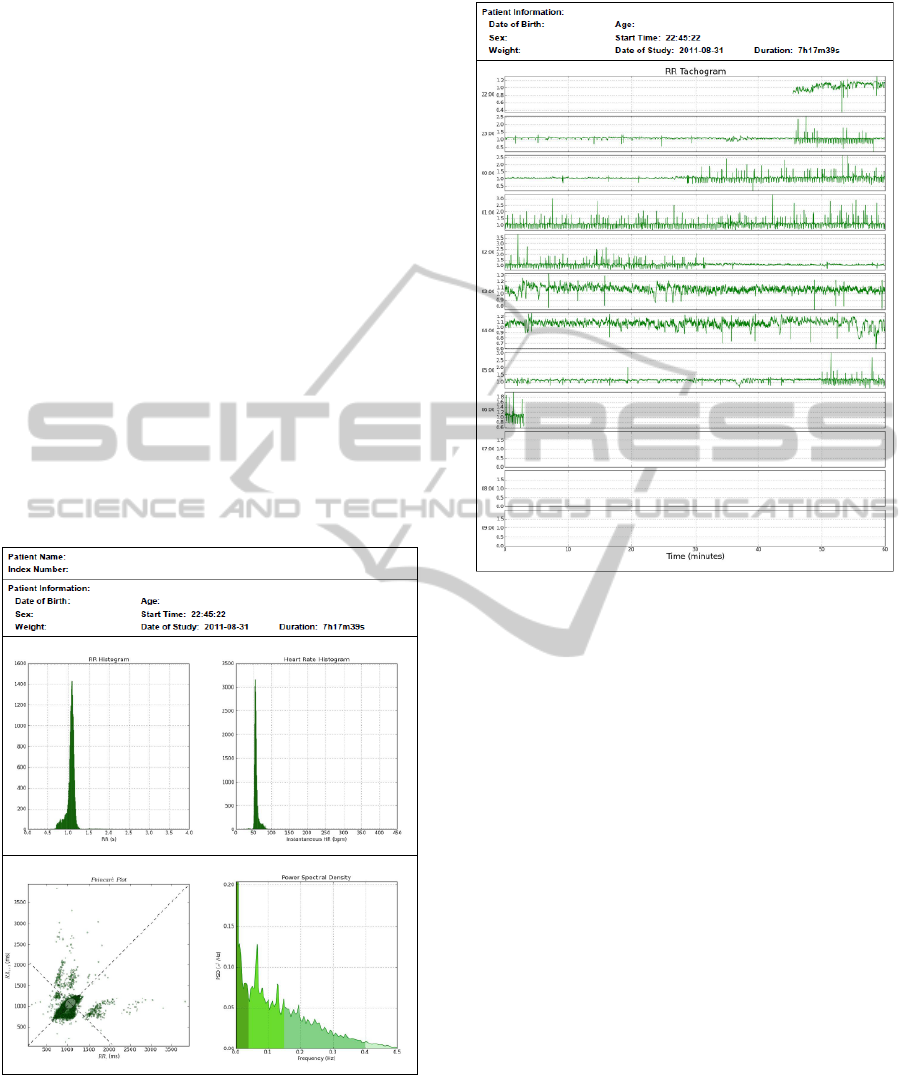
• RR Interval and Instantaneous Heart Rate
histograms with a bin size of 1/128 s (standard bin
size according to Camm et al., 1996);
• Power Spectral Density, with highlight of the
relevant frequency bands and zooming feature for a
more detailed analysis. The frequency range of the
different frequency bands is as follows: ULF (0 -
0.003 Hz), VLF (0.003 - 0.04 Hz), LF (0.04 - 0.15
Hz), HF (0.15 - 0.04 Hz);
• Poincaré plot.
Extremely important as well is a report generation
feature. The report includes a global analysis in
which the parameters and representations already
described are presented. It also illustrates the
evolution of those parameters in time.
We also included a programming feature,
particularly focused on the researcher, in a console.
This way, additional signal processing can be done,
using all of the SciPy capabilities (SciPy, 2012). We
loaded several important variables into the
namespace: the sampling frequency, an array with
all the R peaks, in samples, that were detected in the
selected time range, the beginning and ending of the
selected time range, in samples. All these variables
contain the necessary and sufficient information to
enable a personalized analysis by the programmer or
the researcher.
Figure 4: First page of a HRV analysis report from a night
recording which lasts 7h17m. This page presents a global
time and frequency domain analysis.
3 CONCLUSIONS AND FUTURE
WORK
In this work we developed an HRV analysis tool
SIGMAP2012-InternationalConferenceonSignalProcessingandMultimediaApplications
218
suited for the analysis of long duration records.
Taking into account all described tool features,
we conclude that it offers a flexible, detailed and
accurate way of analysing long duration ECGs. The
report generation and the programming mode
features are very important and give the tool a
greater flexibility and portability, besides that of a
web-based application.
The zooming capabilities and the synchronism
with a biosignals visualization tool make it highly
interactive and provide a way for better and faster
data discovery.
The user interface allows control over powerful
signal processing algorithms and can be regarded as
a way to allow the non-expert to still utilize them for
clinical or research purposes.
In future work we intend to develop an algorithm
which will allow us to determine the minimum
number of overlapping samples for optimal ECG
peak detection. We also aim to add the functionality
of analysing several records simultaneously and to
generate the corresponding HRV analysis reports
using parallel programming techniques.
Figure 5: Second page of the report showing power
spectral density, histograms and Poincaré plot.
Figure 6: Tachogram hour-by-hour evolution. This
representation is extremely useful for identifying periods
of arrhythmia and other events through the night.
ACKNOWLEDGEMENTS
This work was partially supported by National
Strategic Reference Framework (NSRF-QREN)
under project ”wiCardioResp” and ”AAL4ALL”,
and Seventh Framework Programme (FP7) program
under project ICT4Depression, whose support the
authors gratefully acknowledge. The authors also
thank PLUX, Wireless Biosignals for providing the
acquisition system and sensors necessary to this
work.
REFERENCES
H. Silva, S. Plama, H. Gamboa., 2011. AAL+: Continuous
Institutional and Home Care Through Wireless
Biosignal Monitoring Systems. Chapter in Handbook
of Digital Homecare, Lodewijk Bos, Adrie Dumay,
Leonard Goldschmidt, Griet Verhenneman and
Kanagasingam Yogesan, Springer.
J. D. Bronzino., 2000. The biomedical engineering
handbook, volume 2. CRC Press. Boca Raton , 2
nd
edition .D.M. Davenport, FJ Ross, and B. Deb., 2009.
ANewToolfortheAnalysisofHeartRateVariabilityofLongDurationRecords
219

Wireless propagation and coexistence of medical body
sensor networks for ambulatory patient monitoring. In
D. M. Davenport, F. J. Ross, and B. Deb., 2009. Wireless
propagation and coexistence of medical body sensor
networks for ambulatory patient monitoring. In
Wearable and Implantable Body Sensor Networks.
Sixth InternationalWorkshop on pages 41–45. IEEE,
2009.
M. L. Ryan, C. M. Thorson, C. A. Otero, T. Vu, and K. G.
Proctor., 2011. Clinical applications of heart rate
variability in the triage and assessment of
traumatically injured patients. Anesthesiology research
and practice, 2011.
A. J. Camm, M. Malik, J. T. Bigger, G. Breithardt, S.
Cerutti, R. J. Cohen, P. Coumel, E. L. Fallen, H. L.
Kennedy, R. E. Kleiger, et al., 1996. Heart rate
variability: standards of measurement, physiological
interpretation, and clinical use. Circulation,
93(5):1043–1065.
PhysioNet – http://physionet.org/tutorials/hrv-toolkit/.
Accessed 26/05/2012
Holzinger, A., 2005. Usability engineering methods for
software developers. Communications of the ACM,
48(1):71–74.
R. Gomes, N. Neuza, J. Sousa, H. Gamboa., 2012. Long-
term biosignals visualization and processing.
Proceedings of Biosignals - 5
th
International
Conference on Bio-Inspired and Signal Processing
(BIOSIGNALS 2012), Vilamoura, Portugal.
Ricardo Gomes., 2011. Long-term biosignals visualization
and processing. Master thesis, Universidade Nova de
Lisboa, Faculdade de Ciências e Tecnologia, 2011.
The hdf group – http://www.hdfgroup.org/why_hdf/.
Accessed: 26/05/2012
PLUX (2012) – http://wicardioresp.plux.info/pt-pt.
Accessed: 25/05/2012
Scipy – http://www.scipy.org/. Accessed: 26/05/2012
Pan, J. and Tompkins, W. (1985). A real-time qrs
detection algorithm. Biomedical Engineering, IEEE
Transactions on, (3):230–236.
Eric P. Widmaier, Hershel Raff, and Kevin T. Strang.,
2005. Vander’s Human Physiology: The Mechanisms
of Body Function. McGraw-Hill International Edition,
10
th
edition.
SIGMAP2012-InternationalConferenceonSignalProcessingandMultimediaApplications
220
