
An Order-invariant Time Series Distance Measure
Position on Recent Developments in Time Series Analysis
Stephan Spiegel and Sahin Albayrak
DAI-Lab, Technische Universit¨at Berlin, Ernst-Reuter-Platz 7, 10587 Berlin, Germany
Keywords:
Time Series, Distance Measure, Recurrence Plots.
Abstract:
Although there has been substantial progress in time series analysis in recent years, time series distance
measures still remain a topic of interest with a lot of potential for improvements.
In this paper we introduce a novel Order Invariant Distance measure which is able to determine the
(dis)similarity of time series that exhibit similar sub-sequences at arbitrary positions. Additionally, we
demonstrate the practicality of the proposed measure on a sample data set of synthetic time series with
artificially implanted patterns, and discuss the implications for real-life data mining applications.
1 INTRODUCTION
The distance between time series needs to be care-
fully defined in order to reflect the underlying
(dis)similarity of such data. This is particularly desir-
able for similarity-based retrieval, classification, clus-
tering, segmentation and other mining procedures of
time series (Ding et al., 2008).
The choice of time series distance measure de-
pends on the invariance required by the domain
(Batista and Wang, 2011). Recent work has intro-
duced techniques designed to efficiently measure sim-
ilarity between time series with invariance to (vari-
ous combinations of) the distortions of warping, uni-
form scaling, offset, amplitude scaling, phase, oc-
clusions, uncertainty and wandering baseline (Batista
and Wang, 2011).
In this study we propose a novel Order-Invariant
Distance (OID) measure which is able to determine
the (dis)similarity of time series that exhibit simi-
lar sub-sequences at arbitrary positions. We claim
that order invariance is an important consideration for
domains such as automotive engineering and smart
home environments, where multiple sensors log con-
textual patterns in their naturally occurring order, and
time series are compared to discriminate complex sit-
uations (Spiegel et al., 2011a; Spiegel et al., 2011b).
To ensure the validity of our claim, we demonstrate
the practicability and capabilities of the introduced
OID measure on a sample data set of synthetic time
series with artificially implanted pattens.
The rest of the paper is structured as followed.
Section 2 presents popular distance measures which
are frequently used to compare time series. Known
invariance and important considerations for the de-
sign of time series distance measures are discussed in
Section 3. Our proposed Order-Invariant Distance is
introduced in Section 4. The capabilities of our pre-
sented OID measure are demonstrated in Section 5.
Finally we conclude the paper in Section 6.
2 DISTANCE MEASURES
Suppose we have two time series, Q and C, of length
n. To measure their similarity, we can use the Eu-
clidean Distance (ED):
ED(Q,C) =
2
s
n
∑
i=1
(q
i
− c
i
)
2
(1)
While ED is a simple measure, it is suitable for
many problems (Lin et al., 2004). Nevertheless, in
many domains the data is distorted in some way, and
either the distortion must be removed before using
Euclidean Distance, or a more robust measure must
be used instead (Batista and Wang, 2011).
Dynamic Time Warping (DTW) allows a more in-
tuitive distance measure for time series that have sim-
ilar shape, but are not aligned in time (Keogh and
Ratanamahatana, 2005). To align two sequences us-
ing DTW we construct a matrix which contains the
distances between any two points. A warping path
264
Spiegel S. and Albayrak S..
An Order-invariant Time Series Distance Measure - Position on Recent Developments in Time Series Analysis.
DOI: 10.5220/0004165602640268
In Proceedings of the International Conference on Knowledge Discovery and Information Retrieval (KDIR-2012), pages 264-268
ISBN: 978-989-8565-29-7
Copyright
c
2012 SCITEPRESS (Science and Technology Publications, Lda.)

W = w
1
.. . w
K
is a contiguous set of matrix elements
that defines a mapping between Q andC under several
constrains (Keogh and Ratanamahatana, 2005):
DTW(Q,C) = min
2
v
u
u
t
K
∑
k=1
w
k
(2)
This path can be found using dynamic program-
ming to evaluate the following recurrence which de-
fines the cumulative distance γ(i, j) as the distance
d(i, j) found in the current cell and the minimum
of the cumulative distances of the adjacent elements
(Keogh and Ratanamahatana, 2005):
γ(i, j) = d(q
i
,c
j
) + min{γ(i− 1, j − 1),
γ(i− 1, j),
γ(i, j − 1)}
(3)
The Euclidean Distance between two sequences
can be seen as a special case of DTW where both time
series have same length and the warping path com-
plies with the main diagonal of the distance matrix.
However, the superiority of DTW over ED has been
demonstrated by several authors (Ding et al., 2008;
Keogh, 2003) for many data mining applications.
3 KNOWN INVARIANCE
Important considerations regarding time series dis-
tance include amplitude invariance and offset in-
variance (Batista and Wang, 2011). If we try to com-
pare two time series measured on different scales they
will not match well, even if they have similar shapes.
Similarly, even if two time series have identical am-
plitudes, they may have different offsets. To measure
the true underlying similarity we must first center and
scale the time series (by trivial z-normalization).
Furthermore, local scaling invariance or rather
warping invariance (Batista and Wang, 2011) should
be taken into account when comparing time series.
This invariance is necessary in almost all biological
signals, which match only when one is locally warped
to align with the other. Recent empirical evidence
strongly suggests that Dynamic Time Warping is a
robust distance measure which works exceptionally
well (Ding et al., 2008).
In contrast to the localized scaling that DTW deals
with, in many data sets we must account for uniform
scaling invariance (Batista and Wang, 2011), where
we try to match a shorter time series against the pre-
fix of a longer one. The main difficulty in creating
uniform scaling invariance is that we typically do not
know the scaling factor in advance, and are thus con-
demned to testing all possibilities within a given range
(Keogh, 2003).
Phase invariance (Batista and Wang, 2011) is im-
portant when matching periodic time series such as
heart beats. By holding one time series fixed, and
testing all circular shifts of the other, we can achieve
phase invariance.
In domains where a small sub-sequence of a time
series may be missing we must consider occlusion
invariance (Batista and Wang, 2011). This form of
invariance can be achieve by selectively declining to
match subsections of a time series. However, most
real-life problems require multiple invariance.
4 ORDER-INVARIANT DISTANCE
This paper introduces an Order-Invariant Distance
(OID) measure which is able to determine the
(dis)similarity of time series which have different
shapes, but exhibit similar sub-sequences in arbi-
trary order. For example, we can imagine the speed
recorded during two different car drives, from home
to the convenience store and back, where the signals
exhibit the same location-dependent traffic situations
(e.g. crosswalk, intersection, driveway, traffic light)
in reverse order (refer to Figure 1) and are therefore
similar in regard of order invariance.
Although order invariance may be an important
consideration for other real-life data mining applica-
tions, relevant literature (Batista and Wang, 2011) is
lacking a time series distance measure which is able
to determine the (dis)similarity of signals that contain
multiple similar events at arbitrary positions in time.
Commonly used measures like ED and DTW are not
designed to deal with order invariance, because they
discriminate time series according to their shapes and
fail to recognize cross-alignments between unordered
sub-sequences. To this end, we developed an Order
Invariant Distance measure which matches similar
sub-sequences regardless of their order or location.
Our proposed OID measure is based on the Cross
Recurrence Plot (CRP) approach (Marwan, 2008;
Marwan et al., 2007) which tests for occurrences of
similar states in two different systems, or rather time
series (with same physical units). The data length of
both time series can differ, leading to a non-square
recurrence matrix R:
R
i, j
= Θ(ε− ||q
i
− c
j
||)
(4)
where Θ represents the Heaviside function (i.e.
Θ(x) = 0 if x < 0, and Θ(x) = 1 otherwise), || · || is a
norm (i.e. L
2
-norm) and ε is a threshold distance that
determines the radius of the similarity neighborhood.
A closer inspection of the Cross Recurrence Plot
(matrix R) reveals small-scale structures, which can
AnOrder-invariantTimeSeriesDistanceMeasure-PositiononRecentDevelopmentsinTimeSeriesAnalysis
265
ABCD
A B C D
DCBA
D C B A
A**D
A D
*BC*
B
C
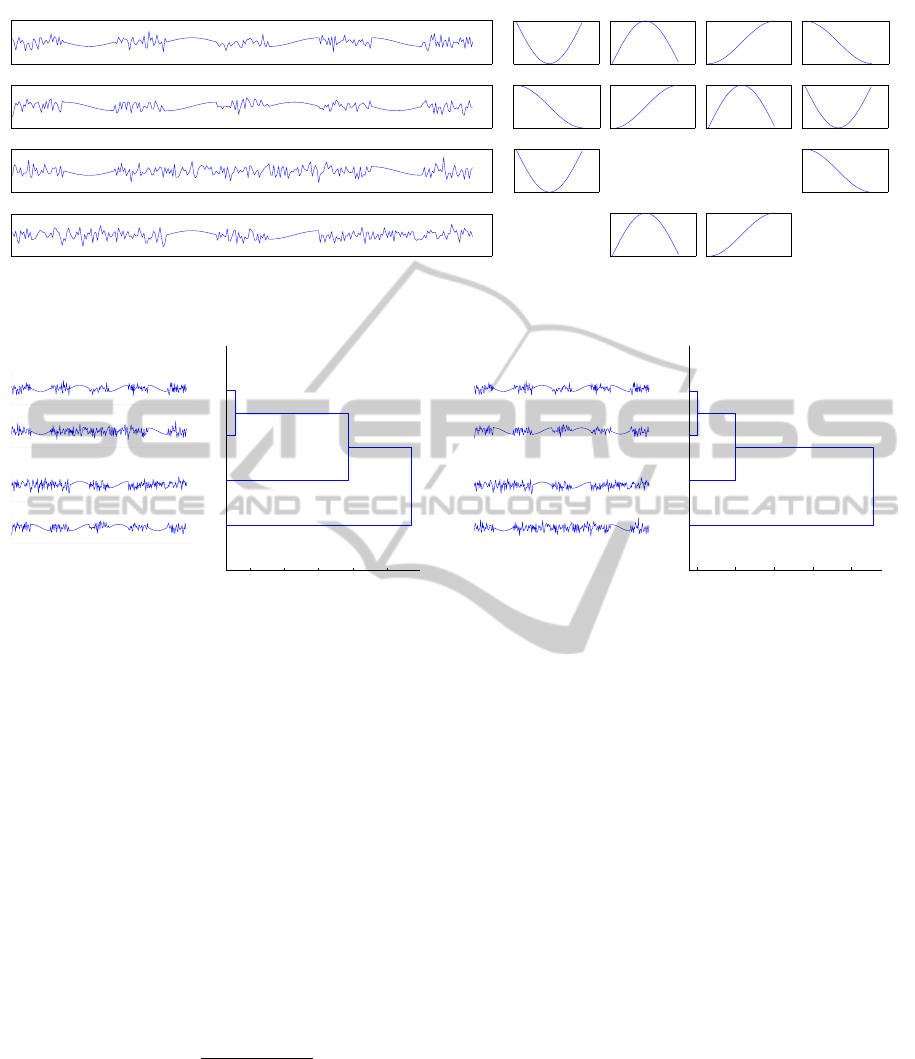
Figure 1: Sample data set of normally distributed pseudo-random time series (named as ABCD, DCBA, A**D and *BC*,
illustrated left) with artificially implanted sinus patterns (labeled as A to D, presented in their occurring order on the right).
ABCD
A**D
*BC*
DCBA
19 19.5 20 20.5 21
ABCD
DCBA
*BC*
A**D
0.005 0.01 0.015 0.02 0.025
Figure 2: Agglomerative hierarchical cluster tree (dendrogram) of synthetic time series data (introduced in Figure 1) according
to the Dynamic Time Warping (left) and our proposed Order-Invariant Distance (right), where the x-axis reveals the distance
between the time series being merged and the y-axis illustrates the corresponding name and shape of the signal.
be classified in single dots and lines of different di-
rection (Marwan, 2008; Marwan et al., 2007). We are
especially interested in lines that run parallel to the
main diagonal, which occur when the trajectories of
two sub-sequences are similar.
In order to go beyond the visual impressions
yielded by Cross Recurrence Plots, several measures
of complexity which quantify the small-scale struc-
tures have been introduced and are known as Recur-
rence Quantification Analysis (RQA) (Marwan, 2008;
Marwan et al., 2007). These measures are based on
the recurrence matrix R(ε) considering a certain ε-
neighborhood. Commonly used measures include re-
currence rate, determinism, entropy as well as average
diagonal line length L:
L(ε,l
min
) =
∑
N
l=l
min
l · P(ε, l)
∑
N
l=l
min
P(ε,l)
(5)
where
P(ε,l) =
N
∑
i, j=1
{(1−R
i−1, j−1
(ε))
· (1− R
i+l, j+l
(ε))
·
l−1
∏
k=0
R
i+k, j+k
(ε)}
(6)
is the histogram of diagonal line of length l. The fre-
quency and length of the diagonal lines are obviously
related to a certain similarity between the dynamics of
both time series. A measure based on the lengths of
such lines can be used to find non-linear interrelations
between two time series, which cannot be detected
by the common cross-correlation function (Marwan
et al., 2007). To this end, we propose the reciprocal
average diagonal line length of a Cross Recurrence
Plot as an Order-Invariant Distance (OID) measure
for time series that exhibit similar sub-sequences at
arbitrary positions in time.
OID = 1/L (7)
5 CASE STUDY
In this section we demonstrate the practicality of
our proposed Order-Invariant Distance measure on a
sample data set of synthetic time series. As illustrated
in Figure 1, we consider four different normally dis-
tributed pseudo-random time series with artificially
implanted sinus patterns. The first two time series
comprise the same sub-sequences in reverse order,
KDIR2012-InternationalConferenceonKnowledgeDiscoveryandInformationRetrieval
266
ABCD
DCBA
ABCD
A**D
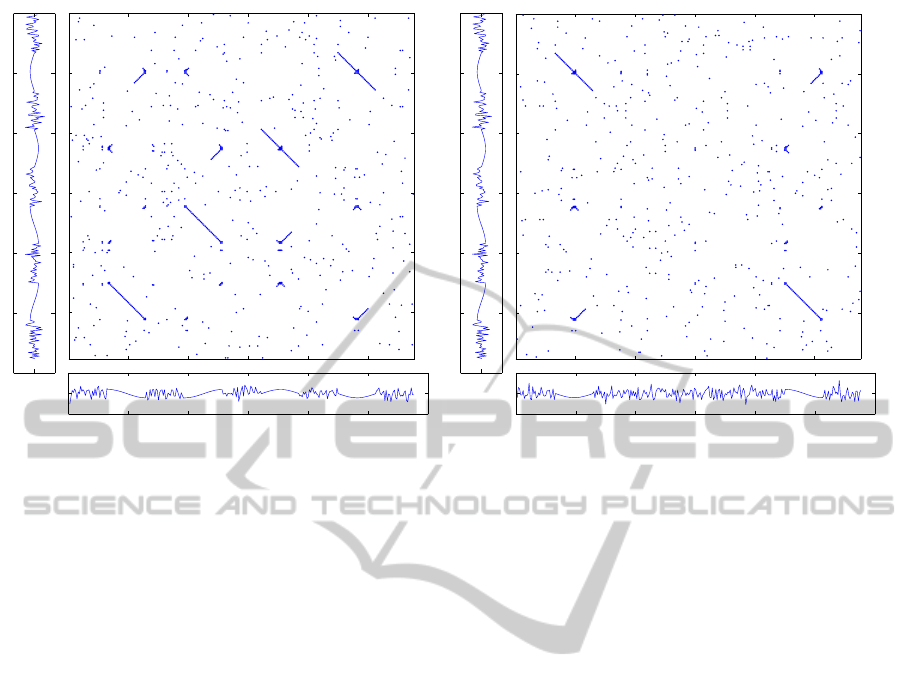
Figure 3: Cross Recurrence Plot (CRP) of synthetic time series ABCD and DCBA (left) as well as ABCD and A**D (right)
introduced in Figure 1. Note that the main diagonal runs from upper left to bottom right.
whereas the last two time series contain a subset of
the artificially implanted signals.
Figure 2 shows a direct comparison of Dynamic
Time Warping and our introduced Order-Invariant
Distance measure. As expected, the hierarchical clus-
ter tree generated by means of DTW indicates a rela-
tively small distance between the time series ABCD,
A**D and *BC*, because they exhibit similar sub-
sequences at the same positions. However, DTW
treats the time series DCBA as an outlier, due to the
artificially implanted patterns occurring in reverse or-
der. In contrast, the OID measure considers the time
series ABCD and DCBA as most similar, because the
order of the matched patterns is disregarded. Further-
more, the dendrogram generated by means of OID re-
veals that the time series A**D and *BC* are dissim-
ilar to ABCD and DCBA, which is due to the fact that
the overlap of same or similar sub-sequences is rela-
tively small (≤ 50%).
Figure 3 illustrates the Cross Recurrence Plots of
the time series ABCD and DCBA as well as ABCD
and A**D introduced in Figure 1. Lines parallel to
the main diagonal (from upper left to bottom right) in-
dicate similar sub-sequences in both time series. The
average diagonal line length L is higher for the Cross
Recurrence Plot of the time series ABCD and DCBA
than for the CRP of the pair ABCD and A**D. Since
we want similar time series to have a small distance,
our proposed Order Invariant Distance measure is de-
fined as the reciprocal of the average diagonal line
length (refer to Equation 7).
The presented results serve to demonstrate the ca-
pabilities of the proposed Order-Invariant Distance
measure, rather than to draw any conclusions without
full evaluation. However, we strongly believe that the
introduced OID measure is suitable to determine the
(dis)similarity of time series which exhibit same or
similar sub-sequences at arbitrary positions in time.
6 CONCLUSIONS
In this paper we introduced order invariance for time
series, which has, to our knowledge, been missed by
the community. Hence, we proposed a novel Order
Invariant Distance measure which is able to deter-
mine the (dis)similarity of time series with similar
sub-sequences at arbitrary positions in time.
In addition, we demonstrated the practicality of our
proposed OID measure on a sample data set of syn-
thetic time series with artificially implanted patterns.
We strongly believe that order invariance is an im-
portant consideration for many real-life data mining
applications. Our future work will include a full eval-
uation on publicly available data.
REFERENCES
Batista, G. and Wang, X. (2011). A complexity-invariant
distance measure for time series. SIAM Internation
Conference on Data Mining (SDM)on Data Mining,
Philadelphia, PA, USA.
Ding, H., Trajcevski, G., Scheuermann, P., Wang, X., and
Keogh, E. (2008). Querying and mining of time series
AnOrder-invariantTimeSeriesDistanceMeasure-PositiononRecentDevelopmentsinTimeSeriesAnalysis
267

data: experimental comparison of representations and
distance measures. Time, 1(2):15421552.
Keogh, E. (2003). Efficiently finding arbitrarily scaled pat-
terns in massive time series databases. volume 2838 of
Lecture Notes in Computer Science, pages 253–265.
Springer Berlin / Heidelberg.
Keogh, E. and Ratanamahatana, C. A. (2005). Exact in-
dexing of dynamic time warping. Knowl. Inf. Syst.,
7(3):358–386.
Lin, J., Keogh, E., and Lonardi, S. (2004). Visualizing
and discovering non-trivial patterns in large time se-
ries databases. In ACM SIGKDD International Con-
ference on Knowledge Discovery and Data Mining,
volume 4, page 61. SAGE Publications.
Marwan, N. (2008). A historical review of recurrence
plots. The European Physical Journal Special Topics,
164(1):3–12.
Marwan, N., Carmenromano, M., Thiel, M., and Kurths, J.
(2007). Recurrence plots for the analysis of complex
systems. Physics Reports, 438(5-6):237–329.
Spiegel, S., Gaebler, J., Lommatzsch, A., De Luca,
E., and Albayrak, S. (2011a). Pattern recognition
and classification for multivariate time series. In
KDD-2011: Proceeding of ACM International Work-
shop on Knowledge Discovery from Sensor Data
(SensorKDD-2011), San Diego, CA, USA. ACM.
Spiegel, S., Jain, B.-J., De Luca, E., and Albayrak, S.
(2011b). Pattern recognition in multivariate time se-
ries - dissertation proposal. In CIKM 2011: Proceed-
ings of 4th Workshop for Ph.D. Students in Informa-
tion and Knowledge Management (PIKM 2011), Glas-
gow, UK. ACM.
KDIR2012-InternationalConferenceonKnowledgeDiscoveryandInformationRetrieval
268
