
Knowledge Discovery in the Smart Grid
A Machine Learning Approach
Aldo Dagnino
ABB Corporate Research, ABB Inc., 940 Main Campus Drive, Raleigh, NC, U.S.A.
Keywords: Machine Learning, Smart Grid, Knowledge Discovery, Fault Prognostics.
Abstract: The increased availability of cheaper sensing technologies, the implementation of fibre-optic networks, the
availability of cheaper data storage repositories, and development of powerful machine learning models are
fundamental components that provide a new facet to the concept of the Smart Power Grid. An important
element in the Smart Grid concept is predicting potential fault events in the Smart Power Grid, or better
known as fault prognostics. This paper discusses an approach that uses machine learning methods to
discover fault event-related knowledge from historical data and helps in the prognostics of fault events in
power grids and critical and expensive components such as power transformers circuit breakers, and others.
1 INTRODUCTION
Recent technological advances in sensor
technologies, fibre-optic networks, cheaper data
storage capabilities, powerful data mining
techniques, and faster computing power coupled
with the need of improving the efficiency of
electrical power utilization have contributed to the
development of smarter power grids in the
transmission and distribution industries. Utilities are
increasingly interested in incorporating sensor
technologies to expensive assets such as power
transformers, circuit breakers, and back-up batteries,
in overhead and underground transmission lines and
connecting equipment. Many utilities are developing
fibre-optic networks that allow the transmission of
data from sensors to central data repositories.
2 THE SMART GRID
The existing power grids consist of multiple power
networks that coordinate their operations using
various levels of communication and control
mechanisms, which are primarily manually
controlled. The primary elements of the Smart Grid
include: (a) data; (b) information; (c) intelligence;
(d) communications (Mousavi, 2009). Data elements
are supplied by sensors embedded in different
components of the grid. The information element is
delivered by processors that perform certain
operations on data. The intelligence element is
generated by processing data and information via
analytics models. The communications element is
required to deliver data, information, and
intelligence to the right decision making agent in the
right format at the right time. The IEEE – Power and
Energy Society (IEEE-PES) and the National
Institute of Standards (NIST) have developed a
conceptual model for the Smart Grid that defines
seven important domains: Bulk Generation,
Transmission, Distribution, Customers, Operations,
Markets, and Service Providers.
3 FAULTS IN THE SMART GRID
Machine learning approaches have been utilized to
forecast fault events in the power distribution grid
and in critical equipment. This section discusses
how machine learning models were utilized
determine; (a) fault vulnerability profiles in power
distribution grids; (b) equipment fault forecasting.
3.1 Power Grid Fault Prognostics
Power distribution is typically managed by power
substations that receive power from the transmission
lines and distribute electrical power through feeders
to consumers. In addition of the equipment within
the substation, the typical distribution grid is
composed of equipment such as distribution
366
Dagnino A..
Knowledge Discovery in the Smart Grid - A Machine Learning Approach.
DOI: 10.5220/0004144303660369
In Proceedings of the International Conference on Knowledge Discovery and Information Retrieval (KDIR-2012), pages 366-369
ISBN: 978-989-8565-29-7
Copyright
c
2012 SCITEPRESS (Science and Technology Publications, Lda.)

transformers, switches, fuses, power lines
(underground or overhead), and relays. Utilities are
very interested in fault prognostics in the power
distribution grid to minimize power disruptions to
customers. Faults in the distribution grid are
typically related with power line fatigue, burned
fuses, lightning falling on equipment (such as
distribution transformers, etc.), short circuits, animal
contacts, trees and tree branches falling on assets,
weather related faults to overhead or underground
equipment, faults in splicing, power lines touching
each other, and many more. Currently, the vast
majority of utilities are reactive to faults and they
manually deal with a contingency. There are many
factors identified in the literature that can cause fault
events in a power distribution grid (Lu, 2010). These
factors can be broadly classified into (a) physical
properties of the distribution grid; (b) electrical
values of grid; (c) weather conditions; (d) assets or
components degradation in the grid; and (e) type of
grid infrastructure (see Figure 1). The work
described in this paper has been focused on the
prognostics of faults in two primary areas: (a) the
forecast of fault events in a distribution grid; (b)
forecasting potential faults to expensive assets such
as power transformers in either the transmission or
distribution network. Forecasting fault events in the
distribution grid has been conducted by utilizing
historical data on weather conditions, grid electric
value readings at the time of a fault event, and the
type of grid infrastructure. Forecasting faults on
expensive assets has been conducted by analyzing
the condition of power transformers utilizing
historical data collected while performing dissolved
gas analyses and other tests. This investigation was
conducted with an Investor Own Utility (IOU)
partner in the US. Several types of historical datasets
associated with the IOU were collected and utilized
during this investigation. The historical dataset types
utilized include: (a) fault data and electrical values
from the IOU; (b) weather data; (c) infrastructure
type of the IOU. The fault data from the IOU was
collected utilizing an automated system of intelligent
electronic devices (IED’s) with sensing and analytic
capabilities located at power feeders. These IED’s
monitor electrical values from the distribution lines
and are able to detect a fault event in the grid after it
occurred. The fault data includes these electrical
values, and was also corroborated with data entries
documented by IOU engineers after restoring
service. The weather data was collected from the US
National Weather Service (NWS) and from the
WeatherBug (WBUG) weather services. The NWS
data was collected by their weather station every
five minutes in METAR format. The WeatherBug
data was collected from small weather stations
located in various locations close to the different
substations of the IOU.
Figure 1: Fault factors in Smart Grid.
3.2 Machine Learning for Forecasting
Power Distribution Grid Fault
Events
Supervised classification machine learning
techniques were utilized to forecast the occurrence
of faults in the distribution power grid of the IOU.
Four supervised classification machine learning
algorithms were utilized to conduct the analyses:
Neural Networks (NN), kernel support vector
machines (KSVM), decision-tree based
classification (recursive partitioning; RPART), and
Naïve Bayes (NB). Five analyses were conducted
utilizing these four algorithms: (a) fault event
prediction; (b) grid zone prediction; (c) substation
prediction; (d) type of grid infrastructure; (e) feeder
number prediction.
3.2.1 Fault Prediction Models
Four models were created to identify weather
patterns that are most likely to result in a fault event
using the NN, KSVM, RPART, and NM algorithms.
The models were constructed by taking weather data
points joined to fault events, as well as random
weather data samples when no fault events were
recorded in the selected IOU substations. The
dataset contained a total of 3471 records (1725 with
faults and 1746 without faults), of which 2430 were
used for training each of the four models and 1041
for testing the models. The output of these models
shows a prediction of the weather conditions for
which a fault event may or may not occur. The best-
Weather
Component
Degradation
Physical
Properties of
Distribution
Grid
Volume
precipitation
Snow precipitation
Storms
Temperature
(outdoor, indoor)
Humidity
Ice formation
Insulator integrity
levels
Zinc coating
degradation
Cable (OH)
sagging
Cable (OH)
strand fatigue
Rate of cable
(OH) breaks
Infrastructure
Type
Overhead
(OH)
Underground
(UG)
Type of UG cable
connectors
Temperature at (UG)
cable joints
Material of cables
Transmission
temperature profiles
Maximum conductor
tension limits
Cable operation
temperature (OH)
Type of cables (OH)
Materials of poles
Pole foundation
characteristics
Voltage profiles of
network
Temperatures of circuit
breakers
Temperatures of line
connectors
Temperatures of
transformers
Age of grid assets
Wind (speed,
direction)
Urban or
rural grid
Asset degradation
Grid Electrical
Values
Pre-Fault
Power
Values
Pre-Fault
Current
Values
Pre-Fault
Voltage
Values
Lightning
parameters
Pressure
Factors that can
cause fault events in
distribution grids
Temperatures of
disconnectors
KnowledgeDiscoveryintheSmartGrid-AMachineLearningApproach
367

performing model was the one created with the feed-
forward trained by a multi-layer perceptron back-
propagation Neural Network algorithm with an f-
measure of 75%.
3.2.2 Zone Prediction Models
The four zone prediction models were trained by
considering fault historical data from the IOU grid
and weather data. Of the 1725 records with faults
and weather data, 70% were used for training and
30% for testing the trained models. The output of
these models predict in what zone (AMZ, UMZ,
PMZ) on the IOU grid the fault occurred. The best-
performing model was the one created training a
Neural Network algorithm. The model contains one
hidden layer with 20 nodes, and produces an
accuracy of 66%, an average precision of 69%, an
average recall of 68%, and an f-measure of 68%.
3.2.3 Substation Prediction Models
The four substation prediction models were trained
by considering fault historical data from the IOU
grid and weather data. Of the 1725 records with
faults and weather data, 70% were used for training
and 30% for testing the trained models. The output
of these models predicts the IOU substation ID
where the fault occurred. The best performing model
was the one created with the recursive partitioning
algorithm and produces an accuracy of 59%, an
average precision of 66%, an average recall of 54%,
and an f-measure of 59%.
3.2.4 Infrastructure Prediction Models
The four infrastructure prediction models were
trained by considering fault historical data from the
IOU grid and weather data. Of the 1725 records with
faults and weather data, 70% were used for training
and 30% for testing the trained models. The output
of these models predicts the type of infrastructure
(overhead or underground) on the section of the IOU
grid where the fault occurred. The best-performing
model was the one created training a Neural
Network algorithm with an f-measure of 57%.
3.2.5 Feeder Prediction Models
The four feeder prediction models were trained by
considering fault historical data from the IOU grid
and weather data. Of the 1725 records with faults
and weather data, 70% were used for training and
30% for testing the trained models. The output of
these models predicts the IOU Feeder where the
fault occurred. The best-performing model is the one
created with the recursive partitioning algorithm
with an f-measure of 74%.
3.3 Machine Learning for Forecasting
Fault Events in Assets
Many utilities have deployed diverse types of
sensors in their mission critical and expensive assets
such as power transformers. When monitoring
power transformers two types of on-line
measurements can be collected: (a) operational
information such as voltage, load, current, oil
temperature, winding temperatures, pump status, fan
status, cooling system status, etc; (b) condition
information, such as oil quality, gassing, dielectric
properties, aging, etc. Utilities use a variety of
sensors in their transformers and such sensors have
different monitoring capabilities, especially in terms
of the types and concentrations of gasses in the oil of
the transformers. Some time utilities supplement the
monitored concentration of gasses by conducting a
dissolved gas analysis (DGA) test periodically. A
study has been completed with the objective of
developing analytical models based on data mining
to identify patterns in gas concentrations, to identify
trends of gas concentrations that may lead to
catastrophic failures of equipment, and in general to
identify correlations between observations that
would result in new knowledge or confirm existing
heuristic knowledge about power transformers. The
example presented below does not identify the name
of the utility with which this study was conducted.
Hence, we refer our customer as Utility A. In our
example, Utility A had a fleet of over 300 power
transformers and had historical data collected for a
period of ten years. The historical data collected
included DGA analysis tests for all transformers
(concentration of H2, CH4, C2H6, C2H4, C2H2,
CO, CO2, O2, N2, and moisture), ID transformer
data (transformer name, type, age, pump type,
construction type, and conservator type), oil
temperature, winding temperature, and fluid quality
(metal particles present in oil). Utility A installed
sensors in its transformers fleet and recently
installed a fibre-optic network that helped to
transmit the monitored data into a central repository.
The objective was to develop a profile of
potential “hot spots” in power transformers where
the concentration of CO, CO2, and O2 are high (CO
> 571 parts per million, CO2 > 4001 ppm, and O2 >
10,000 ppm) and oil temperatures need to be
monitored so they do not exceed values > 150 C.
These conditions can show deterioration of the
KDIR2012-InternationalConferenceonKnowledgeDiscoveryandInformationRetrieval
368
insulation of the windings. The following data sets
were employed to conduct the data mining analyses:
(a) Transformer Description Database: that includes
the following data attributes: SERIAL_NUMBER,
AGE, CONSTRUCTION_TYPE; (b) Gasses
Concentration Database: concentrations in parts per
million (ppm) of the following gasses: H2, CH4,
C2H6, C2H4, C2H2, CO, CO2, O2, N2, and
MOISTURE. The data availability studied for this
case includes 335 power transformers for which
gasses data concentrations have been collected
during 10 years. The total number of gasses
concentration observations is 3100. The working
dataset analyzed includes the fusion of both the
transformer description and combustible gasses
concentration databases. Entries with missing data
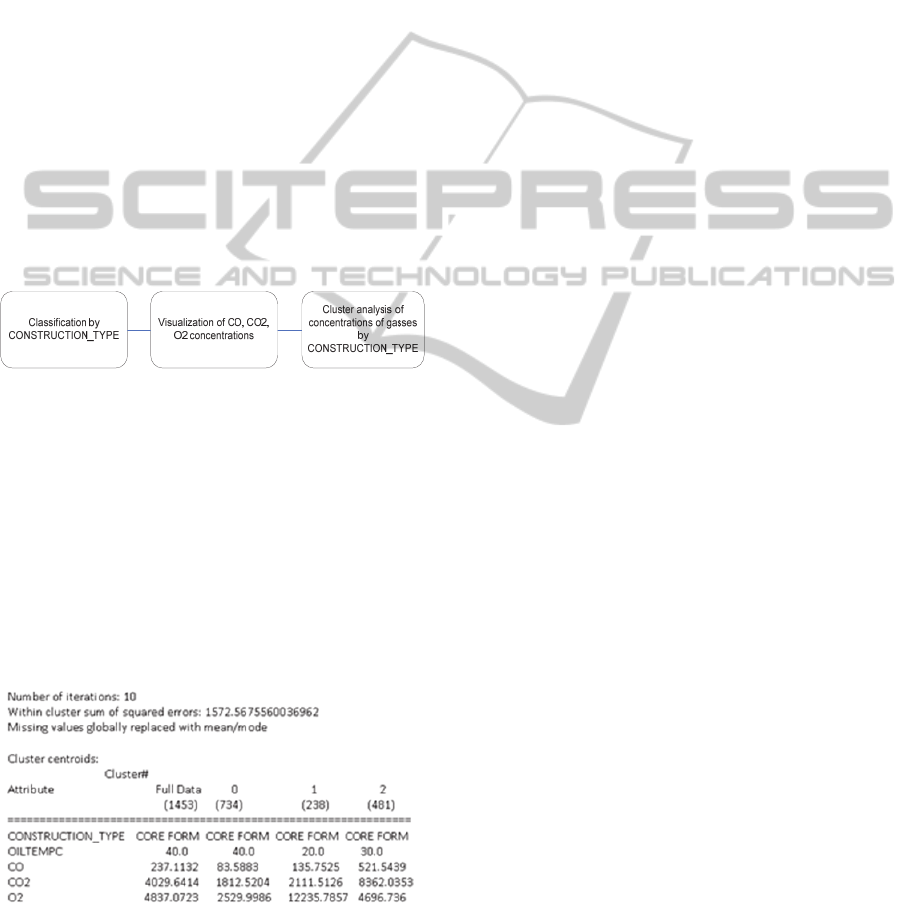
points were removed from the analysis. Figure 2
shows the sequence of machine learning approaches
utilized for this analysis. First, the data was
classified based on the CONSTRUCTION _ TYPE
of the transformers (where transformers can be
Core_Form and Shell_Form).
Figure 2: CO, CO2, and O2 Concentration Analysis.
With this classification completed, CO, CO2, and
O2 gasses concentrations were identified for each of
the construction types. Also, a cluster analysis was
conducted with all data using the SimpleKMeans
algorithm and the clusters shown in Table 1 were
obtained. Sixty percent of the data was utilized to
train the algorithm and forty percent of the data was
utilized to test the algorithm. The data mining open
source tool utilized for this analysis was Weka.
Table 1: Cluster Analysis of CO, CO2, and O2
Results from these analyses suggest that the number
of CORE_FORM transformers that has high
concentrations of O2 is larger than SELL_FORM or
TPN-V CORE_FORM. Similarly, Fig. 8 shows that
CORE_FORM transformers have the largest number
of CO2 gas concentration. Results also suggest that
CORE_FORM transformers have the highest
concentration of CO gas. The results of the analyses
above show that a utility with a fleet of transformers
that have CORE_FORM construction type should
pay to the temperature of these transformers if the
concentrations of CO, CO2, and O2 are in dangerous
concentration neighbourhoods (CO > 571 parts per
million, CO2 > 4001 ppm, and O2 > 10,000 ppm).
After running the cluster algorithm, Table 1 shows
that a cluster of 481 transformers (cluster 2) have
high concentrations of CO and CO2 with moderate
concentration of O2. For this cluster of transformers,
it is important to monitor temperatures and also
concentration of O2.
4 CONCLUSIONS
The development of smart sensors, fibre-optic
networks, large data storage repositories, powerful
hardware, and robust machine learning algorithms
are becoming important elements that bring the
concept of the Smart Grid to the forefront. The
objective of the work presented in this paper is to
demonstrate that machine learning models can be a
powerful element of the Smart Grid concept.
Machine learning can be utilized for diagnostics and
forecasting of faults in a power transmission and
distribution grid. This is an important element of the
concept of the Smart Grid.
REFERENCES
Heine, P., Turunen, J., Lehtonen, M., Oikarinen, A., 2005,
Measured Faults During Lightning Storms , Proc.
IEEE Power Tech 2005, Russia, pp.1- 5.
Lu, N., Taylor, T., Jiang, W., Jin, C., Correia, J., Leung,
L., and Wong, P. C., 2010, Climate Change Impacts
on Residential and Commercial Loads in the Western
U.S. Grid, IEEE Transactions on Power Systems, Vol.
25, No. 1, pp. 480 – 488.
Mousavi, M., Donde, V., Stoupis, J., McGowan, J., Tang,
L., 2009, Information, not Data: Real-time automated
distribution event detection and notification for grid
control, ABB Review Journal, The Corporate
Technical Journal of the ABB Group, no. 3, pp. 38-44.
Wei, C., 2010, A Conceptual Framework for Smart Grid,
IEEE, 978-1-4244-4813-5.
KnowledgeDiscoveryintheSmartGrid-AMachineLearningApproach
369
