
Modelling How Students Organize Knowledge
Ismo T. Koponen
Department of Physics, University of Helsinki, Helsinki, Finland
Keywords:
Knowledge Organization Patterns, Concept Maps, Directed Networks, Learning.
Abstract:
We discuss here how students organize their knowledge (in physics) by connecting closely related concepts.
Attention is paid on the relational structure of the ordering of concepts so that the introduction of new concepts
is justified on the basis of concepts which have already been learned. Consequently, there is then direction of
progress in introducing new concepts - there is ”flux of information” so that what was learned before is the
basis for learning new conceptual knowledge. Such ordered and directed process of introducing the concepts
can be conveniently described and analysed in the framework of directed ordered graphs. We propose here a
model of knowledge organization for such concept maps. The model is based on the assumption that students
use simple procedures connecting new concepts mostly to concepts introduced few steps before. On basis of
the model results we suggest that the most important properties of concept maps can be understood on a basis
of such simple rules for organising knowledge.
1 INTRODUCTION
Scientific knowledge is quite often described as webs
or networks, where concepts are linked to other con-
cepts and principles; concepts are thus conceived as
parts of the whole system of knowledge. In such a
picture of knowledge, it is evident that the existing
structure and relations within it also affect how the
new concepts can be introduced (as parts of the net-
works) and how the conceptual knowledgecan be rep-
resented and transferred forward (Thagard, 1992; No-
vak, 2002; O’Donnell et al., 2002). Consequently,
knowledge processing and acquisition have been re-
cently discussed within the framework of network
theory (Costa, 2006; Batista and Costa, 2010; Goni
et al., 2010). Such an approach seems to be well
adapted also in describing knowledge processing in
learning, in particular how students organize their
conceptual knowledge and, on the other hand, how
conceptual knowledge can be approached in learning
and teaching (Koponen and Pehkonen, 2010; Kopo-
nen and Nousiainen, 2012).
In teaching and learning the network of concepts
is often represented by using concept maps (McClure
et al., 1999; Novak, 2002; O’Donnell et al., 2002;
Koponen and Pehkonen, 2010). Here we focus on
the question, can we possibly understand the local
and global structure of concept maps by making as-
sumptions about the rules or strategies students may
have used in construction of the maps. The empiri-
cal sample discussed here consists of concept maps
made by physics teacher students for purposes of or-
ganising content knowledge for teaching. The linking
of concepts is done by paying attention on how con-
cepts are used in quantitative experiments and con-
struction of models. As we have shown previously
(Koponen and Nousiainen, 2012), such students con-
cept maps representing their knowledge of (or about)
physics concepts can be analysed conveniently and re-
liably within the theoretical framework based on di-
rected ordered graphs (Karrer and Newman, 2009;
Goni et al., 2010). Here we develop a phenomeno-
logical model for knowledge ordering based on di-
rected ordered graphs (DOGs). We show that the typ-
ical structural features of students’ concept maps can
be modelled by assuming that concepts are mostly re-
lated to nearby concepts one or two concepts away,
with few links between concepts about 10-15 steps
away. When concepts are introduced in this way in
ordered succession, substantial number of triangular
patterns (as found in the real networks) are quite nat-
urally generated. Comparison of the model results
with the real student concept maps shows that the
model reproduces the salient properties of connected-
ness and ordering found on students’ concept maps.
Consequently, the results suggest that students indeed
use simple but effectivestrategies in ordering and pro-
cessing their knowledge.
143
Koponen I..
Modelling How Students Organize Knowledge.
DOI: 10.5220/0004105201430148
In Proceedings of the International Conference on Knowledge Engineering and Ontology Development (KEOD-2012), pages 143-148
ISBN: 978-989-8565-30-3
Copyright
c
2012 SCITEPRESS (Science and Technology Publications, Lda.)

2 CONCEPT NETWORKS
The relational structure of concepts can be thought
as network-like node-link-node representations of the
relations between concepts. For different types of rep-
resentations there are different ways of establishing
the relations and different rules in regard to linking
the concepts, but the skeletal structure of the concept
network is always a network of nodes (i.e. concepts)
connected by links. The concept networks studied
here are done by physics teacher students for purposes
of representing how they think concepts can be intro-
duced in teaching, so that each step is justified either
on basis of experiments or model, which are both cen-
tral procedures connected to the construction and use
of knowledge. It is then natural to assume that these
procedures of the experiments and modelling play an
important role in conferring the structure of the con-
cept networks. In the operationalizing experiment
the concept is operationalized i.e. made measurable
through the pre-existing concepts. The new concept
or law is constructed sequentially, starting from the al-
ready existing ones, which provide the basis for an ex-
periment’s design and interpretation. In its most ide-
alized form the new concept (or law) C is formed on
the basis of two pre-existing concepts A and B so that
the operationalization creates C on the basis of the re-
lations A → C and B → C, but which also requires
that A and B can be related as A → B. There is then
a triangular mutual dependence A → B → C ← A.The
modelling procedures, which in the simplest cases are
often deductive procedures, produce very similar pat-
terns (Koponen and Pehkonen, 2010; Koponen and
Nousiainen, 2012). It is interesting to note cognitively
oriented studies of knowledge formation suggest that
procedures of knowledge construction and processing
may be simple ones, reducible to basic patterns, even
in those cases where the resulting structures are com-
plex. In that,triangular patterns have been recognized
as an essential feature not only in the case of func-
tional knowledge but also in information acquisition
as well as information processing (Kemp et al., 2007;
Kemp and Tenenbaum, 2008; Duong et al., 2009).
The procedures of constructing experiments and
models – connecting concepts to previously intro-
duced concepts – then provide the context or the “af-
filiations” of concepts. Concept maps where these
procedures are used to connect concepts represent
then not only the relatedness of concepts, but they
also represent how concepts are introduced in teach-
ing so that knowledge learned earlier is the basis upon
which new knowledge is built. This means that, in a
sense, these networks also represent the ”flux of in-
formation” which students have planned to take place
in their teaching. In well-planned teaching there
should naturally be a regular flux of information (for
evenly paced learning of new knowledge), but no
unnecessary abrupt changes in that flux (otherwise
the demand to assimilate new knowledge would vary
much); moreover, uncontrollable reductions in the
flow should be hindered to prevent the impression that
learned knowledge would not be needed in further
learning (Koponen and Nousiainen, 2012).
3 THE METHOD OF ANALYSIS
The properties of ordering and information flux in
the concept maps are explored by using the quantities
based on theory of directed ordered networks (DOGs)
(Karrer and Newman, 2009; Goni et al., 2010). Be-
cause we are interested in the connectedness and in-
formation fluxes in the maps, we use the follow-
ing quantities (detailed mathematical definitions are
given in Table 1):
1. The degree k
i
of the node, which is the number
of the incoming and outgoing links k
in
and k
out
,
respectively. The average degree is denoted by D;
2. The clustering coefficient C
i
, which is the ratio
of triangles to all the triply connected neighbours
around a given concept;
3. Flux into the nodes (Flux-I) Φ
i
, which gives the
total number of links terminating at the givennode
k from all levels j < k;
4. Flux around the nodes (Flux-A) Ψ
k
, which gives
the total number of links bypassing the given node
k from all levels j < k.
In the present case, fluxes Φ and Ψ directly describe
the ”information” flowing from the previously in-
troduced nodes to ones introduced later (Karrer and
Newman, 2009). The most important aspect of the
concept maps made by teacher students is their or-
dering and appreciably large clustering with C ≈ 0.2.
Both features follow from the procedures that are used
to connect concepts. It is of interest to develop a sim-
ple model, which captures these features. In addition
to these features the model should also reproduce the
steady node-by-node information flows Ψ and Φ.
4 THE MODEL
The cases studied and modelled here consist of 8 stu-
dent maps, all of which are rather rich in their struc-
ture. The number of the concepts was limited to n=34
most central concepts (in electromagnetism). Details
KEOD2012-InternationalConferenceonKnowledgeEngineeringandOntologyDevelopment
144
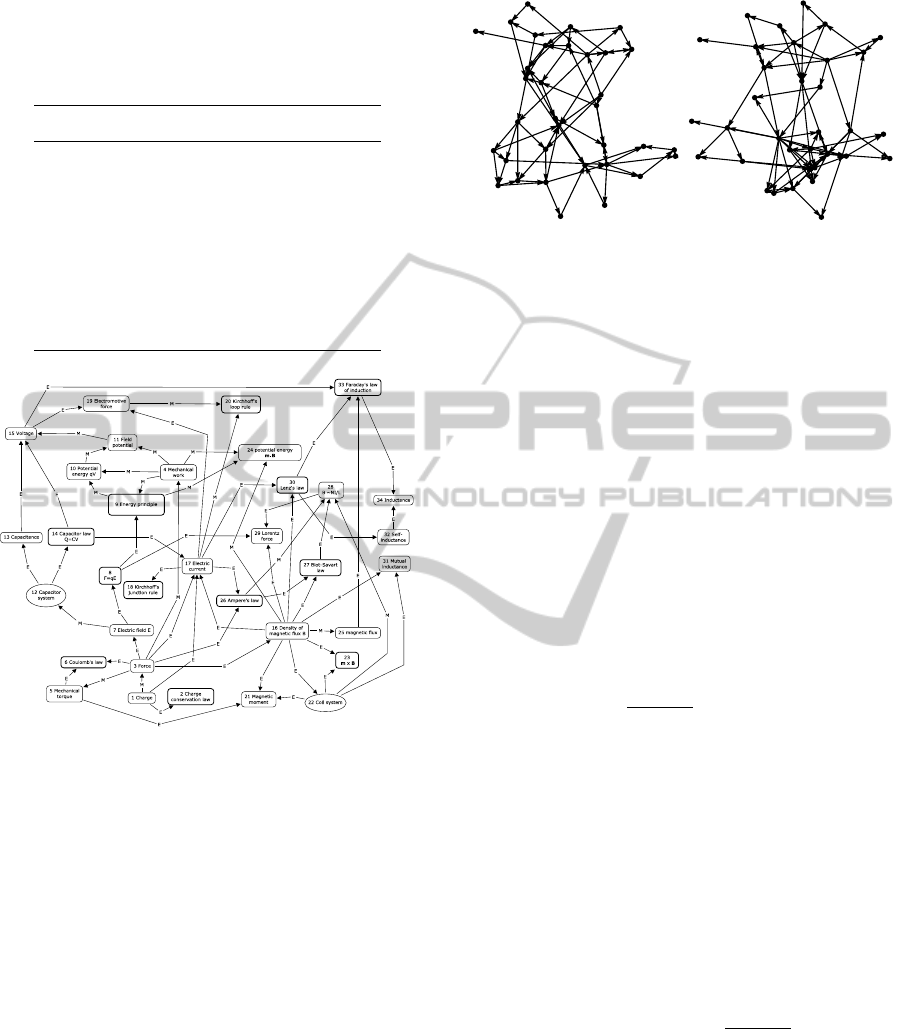
Table 1: Definitions of the quantities characterizing the
topology of the concept networks. In the definitions a
ij
is
the element of the adjacency matrix a and N is the number
of nodes. The quantities are defined for a given node i. The
average number of links k
i
per node is denoted by D.
Quantity Definition
k
in
i
∑
j
a
ji
k
out
i
∑
j
a
ij
k
i
∑
i
k
in
i
+ k
out
i
C
i
∑
j
′
> j
˜a
ij
˜a
j j
′
˜a
ij
′
/
∑
j
′
> j
˜a
ij
˜a
ij
′
Φ
i
∑
i−1
j=1
k
out
j
−
∑
i−1
j=1
k
in
j
/D
Ψ
i
∑
i−1
j=1
k
j
out
−
∑
i
j=1
k
in
j
/D
Figure 1: An example of students’ concept maps (Gs) for
n = 34 concepts in electromagnetism. The map shows con-
cepts (boxes), laws and principles (boxes with thick bor-
ders). Links are either operationalising experiments (E) or
modelling procedures. The nodes are numbered in the order
in which they are introduced through experiments.
of the maps are not of interest here and are discussed
in detail elsewhere (Koponen and Nousiainen, 2012).
An example of the original concept maps made by
students is shown in Fig.1
For purposes of comparison and reference, we
have also constructed a ”master map”, where all
well-motivated and well-justified connections that are
found in the student maps are collated into one map.
For purposes of analysis it is convenient to use for
all maps the so called ”spring-embedding”(Kolaczyk,
2009), which brings about the most important nodes
as clusters of links. Examples of spring-embedded
maps (one student map and the master map) are
shown in Fig. 2.
Basic assumptions we have made about how the
learners process and represent knowledge are as fol-
1
2
3
4
5
6
7
8
9
10
11
12
13
14
15
16
17
18
19
20
21
22
23
24
25
26
27
28
29
30
31
32
33
34
1
2
3
4
5
6
7
8
9
10
11
12
13
14
15
16
17
18
19
20
21
22
23
24
25
26
27
28
29
30
31
32
33
34
Figure 2: The ”master map” (Gm) and one students’ map
(G1) in spring-embedded form.
lows: 1) New concepts are introduced on basis of
old ones so that relatively few (from two to four) of
them are used as basis of introducing the new ones;
2) The procedures provide the context or the “affili-
ation” for making the connections. 3) Concepts are
recognized on basis of the phenomenological mean-
ing. This gives rise to the modularity.
On the basis of above notions 1-3 we suggest a
model, where nodes 1,2,. . . i − 1, i, i + 1,...n are in-
troduced sequentially so that each node i + 1 is con-
nected in directed way to some of the preceding nodes
1,2,.. . i. The directionality is defined from ances-
tor nodes to new nodes. The probability distribu-
tion function (PDF) that i + 1 connects to the given
ancestor i
′
which is j steps away from it i.e. to
node i
′
= i + 1 − j is assumed to follow a gamma-
distribution
f
i, j
(α,λ) =
1
Z
i
(α,λ)
j
α−1
exp[−λj] , (1)
where parameters α and λ control the form of the dis-
tribution. The normalization Z
i
(α,λ) is obtained in
closed form in terms of the Lerch’ transcendental Phi-
function φ
κ,i
(z) ≡ φ(z,κ, i)
Z
i
(α,λ) = φ
1−α,1
(e
−λ
)−e
−λ(α−1)
φ
1−α,1+i
(e
−λ
) (2)
In practice, the detailed functional form of the dis-
tribution is not crucial, given it is peaked. Gamma-
distribution is chosen because it is flexible and the cu-
mulative distribution function (CDF) for PDF in Eq.
(1) can be given in form
F(i, j) =
j
∑
j
′
=1
f
i, j
′
=
Z
i
(α,λ)
Z
j
(α,λ)
(3)
The nodes are connected on basis of CDF in Eq. (3)
by using event based Monte-Carlo method. First, the
number N of connection attempts is selected, then for
each attempt a random number r ∈ [0, 1] is generated
and the new node is connected to ancestor node at
a distance j
∗
, obtained from r = F(i, j
∗
) by inver-
sion. In practice, values of j
∗
corresponding differ-
ent r are tabulated in advance for each i, so that the
ModellingHowStudentsOrganizeKnowledge
145

Table 2: Simulation parameters for models m-G1, m-G2
and m-G3. Subscripts A an B refer to values for modules A
and B separately, subscript AB to values between modules
A and B.
α
A
λ
A
α
B
λ
B
α
AB
λ
AB
m-G1 2 2/3 2 2/3 2 1/3
m-G2 5/2 2/5 5/2 2/5 7 1/3
m-G3 2 2/5 2 2/5 5 1/3
repeated inversion of r = F(i, j
∗
) during the simula-
tion is avoided. When connection attempt is repeated
N times same attempts to connect already connected
nodes may occur, in which case no multiple connec-
tions are allowed.
In the simulation model we have two modules A
and B (corresponding two modules in maps, for two
topical areas) and within the both modules we use the
same above explained method to connect the nodes,
but the values of the parameters α, λ, and N can be
different for modules A and B. Connection between
the nodes in different modules is also made on same
basis. The parameters for models are given in Table 2.
The networks based on these simulations are visually
very similar to students’ networks. Examples to be
compared with student networks are shown in Fig. 3.
1
2
3
4
5
6
7
8
9
10
11
12
13
14
15
16
17
18
19
20
21
22
23
24
25
26
27
28
29
30
31
32
33
34
1
2
3
4
5
6
7
8
9
10
11
12
13
14
15
16
17
18
19
20
21
22
23
24
25
26
27
28
29
30
31
32
33
34
Figure 3: The model graphs m-G1 and m-G2 in spring-
embedded form.
The analysis of the networks is carried out on basis
of their adjacency matrices a, where the variables a
ij
indicate the connections between nodes i and j so that
if nodes are connected, then a
ij
= 1 and if there is
no connection, then a
ij
= 0. All quantities of interest
can now be calculated from the matrix a as they are
defined in Table 1.
5 RESULTS
The student maps have relatively high clustering and
connectedness (Koponen and Nousiainen, 2012). On
average the clustering attains values around 0.10-
0.25, which is common to networks designed for pur-
poses of passage of information (Kolaczyk, 2009).
Large values of clustering indicate that there are ap-
preciable connections also between concepts con-
nected to a given concept, i.e. an abundance of the
nearest neighbour connections. High connectivity (on
average 3-4 links per node) means that the informa-
tion fluxes are also rather large. The fluxes are given
as a total flux per expected number of links (total flux
divided by average value D of links per node, see
Table 1 for definition. The results reveal that typi-
cally, per one link connected to a given node, there
are from three to four links coming from the lower
levels. This means that each node is rather well sup-
ported by the many previous nodes - the meaning con-
tent of the concept (node) is supported or backed up
by knowledge contained on the network existing be-
fore the introduction of the new node. In general, just
these properties must be reproduced by model which
attempts to capture the essential features of the maps.
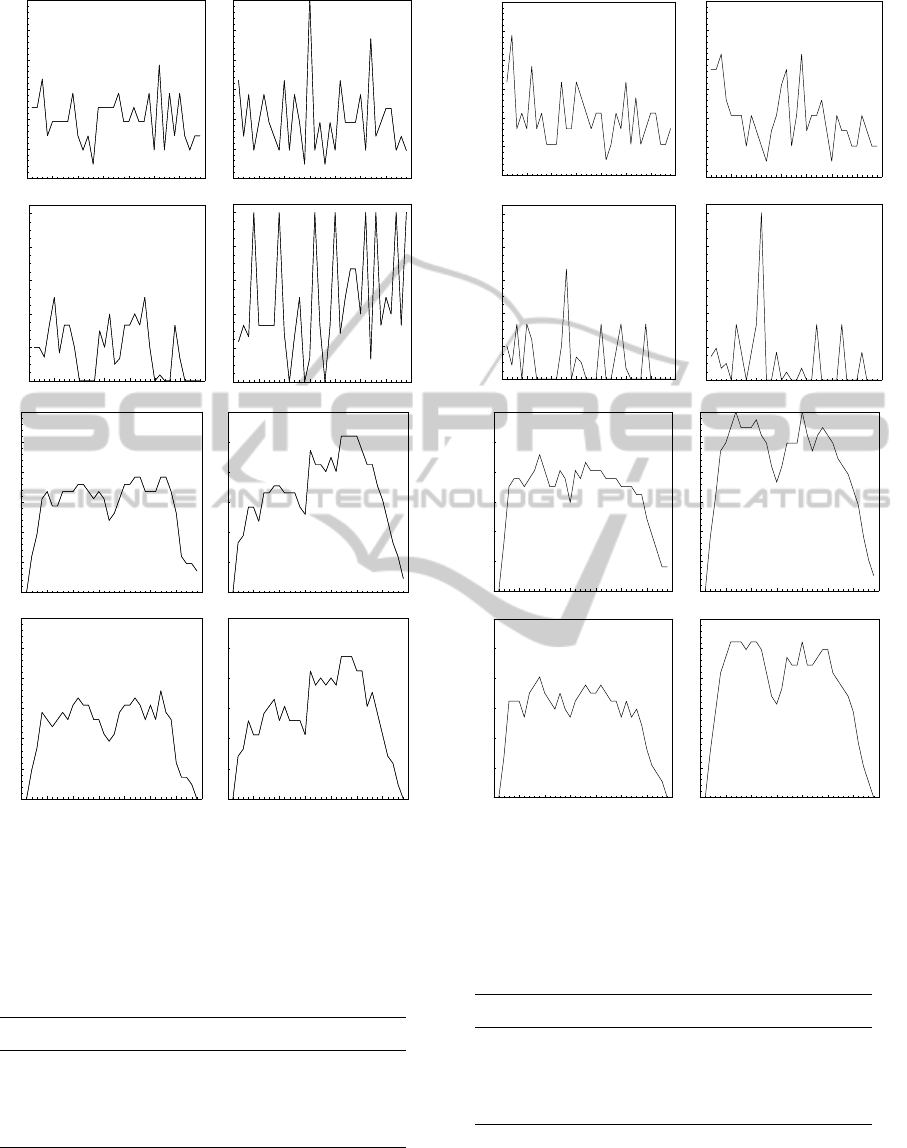
Running the simulation for different choices of pa-
rameters shows that there is a range of parameters,
where it is possible to obtain networks very similar
to the empirical ones. It should be noted that it is
not of interest (or even possible) to try to optimize
parameters so that for a given empirical network ex-
actly similar network is found in simulations. Instead,
Simulations are used to explore the ensemble of pos-
sible networks and how the measurable properties of
the networks are distributed within these ensembles
and how the values of degree D, clustering C, and
fluxes Φ and Ψ compare with the empirical obser-
vations, as is shown by results in Figs. 4 (empirical
results) and 5 (model results). The average values of
the clustering and fluxes are given in Table 3 for some
of the students’ maps and model maps. For compari-
son, some other values of students’ maps are given in
Table 4. From the results it seen that the model repro-
duces the most important qualitative features of the
maps and, in addition, quantitative agreement is sat-
isfactory taken into account the variation of measured
values within the student maps (see Table 4).
6 CONCLUSIONS
The relational structure of concepts in the concept
networks made by physics teacher students have re-
vealed that properties of such networks are domi-
nated by triangular knowledge organisation patterns
so that the structure has thus relatively high clustering
of nodes but yet performs well in passing the informa-
tion i.e. information fluxes provided the connections
are high (Koponen and Nousiainen, 2012). It is
assumed that these properties can be traced back to
KEOD2012-InternationalConferenceonKnowledgeEngineeringandOntologyDevelopment
146
è
è
è
è
è
è
è
è
è
è
è
è
è
è
è
è
è
è
è
è
è
è
è
è
è
è
è
è
è
è
è
è
è
è
ø
ø
ø
ø
ø
ø
ø
ø
ø
ø
ø
ø
ø
ø
ø
ø
ø
ø
ø
ø
ø
ø
ø
ø
ø
ø
ø
ø
ø
ø
ø
ø
ø
ø
Gm, D=4.18
0
5
10
15
20
25
30
35
0.0
0.5
1.0
1.5
2.0
2.5
3.0
Number of links kD
è
è
è
è
è
è
è
è
è
è
è
è
è
è
è
è
è
è
è
è
è
è
è
è
è
è
è
è
è
è
è
è
è
èèèè
ø
ø
ø
ø
ø
ø
ø
ø
ø
ø
ø
ø
ø
ø
ø
ø
ø
ø
ø
ø
ø
ø
ø
ø
ø
ø
ø
ø
ø
ø
ø
ø
ø
Gs, D=4.24
0
5
10
15
20
25
30
35
0.0
0.5
1.0
1.5
2.0
2.5
3.0
è
è
è
è
è
è
è
è
è
è
è
è
è
è
è
è
è
è
è
è
è
è
è
è
è
è
è
è
è
è
è
è
è
è
ø
ø
ø
ø
ø
ø
ø
ø
ø
ø
ø
ø
ø
ø
ø
ø
ø
ø
ø
ø
ø
ø
ø
ø
ø
ø
ø
ø
ø
ø
ø
ø
ø
ø
0
5
10
15
20
25
30
35
0.0
0.2
0.4
0.6
0.8
1.0
Clustering C
è
è
è
è
è
è
è
è
è
è
è
è
è
è
è
è
è
è
è
è
è
è
è
è
è
è
è
è
è
è
è
è
è
è
ø
ø
ø
ø
ø
ø
ø
ø
ø
ø
ø
ø
ø
ø
ø
ø
ø
ø
ø
ø
ø
ø
ø
ø
ø
ø
ø
ø
ø
ø
ø
ø
ø
ø
0
5
10
15
20
25
30
35
0.0
0.2
0.4
0.6
0.8
1.0
è
è
è
è
è
è
è
è
è
è
è
è
è
è
è
è
è
è
è
è
è
è
è
è
è
è
è
è
è
è
è
è
è
è
ø
ø
ø
ø
ø
ø
ø
ø
ø
ø
ø
ø
ø
ø
ø
ø
ø
ø
ø
ø
ø
ø
ø
ø
ø
ø
ø
ø
ø
ø
ø
ø
ø
ø
0
5
10
15
20
25
30
35
0
1
2
3
4
5
6
Flux-I D F
è
è
è
è
è
è
è
è
è
è
è
è
è
è
è
è
è
è
è
è
è
è
è
è
è
è
è
è
è
è
è
è
è
è
ø
ø
ø
ø
ø
ø
ø
ø
ø
ø
ø
ø
ø
ø
ø
ø
ø
ø
ø
ø
ø
ø
ø
ø
ø
ø
ø
ø
ø
ø
ø
ø
ø
ø
0
5
10
15
20
25
30
35
0
1
2
3
4
5
6
è
è
è
è
è
è
è
è
è
è
è
è
è
è
è
è
è
è
è
è
è
è
è
è
è
è
è
è
è
è
è
è
è
è
ø
ø
ø
ø
ø
ø
ø
ø
ø
ø
ø
ø
ø
ø
ø
ø
ø
ø
ø
ø
ø
ø
ø
ø
ø
ø
ø
ø
ø
ø
ø
ø
ø
ø
0
5
10
15
20
25
30
35
0
1
2
3
4
5
6
Node
Flux-A D Y
è
è
è
è
è
è
è
è
è
è
è
è
è
è
è
è
è
è
è
è
è
è
è
è
è
è
è
è
è
è
è
è
è
è
ø
ø
ø
ø
ø
ø
ø
ø
ø
ø
ø
ø
ø
ø
ø
ø
ø
ø
ø
ø
ø
ø
ø
ø
ø
ø
ø
ø
ø
ø
ø
ø
ø
ø
0
5
10
15
20
25
30
35
0
1
2
3
4
5
6
Node
Figure 4: Node-by-node (nodes 1-34) values of degree D,
clustering C, and fluxes Φ and Ψ. The first column shows
the values for master map Gm and the second column for
the student map G1.
Table 3: Average degree D, clustering C and information
fluxes Ψ and Φ for master map Gm and student maps G1
and G2 and for models maps m-G1 - m-G3.
Gm G1 G2 m-G1 m-G2 m-G3
D 4.18 3.47 4.24 3.71 4.47 3.58
C 0.18 0.25 0.48 0.19 0.33 0.24
Φ 2.82 3.00 3.31 2.73 3.20 3.09
Ψ 2.32 2.51 2.81 3.06 2.81 3.01
students’ systematic use of simple procedures (here
quantitative experiments and modelling) which they
use to add new concepts on the existing concept net-
work.
è
è
è
è
è
è
è
è
è
è
è
è
è
è
è
è
è
è
è
è
è
è
è
è
è
è
è
è
è
è
è
è
è
è
m-G1, D=3.71
0
5
10
15
20
25
30
35
0.0
0.5
1.0
1.5
2.0
2.5
3.0
Scaled degree kD
è
è
è
è
è
è
è
è
è
è
è
è
è
è
è
è
è
è
è
è
è
è
è
è
è
è
è
è
è
è
è
è
è
è
m-G2, D=3.82
0
5
10
15
20
25
30
35
0.0
0.5
1.0
1.5
2.0
2.5
3.0
è
è
è
è
è
è
è
è
è
è
è
è
è
è
è
è
è
è
è
è
è
è
è
è
è
è
è
è
è
è
è
è
è
è
0
5
10
15
20
25
30
35
0.0
0.2
0.4
0.6
0.8
1.0
Clustering C
è
è
è
è
è
è
è
è
è
è
è
è
è
è
è
è
è
è
è
è
è
è
è
è
è
è
è
è
è
è
è
è
è
è
0
5
10
15
20
25
30
35
0.0
0.2
0.4
0.6
0.8
1.0
è
è
è
è
è
è
è
è
è
è
è
è
è
è
è
è
è
è
è
è
è
è
è
è
è
è
è
è
è
è
è
è
è
è
0
5
10
15
20
25
30
35
0
1
2
3
4
5
6
Flux-I D F
è
è
è
è
è
è
è
è
è
è
è
è
è
è
è
è
è
è
è
è
è
è
è
è
è
è
è
è
è
è
è
è
è
è
èè
0
5
10
15
20
25
30
35
0
1
2
3
4
5
6
è
è
è
è
è
è
è
è
è
è
è
è
è
è
è
è
è
è
è
è
è
è
è
è
è
è
è
è
è
è
è
è
è
è
0
5
10
15
20
25
30
35
0
1
2
3
4
5
6
Node
Flux-A D Y
è
è
è
è
è
è
è
è
è
è
è
è
è
è
è
è
è
è
è
è
è
è
è
è
è
è
è
è
è
è
è
è
è
è
0
5
10
15
20
25
30
35
0
1
2
3
4
5
6
Node
Figure 5: Node-by-node (nodes 1-34) values of degree D,
clustering C, and fluxes Φ and Ψ. The first column shows
the values for model graph m-G1 and the second column for
the graph m-G2.
Table 4: Average degree D, clustering C and information
fluxes Ψ and Φ for six student maps G3-G8.
G3 G4 G5 G6 G7 G8
D 2.85 3.06 3.18 3.18 3.72 4.07
C 0.24 0.15 0.25 0.16 0.21 0.17
Φ 1.84 2.76 2.97 3.12 3.19 2.70
Ψ 1.34 2.26 2.47 2.65 2.62 2.21
In order to confirm these expectation, a simple
phenomenological model simulating the process of
making the connections was introduced. In the model,
there are two assumed modules of concepts. Within
the module closely located nodes have higher prob-
ModellingHowStudentsOrganizeKnowledge
147

ability to connect, but there is appreciably smaller
probability for connection between the modules (on
the average 15-20 % of connections between mod-
ules). These simple rules seem enough to generate
networks with very similar properties as those found
empirically.
The conclusion we can draw from the results with
some confidence is that learners handle the knowl-
edge so that they process the relational aspect in rather
small pieces, finding the connections on basis of “af-
filiation” of concepts in the procedures (experiments
and models), where they are used. In the context stud-
ied here - making plans for teaching - this is natu-
ral and desired aspect. In more general (and spec-
ulative level) the results support the assumption that
processing of knowledge is based on simple affili-
ation schemes. In certain context of description or
prediction few known concepts are used, and new
concept (knowledge) or new generalization is intro-
duced on basis of the already known concepts (knowl-
edge). The fact that in each context (affiliation) only
few known concepts is used tells probably something
about the: 1) human capability to process and handle
knowledge, 2) human capability to infer dependen-
cies. In short, there seems to be preference for certain
parsimony in handling the knowledge. Of course, this
finding is not very unexpected, but nicely confirmed
here through structural analysis of knowledge rep-
resentations. These notions encourage thinking that
the methods developed here provide a fruitful start-
ing point for monitoring learning outcomes and can
give insight to the ways knowledge is processed and
represented.
ACKNOWLEDGEMENTS
This work has been supported by the Academy of Fin-
land through grant SA133369.
REFERENCES
Batista J. B. and Costa, L. da F. (2010). Knowledge Acqui-
sition by Networks of Interacting Agents in the Pres-
ence of Observation Errors. Physical Review E, 82,
016103.
Costa, L. da F. (2006). Learning About Knowledge: A
Complex Network Approach. Physical Review E, 74,
026103.
Duong, T. H., Jo, G. S., Jung, J. J. and Nguyen, N. T.
(2009). Complexity Analysis of Ontology Integra-
tion Methodologies: A Comparative Study. Journal
of Universal Computer Science, 15, 877–897.
Goni, J., Corominas-Murtra, B., Sol´e, R. V. and Rodr´ıguez-
Caso,C. (2010). Exploring the Randomness of Di-
rected Acyclic Networks. Physical Review E, 82,
066115.
Karrer, B. and Newman, M. E. J. (2009). Random Graph
Models for Directed Acyclic Networks. Physical Re-
view E, 80, 046110.
Kemp, C., Perfors, A. and Tenenbaum, J. B. (2007). Learn-
ing Overhypotheses with Hierarchical Bayesian Mod-
els. Developmental Science, 10, 307-321.
Kemp, C. and Tenenbaum, J. B. (2008). The Discovery of
Structural Form. PNAS, 105, 10687–10692.
Kolaczyk, E. D. (2009). Statistical Analysis of Network
Data. New York: Springer.
Koponen, I. T. and Pehkonen M. (2010). Coherent Knowl-
edge Structures of Physics Represented as Concept
Networks in Teacher Education. Science & Educa-
tion, 19, 259–282.
Koponen, I. T. and Nousiainen M. (2012). Pre-service
physics teachers understanding of the relational struc-
ture of physics concepts. International Journal of
Science and Mathematics Education, in print, DOI
10.1007/s10763-012-9337-0.
McClure, J. R., Sonak, B. and Suen, H. K. (1999) Concept
Map Assesment of Classroom Learning: Reliability,
Validity, and Logistical Practicality. Journal of Re-
search in Science Teaching, 36, 475–492.
Novak, J. (2002). Meaningful Learning: The Essential Fac-
tor for Conceptual Change in Limited or Inappropriate
Propositional Hierarchies Leading to Empowerment
of Learners. Science Education, 86, 548–571.
O’Donnell, A. M., Dansereau, D. F. and Hall, R. H. (2002)
Knowledge Maps as Scaffolds for Cognitive Process-
ing. Educational Psychology Review, 14, 71–86.
Thagard, P. (1992). Conceptual Revolutions. Princeton
NJ:Princeton University Press.
KEOD2012-InternationalConferenceonKnowledgeEngineeringandOntologyDevelopment
148
