
On the Development of Smart Adaptive User Interfaces for Mobile
e-Business Applications
Towards Enhancing User Experience – Some Lessons Learned
Andreas Holzinger, Michael Geier and Panagiotis Germanakos
Research Unit Human–Computer Interaction, Institute for Medical Informatics, Statistics and Documentation,
Medical University Graz, Graz, Austria
Keywords: Adaptive User Interfaces, Smart Adaptation, Mobile e-Business Applications, Performance.
Abstract: Mobile end users usually work in complex and hectic environments, consequently for mobile e-Business
applications the design and development of context aware, smart, adaptive user interfaces is getting more
and more important. The main goal is to make the user interface so simple that the end users can concentrate
on their tasks – not on the handling of the application, the main challenge is its adaptation to the context. A
possible solution is smart adaptation. Consequently, developers need to know the limits of both context and
systems and must be aware of mobile end users different interaction. In this paper, we follow the hypothesis
that simple user interfaces enhance performance and we report about some lessons learned during the
design, development and evaluation of a smart, adaptive user interface for an e-Business application.
1 INTRODUCTION
For mobile applications, there is growing
recognition for intelligent user interfaces offering
products that are highly attuned to the user’s ever
changing context (Marca et al., 2012), (El-Bakry et
al., 2010). Consequently, User interfaces (UIs) have
become an essential part in the development of
mobile applications (apps). End users expect not
only well designed but also intuitively operable and
simple and at the same time powerful UI’s. Current
smartphones and tablets, for example, often provide
a large touchscreen for most of the user input. A
successful UI must satisfy the expectations of the
end users, when they intuitively touch the screen.
Mobile devices are meanwhile standard
equipment for mobile workers, who are increasingly
requiring access to services similar to their corporate
services as they move to new locations, without
having to configure their working environment
explicitly (Badidi and Esmahi, 2010), i.e. e-Business
applications must be context aware and able to adapt
to changing environments (Abowd et al., 1999), (van
Sinderen et al., 2006).
However, mobile workers are often in very
complex and hectic work places (Holzinger and
Errath, 2007) and for those who work outdoors,
potentially under rough conditions, it is particularly
important to be supported by easy, quick and
intuitive UI. Moreover, such workers are not
necessarily computer literate; most of them from
small and medium enterprises of high heterogeneity
(Decker et al., 2006). In such areas the main
challenge is to design the user interface in such a
simple manner, that the end user can completely
concentrate on his/her task and not the device; at the
same time not losing functionality.
What makes a UI simple? Expert end users might
feel patronized by too simple user interfaces which
hide advanced features, where at the same time
novice end users are confused, overwhelmed and
distracted by the complexity. Consequently,
“simple” does not necessarily have the same
meaning for all types of end users. Some might
consider a simple UI as one which does not hide any
features; others might consider a simple UI as one
which does hide unimportant features.
One possible solution for this challenge is on
smart adaptation (El-Bakry et al., 2010). Adaptive
user interfaces are user interfaces which are
modified dynamically in a way that the special
demands/requirements/needs of individual end users
are satisfied. Adaptive user interfaces can be used to
present the end user a UI which is tailored to the
205
Holzinger A., Geier M. and Germanakos P..
On the Development of Smart Adaptive User Interfaces for Mobile e-Business Applications - Towards Enhancing User Experience – Some Lessons
Learned.
DOI: 10.5220/0004067002050214
In Proceedings of the International Conference on Data Communication Networking, e-Business and Optical Communication Systems (ICE-B-2012),
pages 205-214
ISBN: 978-989-8565-23-5
Copyright
c
2012 SCITEPRESS (Science and Technology Publications, Lda.)

special needs of the end user (Germanakos P., 2009).
Smart adaption means that adaptive user interfaces
should not arbitrarily make certain parts less
accessible by hiding functions in submenus. Instead
the system should take the context into account for
deciding which parts of the UI are currently needed
and which are not.
The term context has many different meanings
(Yuan-Kai, 2004, Schmidt, 2000) and includes the
end user’s experience, special abilities of the users,
current needs and feelings as well as environmental
factors (surrounding light, noise, location, …) and
the system’s or the device’s current state; (Schmidt,
2000) called the latter “situational context”.
Often the importance of time is neglected, when
referring to the context. According to Schmidt et al.
(1999) the term context is defined as “that which
surrounds, and gives meaning to something else”.
All relevant contextual factors should be taken into
account when designing adaptive user interfaces.
For getting information about the situational
context a large amount of sensors is available in
current smartphones and tablet computers. However,
one of the big challenges in this area is to determine
the variables used as basis for developing different
adaptions (Germanakos P., 2009). Consequently, the
designer needs to know the limits of context and
systems and that mobile end-users interact
differently (Holzinger and Errath, 2007).
Today location is mostly used for determining
the environmental context. But location-awareness is
only one part of context-awareness (Schmidt et al.,
1999). Combined data from different sensors can
give a more holistic understanding of the current
context (Gellersen et al., 2002).
The goal of applying smart context-based
adaption is to enhance the end-users performance.
Performance usually relates to the speed and the
accuracy a certain task can be accomplished by the
end-user. In other words enhancing the performance
of end users means that end users are able to
perform a task in a less amount of time and/or with
fewer errors. But the key question is: can simpler
user interfaces which were created using smart
adaption enhance the performance of end users?
The assumption is that smart adaption for
simplifying user interfaces which meet the special
requirements of the current context does enhance the
performance and try to support this statement by
conducting an experiment. Hiding unused fields in
forms or adapting the form to the current context
(e.g. pre-selection and adaption of the expected
format of zip-code fields based on the device’s
location) might speed up data entry, for example.
Within this paper we compare the performance
and the acceptance of an adaptive user interface
(AUI) to a non-adaptive user interface (non-AUI).
As contextual information the application’s state is
taken into account. Based on previous inputs the
application’s state is changed.
The goal of this paper is to point out the
advantages and disadvantages of smart adaption and
the special importance of smart adaption in mobile
applications. The paper also gives an overview of
the current situation in terms of context-sensitive
UIs in the area of smartphone and tablet applications
from the lessons learned during cooperation with an
e-Business company.
2 BACKGROUND AND RELATED
WORK
There are many potential sources for collecting
contextual information. Regarding the state of the
application or the user’s input can be one piece of
the puzzle. Another piece includes the
environmental context. Current smartphones and
tablet computers have a large amount of different
sensors to “sense” their environment, starting from
location sensors and accelerometers up to
temperature sensors and light sensors.
However, one challenge is to give the bare sensor
data a meaning (Schmidt et al., 1999). What does it
mean if a brightness sensor reports 20 per cent
lightness and an acoustic noise sensor reports a
sound pressure level of 20 dB? These values must be
translated to a higher-level contextual meaning such
as “indoors/outdoors”, “engaged in conversation”,
“in a meeting” so that the application can react
accordingly. Korpipaa et al. (2003) present a
framework for the Symbian platform which
implements such a mapping from low-level sensor
date to a high-level representation of context.
Instead of just using snapshots of the current
sensor data analysing time series of sensor data can
be useful for forming higher-level contexts
(Himberg et al., 2001).
2.1 Sensor Usage
Looking at the permissions Android applications
request, we can see that on a phone with 237
different, randomly selected apps for different
purposes (including games) 69 (29,1 %) require
permissions for accessing fine or coarse location
data such as GPS data or location data from the
ICE-B 2012 - International Conference on e-Business
206

cellular network, 29 (12,2 %) access the camera for
recording images (including barcode scans) or
videos, 13 (5,5 %) access the Bluetooth module, 12
(5,1 %) record audio, four (1.7 %) require access to
NFC technologies (RFID reader) and 203 (85,7 %)
require full access to the internet. However, we have
to keep in mind that some apps need the internet
access permission just for downloading
advertisement. This means that the number of
applications actually needing internet access for
their main functionality is slightly lower.
The fact that more than 29 % of the tested apps
access location data supports the statement by
(Schmidt, 2000) that location is a concept that is
well understood. Apps for displaying the public
transport schedule, for example, make use of the
location data for create an ordered list of nearest bus
stops. Within the study NFC was mostly used for
scanning RFID tags which inform the app about the
situational context. Using fixed tags in different
rooms, for example, informs the app in which room
the device currently is. This can be used, for
example, to mute the phone when entering the
conference room. Krishnamurthy et al. (2006) show
the possibilities of the NFC technology in
combination with mobile phones.
The camera and audio recording devices are
often used for replacing manual text input. Avoiding
manual text input is recommended wherever
possible as applications that require text input annoy
users (Longoria, 2001).
An Internet connection in combination with
sensors can be used to download more information
about the current context, such as information about
the current location, and therefore may improve the
adaption of the user interface.
A similar analysis of the usage of sensors was
made by investigating Austria’s 27 top-ranked
Android applications (excluding games). The
popularity ranking is determined by Google using a
secret ranking algorithm. Certainly, the ranking is
influenced by the user's current location. Therefore
Austria-related apps could be found in the ranking,
such as the OEAMTC app (Austrian automobile
club) or the Krone.at or Kleine Zeitung app (the app
of popular Austrian newspapers). Other investigated
apps include YouTube, Google Maps, Facebook,
Skype, WhatsApp Messenger, Barcode Scanner,
Shazam, wetter.com, TuneIn Radio and the IMDb
app. One third of the investigated apps requires or
allows using a user account in order to receive
personalized information. More than 75 per cent of
the investigated apps use an internet connection for
their main functionality. This means that apps which
try to access the internet just for downloading
advertisement did not count. More than 60 per cent
of the apps using the internet are not working at all
without network access. The remaining apps using
the internet are usable without internet connection,
but often only with limited functionality or cached
data.
22 per cent of the investigated apps use the geo-
location hardware capabilities either for their main
functionality (map applications) or for prefilling
input controls so that the end user does not have to
type or select his/her current location by
himself/herself. 18.5 per cent of the apps use the
built-in camera to scan barcodes or QR tags in order
to speed up user input.
Buttons, Lists, Text input controls are the most
frequently used controls in current popular
smartphone applications. Tabs are often used to
structure screen contents. Context menus and
gestures are less frequently used. One reason might
be that they are often overlooked by the end-users as
there is no visual clue that they are available.
2.2 Adaptive versus Adaptable Uis
We have to differentiate between adaptive and
adaptable user interfaces. Adaptable UIs are adapted
by the software developers at design or
implementation time manually while adaptive
software adapts itself at runtime automatically based
on the dynamic user profile and contextual data
gained from the end-user or the environment.
Easily adaptable UIs make it possible for
enterprises to customize the UI of an application
without extra effort such as time and cost. Through
the process of customization, enterprise software is
built on a framework which allows creating
adaptable UIs tailored to the needs of the customer
by combining existing components of the whole
system. In addition, mash-ups (i.e. web application
hybrids) allow end-users to customize a UI by
re-combining existing UI components (widgets) to a
more personalized UI. Such a customized UI allows
end users to focus on their special needs. Taptu
(http://www.taptu.com) is a popular social network
aggregation application which makes use of UI
mash-ups.
On the other hand, adaptive UIs enable the
provision of dynamic and simpler UIs appropriate
for the current context of use. As stated before, the
hypothesis is that simple UIs enhance performance.
But what does performance exactly mean and how
can performance be measured on mobile devices?
Better performance not only means less time in
On the Development of Smart Adaptive User Interfaces for Mobile e-Business Applications - Towards Enhancing User
Experience - Some Lessons Learned
207

execution of a certain task, but also that a lower
error rate will occur accordingly. On mobile as well
as on desktop devices the performance can be
measured by the time needed for a certain task to be
performed as well as to what extent the task was
accomplished. One of the main challenges when
measuring performance on mobile devices is the
screen and input capturing because of the lack of
tools, computational power and storage capacity.
Also, touchscreen features are harder to track than
other input methods such as the ones from the
keyboard. Usually adaptive UIs are designed in a
modular way where single independent components
can be combined forming a totally new end-product.
2.3 Context-aware Software
The idea of context-awareness is not new. Schilit et
al. (1994) introduced context-awareness for
ubiquitous computing. However, the capabilities of
mobile devices have changed drastically since 1994.
Nowadays smartphones with powerful
processors and large, bright touch screens can be
found in the pockets of many professionals, students,
and even children. Software providing different
modes for different user groups is available, such as
ArcheoApp (Holzinger et al., 2011), which provides
modes for students, tourists and children as tourists
have other needs than people who use the app for
learning. The topic context awareness and adaptation
in mobile learning is also discussed in Yuan-Kai
(2004). Schmidt (2000) describe an application for
PalmPilot called Context NotePad. They also define
the term implicit human-computer interaction which
describes the concept of interaction based on
situational context rather than on explicit GUI
manipulation.
Comprehensive user profiles where also visual,
cognitive, and emotional-processing parameters are
included may improve the performance of adapted
Web-based content. Evaluation results demonstrate
the effectiveness of incorporating human factors in
Web-based personalized environments (Germanakos
et al., 2009).
Text input is widely used for interacting with
software although it should be avoided (Longoria,
2001). Therefore, it should be made less annoying as
possible. Adaptive soft (on-screen) keyboards, such
as the default keyboards used by Android and iOS,
support text entry by changing their buttons based
on the expected text input type. For enabling this
feature, software developers must define an expected
input type for text boxes (e.g. “text”, “email”,
“number”). Based on this contextual metadata the
keyboard layout is adapted in a way that symbols
which are not likely to be used are replaced by other,
more likely needed symbols or characters. This
works not only for native mobile applications but
also for web pages using HTML5.
According to the “engadget” Weblog (Melanson,
2010) Microsoft developed a hardware keyboard
which has an adaptive keyboard layout, similar to
the mentioned soft keyboards on current
smartphones and tablets.
3 EXPERIMENT
An experiment was designed and conducted to
measure the performance and the acceptance of an
adaptive user interface in contrast to a non-adaptive
user interface on mobile devices in order to test the
hypothesis that that simpler user interfaces created
by smart adaption enhance the performance of end
users (Figure 1). Adaptive systems employ adap-
tivity with various techniques, i.e. manipulating the
link structure or by altering the presentation of
information, based on a basis of a dynamic
understanding of the individual user, represented in
an explicit user model. However, adaptation effects
vary from one system to another (i.e. educational
hypermedia, on-line info systems, retrieval systems,
institutional hypermedia and systems for managing
personalized view in information spaces). In the
current study we have utilized adaptivity techniques
under the following considerations: The adaptation
is made by regarding the current state of the
application, i.e. the previous input. The input button
array is adapted by reducing the selection space, i.e.
only offering appropriate options in current context
(Schmidt, 2000).
For the experiment a smartphone application
named AdaptiveCalc for the Android operating
system was developed. The application is a
mathematical calculator for basic mathematical
expressions. The user interface (Figure 1) mainly
consists of (a) a TextView (an area to display text)
for displaying the entered mathematical expression
at the top of the screen, (b) another TextView for
displaying the result and (c) an array of buttons
which - when pressed – append the pictured number,
function, operator, or symbol to the mathematical
expression and display the new expression in (a). If
the currently displayed expression is valid (e.g.
balanced parenthesis, all binary operators having
two operands, and other criteria) the result is
calculated and displayed immediately in (b).
Otherwise “Invalid Expression” is displayed.
ICE-B 2012 - International Conference on e-Business
208
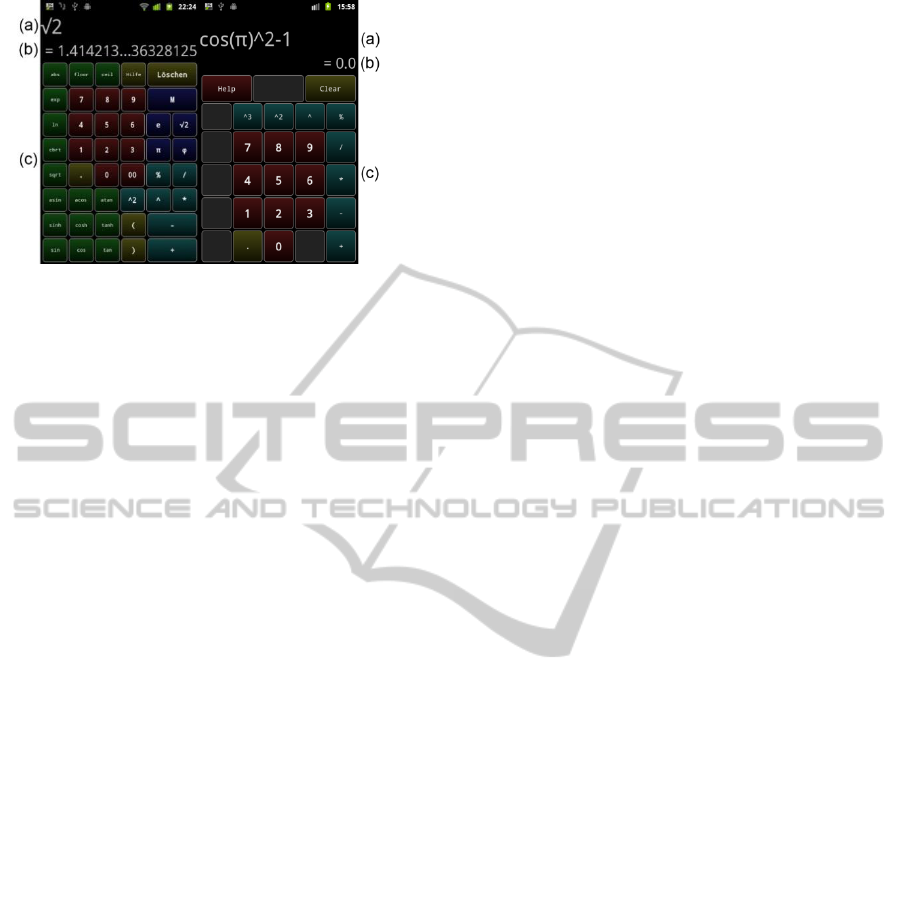
Figure 1: Non-adaptive (left screenshot) and adaptive
(right screenshot) user interface of AdaptiveCalc.
Two different versions of the button array area
(c) were implemented: a non-adaptive version and
an adaptive version. On first start of the application
a random UI is selected. In a message box the user
can decide by unchecking a checkbox not to
participate in the experiment. In the preferences
screen the user can choose to switch the user
interface from adaptive to non-adaptive or vice-
versa.
There was a choice to be made when designing
the experiment whether to let the user make the
decision of choosing the user interface or to disallow
the change of the UI. The reasons for the decision to
allow the user to change the UI were the following.
First, by letting the user choose the user’s UI
preferences can be found out. If users use a certain
UI more often it is likely that the more often used UI
is the one which is better accepted by the users.
Secondly, as the app should be distributed via the
Android Market, the goal was to make the app
attractive for as many potential end users as
possible. Restricting the functionality to one UI,
however, does not support the attractiveness of an
application.
Using this model of letting the end-user choose
the desired UI might, however, bias the performance
measurements. The knowledge of using the adaptive
or the non-adaptive user interface might influence
the behaviour of the end users and lead to unnatural
typing behaviour.
The goal of the experiment is to find out the
favoured UI by the end users and to take and to
compare performance measures, keeping in mind the
biasing issues mentioned above.
The adaptation is the modification of the
keyboard layout in AUI mode, depending on the
current mathematical expression. More precisely,
only the last character (digit, operator, symbol) of
the current mathematical expression is used for
determining what keyboard layout to show. Only
certain characters (digits, operators, symbols) can
follow certain characters.
3.1 Test Users
The application was published on the Android
market. Anyone interested could and still can
download and use the application. Measurements are
taken automatically during normal operation of the
calculator. These measurements are sent to a web
service via Internet which stores the collected results
for subsequent analysis.
End users are informed about the background
measurement activities via the app description and
can disable the measurements without affecting the
features of the calculator.
3.2 Collecting Results
The following measurements are taken: Pressed
buttons, time between button presses, selected mode
(adaptive or non-adaptive), and result of the
calculation.
A string of the form
<uimode>(;<ms>:<button>)+;<ms>;<result>
is recorded for each session. A session starts when
bringing the calculator activity into view or when
starting a new calculation (expression) and ends
when the activity is left by the user or when the
entered expression is cleared. <uimode> is the
placeholder for a string representing the current
mode (auiport (AUI portrait), auiland (AUI
landscape), or nonaui (non-AUI)), <button> is a
string representing the pressed button and <ms> is
the timestamp of the key press. The last <ms>
represents the time of clearing the expression.
<result> is either the string ok or nan (not a
number).
After a session has ended, the recorded session
measurement string is sent to the web service if a
network connection is available. Otherwise, the
string is stored in a local database on the device for
later transmission. The next time the app tries to
send a session measurement string to the web
service it also checks the local database for
previously unsent data.
Within a time period of approximately one
month 408 single calculations (sessions) were
recorded. For analysis of the results all 408 single
session strings (records) were separated into four
groups. The first group only contains records from
the adaptive user interface (portrait) version; the
On the Development of Smart Adaptive User Interfaces for Mobile e-Business Applications - Towards Enhancing User
Experience - Some Lessons Learned
209
second group only contains records from the
adaptive user interface (landscape) version; the third
group only contains records from the non-adaptive
user interface version; the fourth group contains
invalid records.
Then, certain values were calculated from the
collected records in order to evaluate the end-user’s
performance and acceptance of the user interface
types.
As performance measures the average time
between button presses was calculated for the single
user interface types as well as the error rate.
For evaluating the user acceptance interviews
were conducted and the number of calculations
made with each user interface was counted.
4 RESULTS
Both the user acceptance and the performance of
each user interface were evaluated during the
experiment. The acceptance was evaluated by
interviews and by recording the number of
calculations made with each of the user interfaces.
The performance was measured by calculating the
average time between button presses (TBBP) on the
one hand and by calculating the error rate by
counting the number of clear button presses on the
other hand.
Figure 2 and Figure 3 show the cumulated values
Average of the medians of the TBBPs and Error rate
for the AUI (portrait) and the non-AUI. The figures
illustrate that after about 240 calculations both
values stabilized around the presented values (i.e.
the cumulated values after 408 calculations).
Figure 2: Time between button presses.
Figure 3: Error rate (clear presses / total number of button
presses).
4.1 User Acceptance
4.1.1 Interviews
Interviews with six test users were conducted for
gaining information about the strengths and the
weaknesses of the single user interfaces. Before the
interviewing the six test users three of the test users
were asked to do several calculations with the non-
adaptive UI, the other three test users were asked to
do the same calculations with the adaptive UI
(Figure 4). When finished, the UI was switched and
the users were asked to do several more calculations
with the other user interface. The predefined
calculations included simple summations as well as
calculations using functions.
Figure 4: Test user calculating with AdaptiveCalc.
During the interviews the users were asked to
describe which user interface they liked more and
why. Four users reported to prefer the AUI, one user
reported to prefer the non-AUI, and one did not
decide for one certain UI. Table 1 summarizes the
thoughts of the users.
500
600
700
800
900
1000
1100
1200
1300
40 80 120 160 200 240 280 320 360 400
Average of the medians of the TBBPs
AUI (port)
non-AUI
0
0,02
0,04
0,06
0,08
0,1
0,12
40
60
80
100
120
140
160
180
200
220
240
260
280
300
320
340
360
380
400
408
Error rate
AUI (port)
non-AUI
ICE-B 2012 - International Conference on e-Business
210
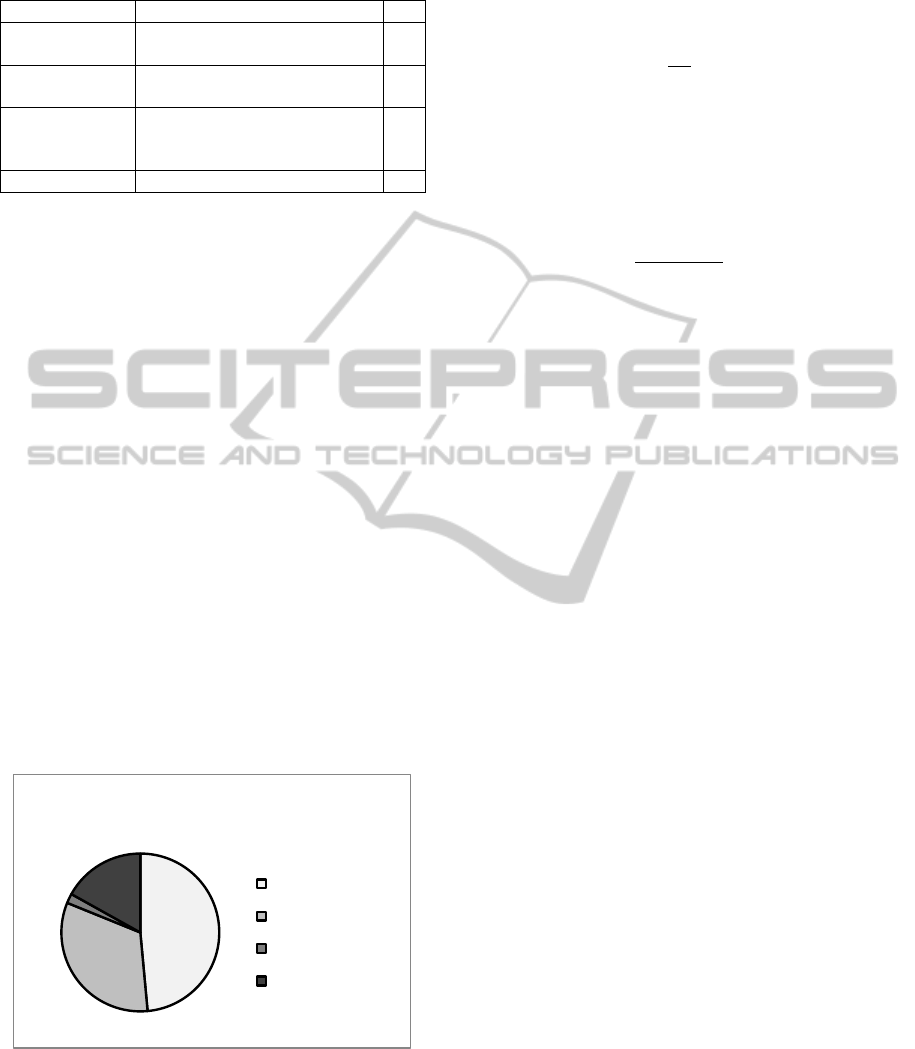
Table 1: Summary of the user’s answers during the
interview.
AUI (+)
The buttons are larger
6
AUI (+)
I like that you only see what is
currently relevant.
4
AUI (-)
It is confusing that the buttons
(dis)appear.
2
Non-AUI (+)
All buttons are always visible
– it is clear what functions are
available.
2
Non-AUI (-)
Buttons are quite small.
2
4.1.2 Number of Calculations
During the test period 408 calculations were
reported to the server. 198 of the counted
calculations were made with the AUI in portrait
mode (8 in landscape mode) while 133 calculations
were made with the non-AUI (only portrait mode
possible). 69 calculations were filtered out because
of very short and/or invalid calculations (for
example when users only entered an opening
parenthesis or only one number). These numbers are
illustrated in Figure 5.
Including the invalid calculations 249 sessions
were started in AUI (portrait) mode (61 %), 9 in
AUI (landscape) mode (2.2 %), and 150 in non-AUI
mode (36.8 %).
As on the first run of the application the user
interface was selected randomly with an equally
distributed likelihood, it can either be concluded that
users tend to switch to and stay in the AUI mode or
that the users which started with the AUI had
significantly more to calculate or simply preferred
calculating with AdaptiveCalc than with another
calculator.
Figure 5: Total number of calculations with AdaptiveCalc.
4.2 Performance
As performance measures both the error rate e and
the typing speed was used. The error rate e was
calculated in number of clear button presses |c|
divided by the total number of button presses |b|.
(1)
The typing speed s was determined by
calculating the average of the medians of the times
between single button presses b of each single
recorded calculation R
i
.
(2)
where
(3)
and refers to the median function.
refers to
the time when button press j was made during a
calculation R. b
1
denotes the first button press within
one calculation,
denotes the last button press
within one calculation. The difference
is
the time between single button presses (TBBP) b
j
and b
j+1
. One single calculation is also called record
and identified by a unique index i. |R| represents the
total number of calculations (records).
Using the median has the advantage that spike
values are flattened. Spike values might result from
thinking times or waiting times of the end users.
These times must not be considered in the
performance evaluation.
The time between single button presses was used
as performance measure because the single tasks and
therefore the total time needed for one calculation
differed as there were no predefined tasks to
accomplish for the end users.
The reason for using the median for the
calculation of the times between the button presses
within one record was to filter out spikes (Figure 6).
Spikes of large values are often caused by
thinking times or reading times for copying values
from paper sheets. Additionally, very large TBBPs
(> 5000 ms or 3500 ms, see later) were ignored.
Very large TBBPs are associated with long thinking
times or breaks by the user but certainly not with
looking for certain buttons.
Incomplete calculations were filtered out. The
following example shows a record of an incomplete
calculation. The user only entered an opening
parenthesis and then pressed the clear button two
times. “nan” (not a number) in the end of the line
198
133
8
69
Total number of calculations
AUI (portrait)
non-AUI
AUI (landscape)
not considered
On the Development of Smart Adaptive User Interfaces for Mobile e-Business Applications - Towards Enhancing User
Experience - Some Lessons Learned
211
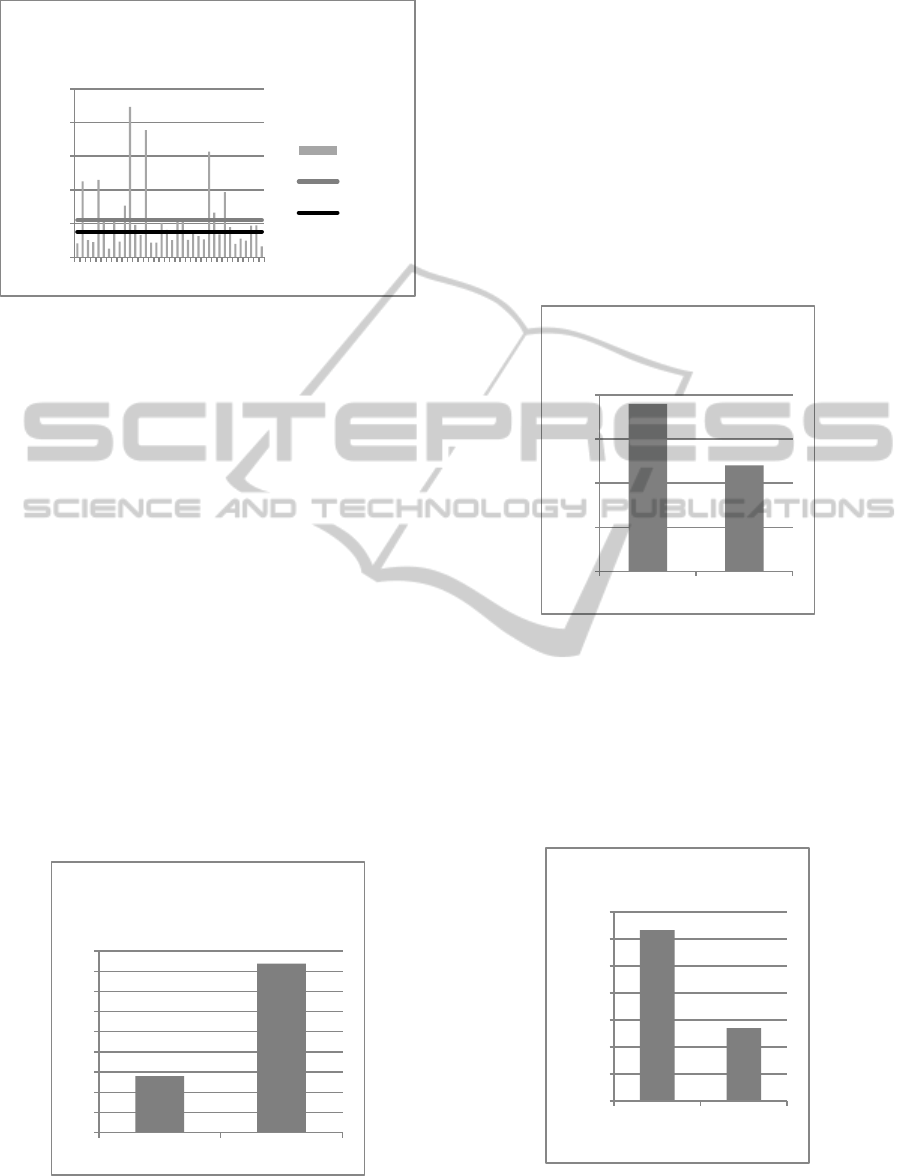
Figure 6: Comparison of Average and Median of TBBPs.
indicates that there was no valid result for the
corresponding calculation.
auiport;1328699930271:(;1328699931276:[clear];13
28699931486:[clear];1328699931487;nan
4.2.1 Typing Speed
The average times of the median times between
single button presses (TBBPs) were calculated as
described above. The results were 836.1 ms for AUI
(portrait) mode, 947.5 ms for non-AUI mode (Figure
7). The values for AUI (landscape) mode are not
included as there were only eight results collected.
In average the TBBPs were 111 ms lower in AUI
mode than in non-AUI mode. Therefore an average
calculation including 10 button presses is performed
more than one second faster in AUI mode than in
non-AUI mode. A cut-off of 5000 ms means that all
TBBPs larger than 5000 ms were ignored as larger
TBBPs can be considered as thinking times or
calculation breaks.
Figure 7: Average medians of TBBPs (cutoff at 5000 ms).
When using a lower cutoff of 3500 ms the values
were 803.4 ms for AUI (port) and 917.9 ms for non-
AUI.
4.2.2 Error Rate
The error rate (number of clear button presses
divided by total number of button presses) was
slightly higher in AUI mode: 0.069 in AUI (portrait)
mode and 0.062 in non-AUI mode (Figure 8). This
means that on 100 button presses the clear button is
– in average – pressed 6.9 times in AUI mode, while
in non-AUI mode clear is only pressed 6.2 times.
Figure 8: Clear presses per total button presses.
Looking at the number of “perfect calculations”
(calculations where no “clear” button press was
involved, except for clearing the whole calculation
in the end of the calculation) the AUI (portrait) UI
has 83.33 % perfect calculations while the non-AUI
only has a number of 79.7 % perfect calculations
(Figure 9).
Figure 9: Perfect calculations.
0 ms
1000 ms
2000 ms
3000 ms
4000 ms
5000 ms
1 8 15 22 29 36
Comparison of Average and Median
of TBBPs
TBBP
Average
Median
780
800
820
840
860
880
900
920
940
960
AUI (portrait) non-AUI
Average medians of TBBPs
(cutoff at 5000 ms)
0,05
0,055
0,06
0,065
0,07
AUI (portrait) non-AUI
Clear presses per total
button presses
77,00%
78,00%
79,00%
80,00%
81,00%
82,00%
83,00%
84,00%
AUI
(portrait)
non-AUI
Perfect calculations
ICE-B 2012 - International Conference on e-Business
212

4 DISCUSSION
The results of the experiment indicate that there is a
higher acceptance for the AUI amongst the test users
than for the non-AUI. Additionally the overall
typing speed with the AUI was higher than with the
non-AUI.
One limitation of this study is the assumption,
that the relative clear button press count is higher in
the non-AUI mode – this was not validated. The
results for the relative clear button press count are
even slightly higher for the AUI. A possible
correlation between the higher typing speed and the
slightly higher error rate is subject for further
investigation.
5 CONCLUSIONS
Mobile UIs must be friendlier enabling active
involvement (information acquisition), giving the
control to the user (system controllability), providing
easy means of navigation and orientation
(navigation), tolerating users’ errors, supporting
system-based and context-oriented correction of
users’ errors, and finally enabling customization of
multi-media and multi-modal UIs to particular user
needs. Adaptivity is a particular functionality that
embraces the abovementioned considerations by
alleviating navigational difficulties by distinguishing
between interactions of different users within the
information space.
In this regards, this paper describes a smartphone
application (a mathematical calculator for basic
mathematical expressions), namely AdaptiveCalc,
developed for the Android operating system. The
application employs two UIs states, one adaptive
and one non-adaptive version, and has been
evaluated by users using a within approach. The
results of the experiment suggest that the overall
acceptance of the simple AUI is better than the
acceptance of the complex non-AUI. Also the typing
speed when using the AUI was better in average.
The overall performance of the AUI at least was not
worse than when using the non-AUI.
6 FUTURE WORK
For further investigations, we can think of more
sophisticated adaptions, such as adaptions based on
the application’s context, i.e. adaptions based on
other apps the user installs on his/her device. Users
who also use apps for measuring distances, for
example, might require more frequent access to
trigonometric functions than the average user.
In future work it is not only planned to address
the previously mentioned issues with the
experiment, but also to apply the described approach
in more complex environments. Furthermore, it is
planned to evaluate the current study by comparing
the current adaptive approach with traditional
mobile applications to show the validity of the
experiment.
More open questions include how can we create
effective and useful mobile systems from a user-
centric perspective focusing on user goals, attitudes
and behaviours? Furthermore, how can we keep UIs
simple given the increasing complexity of
information spaces and contexts? Next steps of this
research include further experimentation with the
current application in order to extract more concrete
results with regards to the adaptivity control factors
and the evaluation metrics utilized. Furthermore, the
incorporation of human factors into the whole
process of mobile adaptive UIs design, i.e. based on
the theory of individual differences, reconstructing a
content based on users’ cognitive styles (i.e.
verbalizer/imager, wholist/analyst) can help them to
absorb information faster and more efficiently
regulating at the same time their cognitive load.
Therefore, it is a promising challenge to identify
design guidelines and adaptation mechanisms that
will help us to create UIs adapted to users’ unique
cognitive typologies, minimizing the complexity (in
terms of content presentation or navigation) and
increasing usability during a task execution time. In
such a way, users will be able to maintain the
expected performance and accuracy while at the
same time enhancing their experience.
ACKNOWLEDGEMENTS
We are grateful for the support of Boom Software
AG, especially to Mr. Joachim Schnedlitz for the
industrial cooperation and funding of our research.
REFERENCES
Abowd, G., Dey, A., Brown, P., Davies, N., Smith, M. &
Steggles, P. 1999. Towards a Better Understanding of
Context and Context-Awareness. In: GELLERSEN,
H.-W. (ed.) Handheld and Ubiquitous Computing,
LNCS 1707. Heidelberg, Berlin: Springer.
On the Development of Smart Adaptive User Interfaces for Mobile e-Business Applications - Towards Enhancing User
Experience - Some Lessons Learned
213

Badidi, E. & Esmahi, L. A quality of context driven
approach for the selection of context services. ICE-B
2010, 2010 Athens. IEEE, 1-6.
Decker, M., Schiefer, G. & Bulander, R. 2006. Specific
Challenges for small and medium-sized enterprises
(SME) in m-business: A SME-suitable framework for
mobile services. International Conference on E-
Business (ICE-B 2006). Setubal: INSTICC Press.
El-Bakry, H. M., Riad, A. M., Abu-Elsoud, M., Mohamed,
S., Hassan, A. E., Mastorakis, N., Kandel, M., Zadeh,
L. & Kacprozyk, J. Adaptive User Interface for Web
Applications. WSEAS International Conference
Proceedings Recent Advances in Computer
Engineering, 2010. WSEAS, 190-211.
Gellersen, H. W., Schmidt, A. & Beigl, M. 2002. Multi-
Sensor Context-Awareness in Mobile Devices and
Smart Artifacts. Mobile Networks and Applications, 7,
341-351.
Germanakos, P., Tsianos, N., Lekkas, Z., Mourlas, C. &
Samaras, G. 2009. Realizing Comprehensive User
Profile as the Core Element of Adaptive and
Personalized Communication Environments and
Systems. Comput. J., 52, 749-770.
Germanakos P., T. N., Lekkas Z., Mourlas C., Belk M., &
Samaras G. 2009. Towards an Adaptive and
Personalized Web Interaction using Human Factors.
In: ANGELIDES, M. (ed.) Advances in Semantic
Media Adaptation and Personalization. Taylor &
Francis Group.
Himberg, J., Korpiaho, K., Mannila, H., Tikanmaki, J. &
Toivonen, H. T. T. Time series segmentation for
context recognition in mobile devices. Data Mining,
2001. ICDM 2001, Proceedings IEEE International
Conference on, 2001 2001. 203-210.
Holzinger, A. & Errath, M. 2007. Mobile computer Web-
application design in medicine: some research based
guidelines. Universal Access in the Information
Society International Journal, 6, 31-41.
Holzinger, K., Lehner, M., Fassold, M. & Holzinger, A.
Archaeological Scavenger Hunt on Mobile Devices:
From e-Education to E-Business - A triple adaptive
mobile application for supporting Experts, Tourists
and Children. ICETE 2011 8th International Joint
Conference on e-Business and Telecommunications,
2011 Sevilla, Spain. SciTec, 131-136.
Korpipaa, P., Mantyjarvi, J., Kela, J., Keranen, H. &
Malm, E. J. 2003. Managing context information in
mobile devices. Pervasive Computing, IEEE, 2, 42-51.
Krishnamurthy, S., Chakraborty, D., Jindal, S. & Mittal, S.
Context-Based Adaptation of Mobile Phones Using
Near-Field Communication. Mobile and Ubiquitous
Systems - Workshops, 2006. 3rd Annual International
Conference on, 17-21 July 2006 2006. 1-10.
Longoria, R. 2001. Designing Mobile Applications:
Challenges, Methodologies, and Lessons Learned.
Usability Evaluation and Interface Design.
Marca, D., Bulander, R., Kruslin, C., Shishkov, B. &
Sinderen, M. 2012. e-Business challenges and
directions: important themes from the first ICE-B
workshop. e-Business and Telecommunications, 3-35.
Melanson, D. 2010. Microsoft Adaptive Keyboard
prototype debuts at center of UIST Student Innovation
Contest [Online]. Melanson, Donald. Available:
http://www.engadget.com/2010/08/12/microsoft-
adaptive-keyboard-prototype-debuts-at-center-of-uist-
s/ [Accessed 12 October 2011].
Schilit, B., Adams, N. & Want, R. Context-Aware
Computing Applications. Mobile Computing Systems
and Applications, 1994. WMCSA 1994. First
Workshop on, 8-9 Dec. 1994 1994. 85-90.
Schmidt, A. 2000. Implicit human computer interaction
through context. Personal Technologies, 4, 191-199.
Schmidt, A., Beigl, M. & Gellersen, H.-W. 1999. There is
more to context than location. Computers &
Graphics, 23, 893-901.
Van Sinderen, M. J., Van Halteren, A. T., Wegdam, M.,
Meeuwissen, H. B. & Eertink, E. H. 2006. Supporting
context-aware mobile applications: an infrastructure
approach. IEEE Communications, 44, 96-104.
Yuan-Kai, W. Context awareness and adaptation in mobile
learning. Wireless and Mobile Technologies in
Education, 2004. Proceedings. The 2nd IEEE
International Workshop on, 2004 2004. 154-158.
ICE-B 2012 - International Conference on e-Business
214
