
Integrating Kinect Depth Data with a Stochastic Object Classification
Framework for Forestry Robots
Mostafa Pordel, Thomas Hellstr
¨
om and Ahmad Ostovar
Ume
˚
a University, Ume
˚
a, Sweden
Keywords:
Image Processing, Depth Integration.
Abstract:
In this paper we study the integration of a depth sensor and an RGB camera for a stochastic classification
system for forestry robots. The images are classified as bush, tree, stone and human and are expected to
come from a robot working in forest environment. A set of features is extracted from labeled images to train
a number of stochastic classifiers. The outputs of the classifiers are then combined in a meta-classifier to
produce the final result. The results show that using depth information in addition to the RGB results in higher
classification performance.
1 INTRODUCTION
The major contribution of this paper is a study of the
effects of adding depth sensor information to an ob-
ject classification system that uses only RGB camera.
The system is aimed for a forestry robot and the task is
to classify images as one of the four classes bush, tree,
stone and human. In this paper object classification is
used to make the forestry robot capable of conduct-
ing applied tasks such as navigating in forest environ-
ments, collecting information about interest objects
etc. Object classification for this kind of Resource
Constrained Embedded Systems (RCES) is an emerg-
ing research area where real-time performance is one
of the main criteria for developed algorithms e.g. real-
time vision system for simultaneous localization and
mapping(Davison et al., 2007). In this work all the
needed calculations are done in less than a second that
is fast enough for the experimental level for RCESs.
Also it is possible to improve the calculation time
by using more powerful operating systems. In gen-
eral, object classification methods are either bottom-
up or top-down (Kokkinos et al., 2006) (Fang et al.,
2011). Top-down methods typically include match-
ing input data to a certain model or features of objects
(see e.g. (Xiao et al., 2010)). Bottom-up approaches
start with low level features of the image, like depth-
based features, color-based features etc. (see e.g. (He
et al., 2011)). More specifically, stochastic classifiers
in bottom-up style are studied for integration of depth
and RGB sensor features. A set of all features in-
cluding depth and RGB are used to train classifiers in
a three tier architecture for object detection as illus-
trated in Figure 1. It is possible to add very sophisti-
cated edge and corner features such that the four ob-
jects (trees, bushes, stones and humans) would be de-
tected easier. However this is beyond the main goal of
this paper, which is to study the integration of depth
sensor information in a generic stochastic classifica-
tion method. Finally, depth information is used to fa-
cilitate image labeling.
We extract 12 color-based features from RGB im-
ages, inspired by a project (
¨
Astrand and Baerveldt,
2002) with classification of sugar beets and weeds for
agricultural robots. Depth images are used to cal-
culate additional 6 features. The system uses five
stochastic classifiers and a Weighted Majority Vote
(WMV) method as a meta-classifier (Robert et al.,
2003) to fuse the individual classifiers. Classification
results are presented for three cases; color-based fea-
tures extracted from the entire image, color-based fea-
tures extracted from the color foreground image and
finally color-based and depth-based features extracted
from the color foreground image and depth image.
A database of images has been collected and labeled
with a tool described in Section 2. Section 3 describes
how the different components of the system are con-
nected. The sensor device is presented in Section4.
The used features are described in Section 5. Section
6 explains the used classifiers and also how these clas-
sifiers are combined together to increase the overall
performance. The results are presented in Section 7
and the effect of adding the depth sensor is analyzed.
Finally, conclusions and future research are described
314
Pordel M., Hellström T. and Ostovar A..
Integrating Kinect Depth Data with a Stochastic Object Classification Framework for Forestry Robots.
DOI: 10.5220/0004045203140320
In Proceedings of the 9th International Conference on Informatics in Control, Automation and Robotics (ICINCO-2012), pages 314-320
ISBN: 978-989-8565-22-8
Copyright
c
2012 SCITEPRESS (Science and Technology Publications, Lda.)
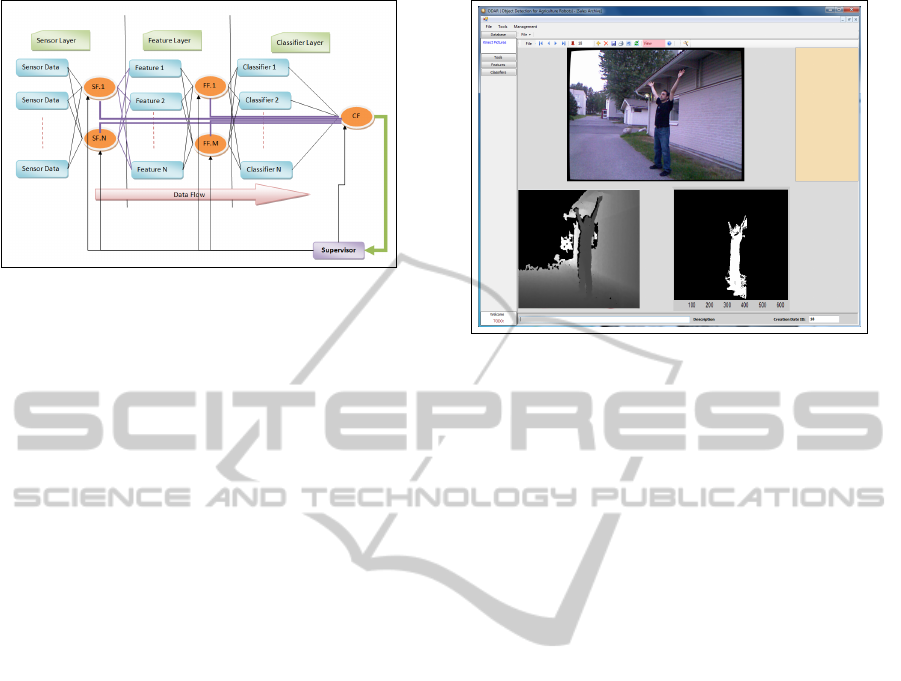
Figure 1: Framework for generic stochastic feature-based
object classification. (SF: Sensor Fusion, FF: Feature Fu-
sion, CF: Classifier Fusion).
in Section 8.
2 ODAR TOOL
ODAR (Object Detection for Agriculture Robots) is
a tool that integrates software components written in
C#, MATLAB and C++ for image analysis (see Fig-
ure 2). It interacts with sensors and collects images
into a database. ODAR also contains functionality for
image labeling. The user may select the desired ob-
ject in an RGB image and associate it with a specific
class. This process is called labeling. More specif-
ically, ODAR uses an algorithm that selects an area
when the user clicks on the image. It uses a filter to
search for connected pixels with similar RGB values.
For objects with many different colors e.g. a human
with clothes with many colors, the user may click on
multiple points to cover the entire object. This inter-
active solution works well, but the procedure is time
consuming and requires multiple clicks for some im-
ages. For this reason, we developed an automatic
method that uses depth images for object selection
within the RGB image, by removing the background
pixels from the RGB image. The procedure is similar
to what is described in Section 4.2 for background de-
tection used for calculation of features. In our experi-
ment, all images have been labeled with this method.
3 SYSTEM ARCHITECTURE
One way to increase the performance of an existing
classification solution is to add and fuse new compo-
nents, e.g. new sensors, features or classifiers. Our
system is built on a framework (Figure 1) that sup-
ports this approach. It comprises a Sensor Layer, a
Figure 2: ODAR is a tool that supports image analysis. It
collects images to a database and computes foreground im-
ages by using RGB and depth images.
Feature Layer and a Classification Layer. In each
layer, fusion of information may take place. In this
paper, a depth sensor and an RGB camera are fused
in the Sensor Layer to generate foreground images. In
the Feature Layer, 18 different depth-based and RGB-
based features are generated as described in Section
5. Finally, in the classification layer, classifier out-
puts are fused to generate a combined output. In the
following, the three layers will be described in more
detail.
4 SENSOR LAYER
This layer reads and fuses data from sensors (or from
the ODAR database) and provides the inputs for fea-
ture extraction in the Feature layer. In the remainder
of this section of paper, the Kinect sensor and sensor
fusion for background detection are presented.
4.1 Microsoft Kinect
In late 2010 Microsoft released the Kinect Device for
the Xbox console. Since then, several groups within
the robotics community have integrated Kinect with
their applications. ROS (Robotic Operating System)
(Van den Bergh et al., 2011) supports the device,
which increased its usefulness in robotics. In sum-
mer 2011, Microsoft introduced the SDK for Kinect
with a user friendly API that makes interaction much
easier. Kinect has an RGB camera, an infrared based
depth camera and a row of microphones. In this re-
search the microphones are not used. The depth cam-
era works well indoors in the limited range of 0.4 to 9
meters but has poor performance outdoors, in partic-
IntegratingKinectDepthDatawithaStochasticObjectClassificationFrameworkforForestryRobots
315
ular in sharp sunlight. However, we have successfully
used the Kinect camera for the experiments reported
in this paper. To collect a proper set of images we con-
cerned some limitations such as distance of object to
the camera, the strength and direction of sunlight. The
developed solutions can of course also be used with
other kinds of sensors that provide depth information
e.g. laser scanner which has wider working range and
higher depth image quality in different lightning con-
ditions in comparison to Kinect depth sensor.
4.2 Background Detection
The object of interest (the one that is the basis for the
labeling) in each picture is likely to be located in the
foreground of image. Background detection makes
it possible to compute features for the interesting ob-
ject, rather than for the entire image. Background de-
tection is often discussed and solved for sequences of
images or video frames rather than single RGB im-
ages. One common main technique in video back-
ground detection uses the differences between con-
secutive video frames to detect the background (Cuc-
chiara et al., 2003). However, this approach is not ap-
plicable for single images or for videos where the in-
teresting objects are not moving, such as stones in for-
est environments. Another common technique, which
is applicable for single images, uses morphological
filters to classify a specific pattern as background (e.g.
Poor lighting in parts of image) (Jimenez-Sanchez
et al., 2009). This approach is challenging in for-
est environments where objects and backgrounds are
very similar. Another possibility is to add a range sen-
sor like time of flight (TOF) sensor (Van den Bergh
and Van Gool, 2011) or stereo vision and build a 3D
model and detect the background using depth infor-
mation. In this project, we use a simple background
detection algorithm based on depth information and
the fact that is very likely in our object classification
problem that the object of interest would be located
in foreground image. The background mask B(I,j) is
computed from a depth image D(i,j), as follows:
if D(i, j) ≤ αD − mean then
B(i, j) ← 0
else
B(i, j) ← 1
end if
Where D-mean is the mean value of all elements in
D. This calculation is repeated for all pixels (i,j) in
D. The depth foreground image is then computed by
multiplying D element wise with mask B. For the
Kinect camera, D has lower resolution than RGB im-
age. B is therefore resized and then multiplied ele-
ment wise with the RGB image to generate the RGB
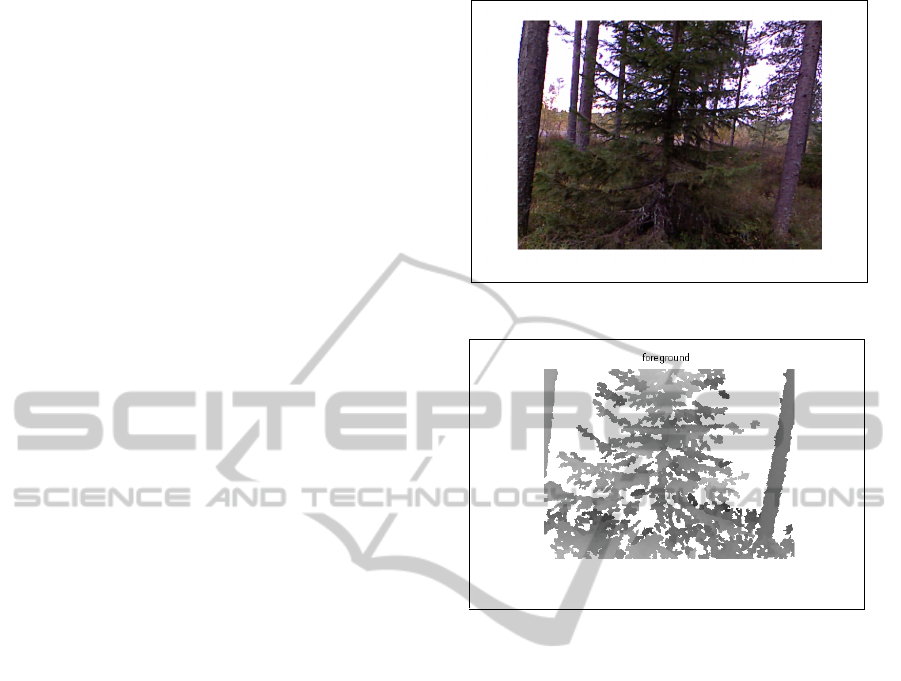
Figure 3: RGB Image of a tree.
Figure 4: Depth values from the Kinect camera is used to
detect the foreground objects of Figure 3.
foreground image. Parameter α is a number between
0 and 1 and determines how far from D-mean pix-
els are considered to be in foreground image rather
than background. It is set with maximum likelihood
estimation using a part of the training images, such
that manually marked foregrounds match the com-
puted foregrounds the most. For the images in our
database, α=0.5 was computed as optimal.
The computation of depth foreground and color
foreground images is an example of how sensor data
may be fused to produce new sensor data that can be
used by the subsequent Feature layer. Figure 4 shows
how the objects of interest appear in the Depth fore-
ground image. All depth-based features are extracted
from Depth foreground images while color-based fea-
tures are calculated from RGB foreground images (in
the result section, results with color-based features
calculated from the entire RGB images are also re-
ported).
ICINCO2012-9thInternationalConferenceonInformaticsinControl,AutomationandRobotics
316
5 FEATURE LAYER
In total, 18 features are extracted for each image pair
(RGB and Depth). They represent either color-based
or depth-based properties. Depth-based features are
extracted from depth foreground images (see Section
4.2). Hue, Saturation and Value (HSV) images are
calculated from the RGB images and are less sensitive
to image intensity and vary less to varying light condi-
tions. Therefore they often lead to better performance
in classification problems (Chen et al., 2007). For the
Hue, Saturation and Value images, as well as for each
color channel (R, G and B) the mean and variance
are computed as separate features. If the generated
features were directly given to the classifiers, features
with larger ranges would dominate smaller features
effects. Therefore, all features are normalized to zero
mean and unity standard deviation.
All color-based features are listed in Table 1.
Table 1: Color-based Features.
R,G,B-Mean Mean values of red, green, blue
R,G,B-Var Variances of red, green, blue
H,S,V-Mean Mean values of Hue, Saturation, Value
H,S,V-Var Variances of Hue, Saturation, Value
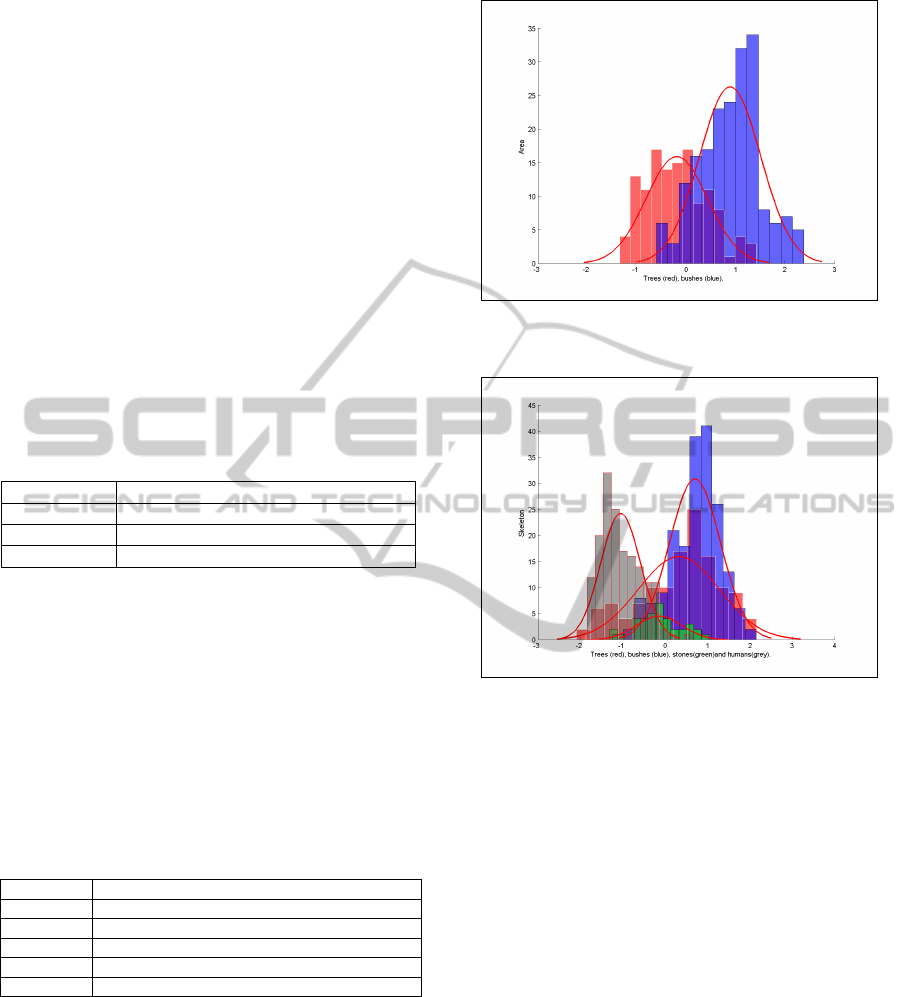
Table 2 shows depth-based features that are ex-
tracted from depth foreground images. The Skeleton
feature is based on the idea of removing maximum
number of pixels in the image without losing the over-
all connectivity in the image. The value of the Skele-
ton feature equals the number of remaining pixels.
This feature has been used for a long time in com-
puter vision, optical character recognition and pattern
classification (Lakshmi and Punithavalli, 2009). The
Skeleton feature in Figure 6 is computed for the depth
foreground image in Figure 4.
Table 2: Depth-based features.
D-mean Mean value of foreground depth image
D-var Variance of foreground depth image
Skeleton Number of pixels in Skeleton image
Dispersion Distribution of foreground depth image
Perimeter Length of perimeter of foreground depth image
Area Area of foreground object
The Area feature is computed as the number of
pixels in the depth foreground image. The Dispersion
feature is calculated by dividing the Skeleton feature
by the Area. For stones, which typically have low
depth variations, the Skeleton feature is small. The
Dispersion is also small for stones compared to trees
or bushes where, for the same Area, the Skeleton fea-
ture is larger. In short, Dispersion shows how dis-
tributed an object is over the image. The Dispersion
feature in Figure 9 is computed for the depth fore-
ground image in Figure 4.
Figure 5: Class histograms and fitted distributions for the
Area feature. It helps distinguishing trees from bushes.
Figure 6: Class histograms and fitted distributions for the
Skeleton feature.
The computation of Dispersion feature is an ex-
ample of how features may be fused to produce addi-
tional features for the subsequent Classifier layer.
Depth features help distinguishing trees from
bushes, which can be a hard task even for humans.
Images with trees usually include trunks that have less
variation in depth and also smaller depth mean. Fig-
ure 5 illustrates how trunks effect depth information.
Perimeter is another feature that gives information
about shape of the object. It is computed as the num-
ber of pixels in the identified perimeter in the image
(see Figure 7).
Figure 8 shows the distribution of normalized
perimeter for the collected images of trees, bushes,
stones and human.
6 CLASSIFIER LAYER
Five stochastic classifiers are used for classification:
Naive Bayes (Friedman et al., 1997), Decision Trees
IntegratingKinectDepthDatawithaStochasticObjectClassificationFrameworkforForestryRobots
317

Figure 7: The Perimeter for the depth foreground image
shown in Figure 4. The Perimeter feature is the number of
pixels in the perimeter.
Figure 8: Class histograms and fitted distributions for the
Perimeter feature.
Figure 9: Class histograms and fitted distribution for the
normalized Dispersion feature.
(Wang et al., 2008), K-Nearest Neighbor (KNN)
(Zhang et al., 2006), Support Vector Machine (SVM)
(Li et al., 2009) and Linear Discriminant Analysis
(LDA) (An et al., 2009). These classifiers are generat-
ing the naive results that are given to a meta-classifier
to be fused in order to make the final result. All men-
tioned classifiers, except SVM, train very fast. With
a 3 gigahertz processor, the entire training phase (ex-
cluding SVM) with 650 images, (see Section 2) takes
less than one second, which is fast enough also for
real-time online training (see (Wang et al., 2008), (An
et al., 2009)) if the system would be implemented on
a real-time platforms like FPGA (Pordel et al., 2011),
(An et al., 2009). SVM trains slower, but all meth-
ods including SVM (Li et al., 2009) can provide real-
time classification after training. The basic version of
an SVM classifier only works with two classes. In
this project we use the ”One Versus Rest” technique
(Zhang et al., 2007) to extend the SVM to work with
four classes.
Table 3: Accuracy without background subtraction using
color-based features only.
Classifier Training Testing
accuracy accuracy
KNN 94.74% 90.51%
DT 95.84% 77.22%
SVM 93.91% 90.51%
NB 86.15% 79.75%
LDA 96.687% 77.85%
WMV - 89.87%
All classifier outputs are combined by Weighted
Majority Vote rule (WMV)(De Stefano et al., 2002).
WMV does not need training, but uses the accuracy
of the individual classifiers to determine the weights
for each classifier. The accuracy A(i) (fraction cor-
rect classifications) for each classifier i is computed
by averaging the accuracy from 10-folds cross valida-
tion. w(i), the weight for classifier i is computed such
that all weights add up to 1:
w(i) = A(i)/(
5
∑
j=1
A( j))
The WMV classifier computes a fused classification f
according to:
f = argmax
i
5
∑
j=1
(w( j) × I(C( j) = i))
Where C(j) is the classification delivered by classifier
j and I is an indicator function (James and Stanford
University, 1998) computing to 1 if the argument is
true and to 0 otherwise. In other words, f is the class
with the largest number of weighted votes.
7 RESULTS
As a rule of thumb, the training set should be about
10 times the number of features used in classifica-
tion (Jain et al., 2000). For the 18 features that are
ICINCO2012-9thInternationalConferenceonInformaticsinControl,AutomationandRobotics
318
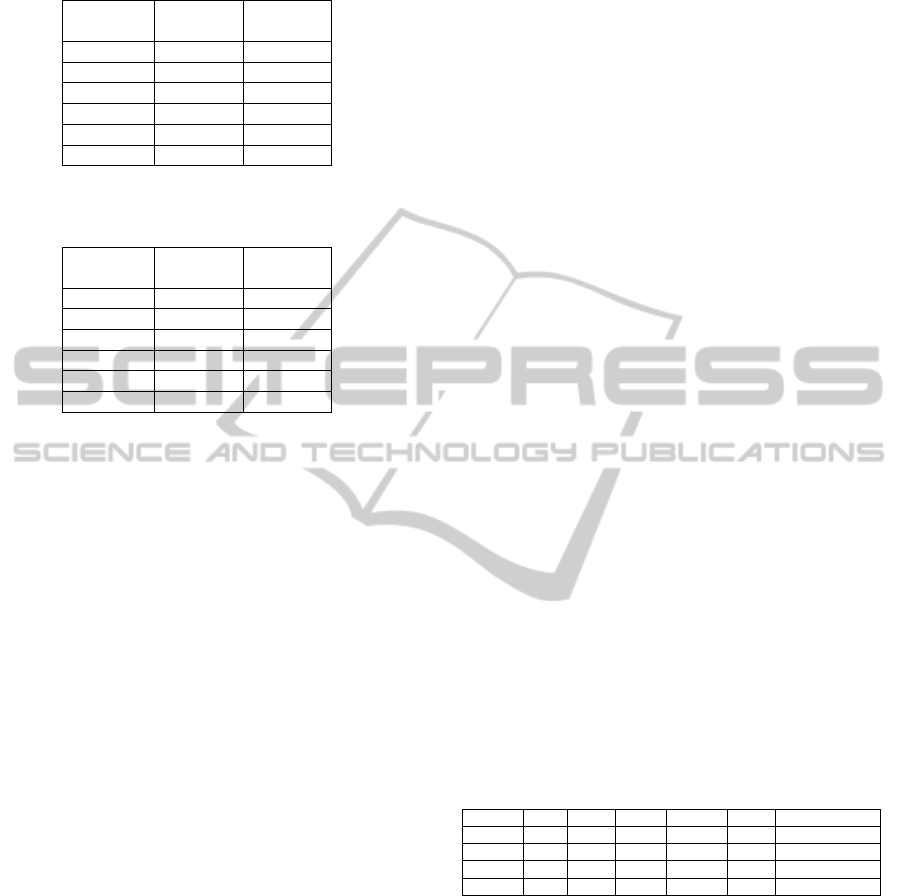
Table 4: Accuracy with background subtraction using color-
based features only.
Classifier Training Testing
accuracy accuracy
KNN 93.35% 87.34%
DT 96.12% 83.54%
SVM 91.14% 89.24%
NB 83.93% 68.35%
LDA 97.51% 93.67%
WMV - 93.04%
Table 5: Accuracy with background subtraction using color-
based and depth-based features.
Classifier Training Testing
accuracy accuracy
KNN 97.23% 94.94%
DT 97.51% 81.65%
SVM 93.91% 94.30%
NB 89.75% 72.15%
LDA 98.06% 88.61%
WMV - 96.20%
described in Section 5, 150 samples have been col-
lected for each object type and the database has in
total 650 RGB and depth images. From this set, 80%
is used for training, 10% for 10 fold cross-validation
of the classifiers and the last 10% for final testing of
WMV meta-classifier. The entire process is repeated
10 times for 10 fold cross-validation also for WMV. In
order to study the effect of adding depth information,
classification results are computed for three different
cases. Classification results for the five classifiers and
the fused WMV classifier are presented in Tables 3,
4, and 5. Accuracy for both training data and test data
are presented and is computed as the fraction of suc-
cessful classifications over the respective set.
The results for the first case, color-based features
extracted from the entire input images (without back-
ground subtraction) have the worst performance.
In the second case, with color-based features com-
puted from color foreground images, the classification
results are better. The reason is that the features are
computed for a more relevant part of the images, and
hence are less noisy compared to the first case.
In the third case, depth-based and color-based fea-
tures are extracted from foreground images. The re-
sults show how the added depth-based features im-
prove the classification accuracy.
Table 6, shows the confusion matrix for WMV and
case three. Of special interest is the low confusion be-
tween trees and bushes, which may be hard to distin-
guish between also for a human.
8 CONCLUSIONS AND FUTURE
WORKS
The results obviously show that using depth sensor
information for subtracting background and adding
depth based features improves the classification accu-
racy. Background subtraction is essential for compu-
tation of all features and can be easily implemented
using depth sensor information. Furthermore, depth
sensor information can facilitate image labeling as de-
scribed in Section 4.2.
On the other hand, due to the limited depth range
of the Kinect sensor, objects have to be located be-
tween 0.4 and 9 meters from the device. Also, the
depth image quality is too low in challenging outdoor
environments such as in sharp sunlight. However, the
results show that it is possible to use the Kinect sensor
outdoors in non-direct sunlight and for cloudy days.
A continuation of this project is to improve the ac-
curacy by adding corner and edge features that in gen-
eral could describe the image structure more specifi-
cally. In later stages of this project, other types of
objects like branches, leaves and peduncles will be
added to the list of object classes. In addition, we may
integrate laser scanner and a high resolution RGB
camera to improve depth and color information. Ad-
dressing the problem of over-fitting, which may occur
in any learning method, we will integrate an algorithm
to diagnose over-fitting and address it by a feature se-
lection algorithm. By selecting the best subsets of fea-
tures, the accuracy of the overall system may increase
(see e.g. (Marcano-Cede ando et al., 2010)). Finally,
we plan to use compression methods like PCA and
GPLVM to maximize the overall accuracy similar to
what is described in (Zhong et al., 2008).
Table 6: Confusion matrix for WMV classifier in Table 5.
Class Tree Bush Stone Human Total Miss-classified
Tree 38 1 0 0 39 2%
Bush 0 58 0 0 58 0%
Stone 2 0 10 0 12 16%
Human 3 0 0 46 49 6%
ACKNOWLEDGEMENTS
This work was funded by the European Commission
in the 7th Framework Programme (CROPS GA no
246252).
REFERENCES
An, K. H. and Park, S. H. and Chung, Y. S. and Moon, K.
Y. and Chung, M. J. (2009). Learning discriminative
IntegratingKinectDepthDatawithaStochasticObjectClassificationFrameworkforForestryRobots
319

multi-scale and multi-position lbp features for face de-
tection based on ada-lda. In Robotics and Biomimet-
ics (ROBIO), 2009 IEEE International Conference on,
pages 1117 –1122.
¨
Astrand, B. and Baerveldt, A.-J. (2002). An agricultural
mobile robot with vision-based perception for me-
chanical weed control. Autonomous Robots, 13:21–
35.
Chen, W., Shi, Y., and Xuan, G. (2007). Identifying com-
puter graphics using hsv color model and statistical
moments of characteristic functions. In Multimedia
and Expo, 2007 IEEE International Conference on,
pages 1123 –1126.
Cucchiara, R., Grana, C., Piccardi, M., and Prati, A. (2003).
Detecting moving objects, ghosts, and shadows in
video streams. Pattern Analysis and Machine Intel-
ligence, IEEE Transactions on, 25(10):1337 – 1342.
Davison, A. J., Reid, I. D., Molton, N. D. and Stasse, O.
(2007). Monoslam: Real-time single camera slam.
IEEE Transactions on Pattern Analysis and Machine
Intelligence, 29(6):1052–1067.
De Stefano, C., Della Cioppa, A., and Marcelli, A. (2002).
An adaptive weighted majority vote rule for combin-
ing multiple classifiers. In Pattern Recognition, 2002.
Proceedings. 16th International Conference on, vol-
ume 2, pages 192 – 195 vol.2.
Fang, Y., Lin, W., Lau, C. T., and Lee, B.-S. (2011). A vi-
sual attention model combining top-down and bottom-
up mechanisms for salient object detection. In Acous-
tics, Speech and Signal Processing (ICASSP), 2011
IEEE International Conference on, pages 1293 –1296.
Friedman, N., Geiger, D. and Goldszmidt, M. (1997).
Bayesian network classifiers. Machine Learning,
29(2-3):131–163.
He, L., Wang, H., and Zhang, H. (2011). Object detection
by parts using appearance, structural and shape fea-
tures. In Mechatronics and Automation (ICMA), 2011
International Conference on, pages 489 –494.
Jain, A. K., Duin, R. P. W., and Mao, J. (2000). Statistical
pattern recognition: A review. IEEE Transactions on
Pattern Analysis and Machine Intelligence, 22(1):4–
37.
James, G. and Stanford University. Dept. of Statistics
(1998). Majority vote classifiers: theory and appli-
cations. Stanford University.
Jimenez-Sanchez, A., Mendiola-Santibanez, J., Terol-
Villalobos, I., Herrera-Ruiz, G., Vargas-Vazquez, D.,
Garcia-Escalante, J., and Lara-Guevara, A. (2009).
Morphological background detection and enhance-
ment of images with poor lighting. Image Processing,
IEEE Transactions on, 18(3):613 –623.
Kokkinos, I., Maragos, P., and Yuille, A. (2006). Bottom-up
amp; top-down object detection using primal sketch
features and graphical models. In Computer Vision
and Pattern Recognition, 2006 IEEE Computer Soci-
ety Conference on, volume 2, pages 1893 – 1900.
Lakshmi, J. and Punithavalli, M. (2009). A survey on skele-
tons in digital image processing. In Digital Image Pro-
cessing, 2009 International Conference on, pages 260
–269.
Li, R., Lu, J., Zhang, Y., Lu, Z., and Xu, W. (2009). A
framework of large-scale and real-time image annota-
tion system. In Artificial Intelligence, 2009. JCAI ’09.
International Joint Conference on, pages 576 –579.
Marcano-Cede ando, A., Quintanilla-Domi andnguez, J.,
Cortina-Januchs, M., and Andina, D. (2010). Fea-
ture selection using sequential forward selection and
classification applying artificial metaplasticity neural
network. In IECON 2010 - 36th Annual Conference
on IEEE Industrial Electronics Society, pages 2845 –
2850.
Pordel, M., Khalilzad, N., Yekeh, F., and Asplund, L.
(2011). A component based architecture to im-
prove testability, targeted fpga-based vision systems.
In Communication Software and Networks (ICCSN),
2011 IEEE 3rd International Conference on, pages
601 –605.
Robert S. Lynch Jr. and Peter K. Willett (2003). Use of
bayesian data reduction for the fusion of legacy clas-
sifiers. Information Fusion, 4(1):23–34.
Van den Bergh, M., Carton, D., De Nijs, R., Mitsou,
N., Landsiedel, C., Kuehnlenz, K., Wollherr, D.,
Van Gool, L., and Buss, M. (2011). Real-time 3d hand
gesture interaction with a robot for understanding di-
rections from humans. In RO-MAN, 2011 IEEE, pages
357 –362.
Van den Bergh, M. and Van Gool, L. (2011). Combining rgb
and tof cameras for real-time 3d hand gesture inter-
action. In Applications of Computer Vision (WACV),
2011 IEEE Workshop on, pages 66 –72.
Wang, J., Wu, Q., Deng, H., and Yan, Q. (2008). Real-
time speech/music classification with a hierarchical
oblique decision tree. In Acoustics, Speech and Signal
Processing, 2008. ICASSP 2008. IEEE International
Conference on, pages 2033 –2036.
Xiao, Q., Hu, X., Gao, S., and Wang, H. (2010). Object de-
tection based on contour learning and template match-
ing. In Intelligent Control and Automation (WCICA),
2010 8th World Congress on, pages 6361 –6365.
Zhang, J., Marszalek, M., Lazebnik, S., and Schmid, C.
(2007). Local features and kernels for classification of
texture and object categories: A comprehensive study.
International Journal of Computer Vision, 73(2):213–
238.
Zhang, H., Berg, A. C., Maire, M. and Malik, J. (2006).
Svm-knn: Discriminative nearest neighbor classifica-
tion for visual category recognition. volume 2, pages
2126–2136.
Zhong, F., Capson, D., and Schuurman, D. (2008). Par-
allel architecture for pca image feature detection us-
ing fpga. In Electrical and Computer Engineering,
2008. CCECE 2008. Canadian Conference on, pages
001341 –001344.
ICINCO2012-9thInternationalConferenceonInformaticsinControl,AutomationandRobotics
320
