
Managing Literature Reviews Information through Visualization
Sandra Fabbri
1
, Elis Hernandes
1
, Andre Di Thommazo
1,2
, Anderson Belgamo
1,3
,
Augusto Zamboni
1
and Cleiton Silva
2
1
Software Engineering Research Lab, Universidade Federal de São Carlos, São Carlos, SP, Brazil
2
Instituto Federal de Educação, Ciência e Tecnologia de São Paulo, São Carlos, SP, Brazil
3
Instituto Federal de Educação, Ciência e Tecnologia de São Paulo, Piracicaba, SP, Brazil
Keywords: Systematic Literature Review, Systematic Mapping, Tool, Visualization.
Abstract: Systematic Literature Review (SR) and Systematic Mappings (SM) are scientific literature review
techniques that follow well-defined stages, according to a protocol previously elaborated. The goal is
helping in finding evidence about a particular research topic and mapping a research area, respectively.
Their steps are laborious and a computational support is essential to improve the quality of their conduction.
Aiming to offer computational support to these types of reviews, the StArt (State of the Art through
Systematic Review) tool was developed. Besides the expected functionalities, StArt generates studies score,
uses information visualization and text mining techniques to facilitate the research area mapping and to
identify the studies relevance. StArt has been developed through an incremental process by academics who
adopt SR and SM. As the expectation is to have a tool that really aids the conduction of these types of
reviews, new ideas are always investigated and make StArt different from other alternatives. Visualization
and text mining techniques seems to be a powerful resource for facilitating data abstraction in the context of
SRs and SMs, allowing the improvement of the review and the conclusions about it.
1 INTRODUCTION
The Systematic Literature Review process (SR or
SM) has its origins in the medical area and its
objective, according to Pai et al. (2004), is the
creation of a complete and impartial summary about
a given research topic following well defined and
known procedures. Recently, this process is being
adapted to the computer science area, particularly in
Software Engineering (Kitchenahm, 2004). Some
advantages of the SR usage are the coverage, the
replicability and the reliability of its process.
Besides systematizing the search for relevant
studies, the SR predicts the organization and the
analysis of the obtained results. However, the SR
process is more laborious than the research
conducted on an informal basis (Kitchenahm, 2004).
A previous activity to the SR should can be the
Systematic Mapping (SM) which objective,
according to Petersen et al. (2008), is to build a
classification scheme and to structure a software
engineering research area. Like a SR, SM is also a
laborious activity and its process is similar to the SR
process, with many repetitive steps. One of the main
differences between SR and SM is that the desired
results of SMs are mainly quantitative but not
qualitative and the studies should not be read in full.
Despite this fact, quantitative data can also aid the
summarization that should be provided by a SR.
Thus, considering that there are several steps to
be executed and several documents to be managed,
the computer support can aid the conformance to the
SR and SM processes, enabling higher quality in
their execution.
Since 2006 the Start tool (Montebelo et al, 2007)
has been developed. In 2008 it was completely
restructured and the new version was available
(Zamboni et al., 2010) (Hernandes et al., 2010). This
version gave full support to carry out SRs and
currently, visualization and text mining resources are
being added for easing data summarization since, in
general, there is a lot of data for transforming into
knowledge, which is a challenge. As mentioned by
Burley (2010), information visualization is a
valuable tool for knowledge integration activities
and, in StArt, such views allow the researcher to
find, in a simple way, information on the most
important events, the evolution of the research topic
by the academic community, and so on. This
36
Fabbri S., Hernandes E., Di Thommazo A., Belgamo A., Zamboni A. and Silva C..
Managing Literature Reviews Information through Visualization.
DOI: 10.5220/0004004000360045
In Proceedings of the 14th International Conference on Enterprise Information Systems (ICEIS-2012), pages 36-45
ISBN: 978-989-8565-11-2
Copyright
c
2012 SCITEPRESS (Science and Technology Publications, Lda.)

information is very common in SM.
Another important contribution that has been
reached with information visualization in StArt is
the evaluation of the search strings quality. An
important point in this kind of literature reviews is to
find and ensure that the search strings bring all the
relevant studies on the research topic. The Start tool
provides a visualization of all the studies retrieved as
well as their references. Hence, it is possible
identifying for example, if a frequently cited
reference was or was not retrieved by the search
string.
Based on this context, the objective of this paper
is to explore the contributions of information
visualization for this kinds of literature reviews.
Section 2 presents an overview of StArt
functionalities and highlights some features that aid
the control of the processes related to these kinds of
literature reviews. Section 3 explains the
visualization support provided by StArt and how it
can be used to enhance the summarization of the
investigated topic. Section 4 presents the support of
text mining processing and Section 5 presents the
conclusions and future work.
2 AN OVERVIEW OF THE StArt
Before explaining how information visualization and
text mining processing help on identifying important
information for SM and SRs, an overview of the
main functionalities of StArt is presented below. As
mentioned before, the processes of SR and SM have
some repetitive steps and require discipline and
systematic practice from the researcher. The
information must be registered in an organized way,
such that the expected results are reached, the
process can be replicable and all the information can
be packed.
Thus, StArt has been developed for providing
automated support to as many steps as possible.
Functionalities to ease data summarization were also
implemented in the tool as the possibility to display
data through visualization and Excel formatted
reports, according to the researcher’s needs.
As the SM process is a subset of the SR process,
StArt was initially planned to support SRs and
currently it is being adapted to also support SMs.
Figure 1 illustrates the general process of SR,
highlighting what is done with (left side) and
without (right side) StArt support. As electronic
scientific databases do not allow automated search
of primary studies, steps 2, 3 and 4 must be executed
without the support of the tool. They are: the
adjustment of search strings in search engines,
which happens while the protocol is being defined
and reviewed; the execution of these search strings
after the protocol approval; and the exportation of
the search result in a BibTex file, respectively. The
step numbers used in this figure will be used in the
explanation of the StArt functionalities.
The main functionalities of StArt are presented
in the screen shot of Figure 2. At the left side there is
the hierarchical directory tree with the SR process
phases. At the right side, the information associated
to the functionality selected on the left side is
presented.
Shortly, the goals of the three phases are:
Planning Phase, which consists of the protocol
filling (Step 1 of Figure 1);
Execution Phase, which is composed of Studies
Identification (Steps 2, 3, 4, and 5 of Figure 1),
Selection (Steps 6, 7, and 8 of Figure 1) and
Extraction (Step 9 of Figure 1). In this phase
the researcher should identify the studies, select
them and extract the relevant information for
answering the research question.
Summarization Phase (Steps 10 and 11 of
Figure 1), which corresponds to the analysis of
the data extracted from each accepted study and
the elaboration of a final report describing the
state of the art. For this phase, StArt provides
graphics, spreadsheets and data visualizations,
aiming to make the researcher’s tasks easier.
Such options will be detailed in Section 4.
Following, each phase is detailed, exemplifying
the support provided by the StArt tool.
2.1 Planning
In this phase StArt supports the SR Protocol
elaboration (Step 1 of Figure 1) according to the
attributes suggested by Kitchenham (2007). Some of
the attributes are: research question definition;
keywords that will be used for searching for studies;
search engines; criteria for acceptance or rejection of
studies; etc. There is a help message for each
protocol attribute aiming to guide its filling. The
protocol is stored in the tool and can be accessed and
modified if necessary. It is worth noting that, to
ensure the SR process conformance, the content of
the protocol fields are reflected in later steps of the
SR process. For example, when a search engine is
chosen during the protocol filling, it is added under
the Studies Identification of the Execution Phase, as
shown in Figure 3. Similarly, each attribute inserted
in the Information Extraction Form Attributes during
the protocol filling becomes a field that must be
ManagingLiteratureReviewsInformationthroughVisualization
37
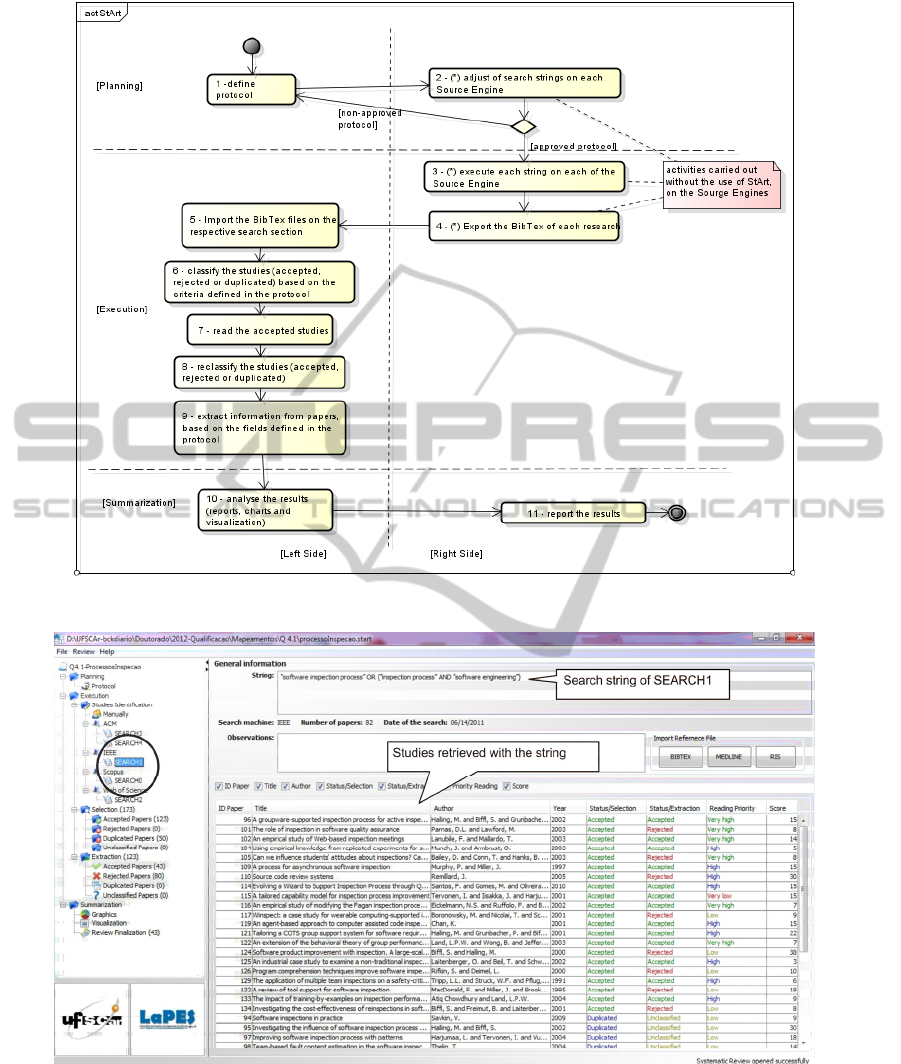
Figure 1: SLR steps: Left side – actions supported and Right side – actions not supported by StArt.
Figure 2: Overview of the StArt tool.
filled in during the Extraction Step (Step 9 of Figure
1), as shown in Figure 4.
2.2 Execution
This phase of the SR has three steps according to the
guidelines proposed by Kitchenham (2004) (2007).
The first one is Studies Identification (Steps 2 to 5 of
Figure 1). In this step, the researcher should adjust the
search string using the keywords earlier defined in the
protocol. After this step, the strings should be applied
in each search engine, for example, IEEE, Scopus,
ICEIS2012-14thInternationalConferenceonEnterpriseInformationSystems
38

ACM, Springer and Web of Science. This action is
not supported by the tool and the search results must
be imported into StArt, As the studies are being
imported into the tool, it assigns a score for each
study according to the occurrences of the keywords
defined in the protocol, in the studies title, abstract
and keywords list. This score can be used, for
example, to establish an order of reading once studies
with higher scores should be more relevant to the SR.
Also, if the studies with higher scores are not relevant
to the research question, it is possible that the strings
should be revisited and improved. The string
definition is an important point to the success of SRs,
and its quality can be accessed through visualization
provide by StArt, which is explored and presented in
Section 4.
The second step is Studies Selection (Step 6 of
Figure 1). In this step, the researcher should use the
inclusion and exclusion criteria, defined in the
protocol, to classify the studies as accepted or
rejected. Duplicated studies are automatically
identified by the tool. When the study is accepted, the
researcher can attribute to it a relevance level (Very
High, High, Low or Very Low).
The third step is Extraction (Steps 7, 8 and 9 of
Figure 2). At this step, the researcher must read the
full version of each study “Accepted study”, elaborate
a summary and fill in the Information Extraction
Form of each study (Figure 4-B).
Aiming to facilitate this step, it is possible to link
the studies full text file (e.g. PDF files) with their
record in the tool.
2.3 Summarization
In this phase (Step 10 of Figure 2), StArt provides
the following facilities:
Easy access to the information of all studies
accepted in Extraction Step. Comments and
information extracted in previous steps can be
accessed and copied to a text editor added in the
tool. After collecting that information, the
researcher can transfer this initial version of the
summary to a more powerful text editor.
Generation of charts that support a quantitative
SR characterization. For example: the percentage
of studies identified by each search engine, the
percentage of studies accepted, rejected and
duplicated in Extraction step, the times that each
inclusion and exclusion criterion was used for
classifying the studies as accepted or rejected
(Figure 11). In fact, this kind of quantitative data
is particularly relevant for Systematic Mappings
(Petersen et al, 2008). In case the researcher
choose to do meta-analysis, carry out statistical
tests or elaborate other charts, StArt can generate,
among other reports, a spreadsheet that allows
data manipulation outside the tool. These reports
can be generated according to researchers’ needs,
based on options that allow grouping data in
different ways, (Figure 5-A), applying different
filters (Figure 5-B) and choosing specific
characteristics of the studies (Figure 5-C). Figure
5-D shows a preview of the report.
Deal with a large volume of data to discover
features, patterns and hidden trends through
visualization. When an SR or SM process is
finished, there is a large amount of data related to
the research topic that can show trends in the
evolution of the topic over time, which is
interesting information to explain the state of the
art. As mentioned before, the information
visualization is a helpful tool for knowledge
integration activities.
3 VISUALIZATION IN StArt
Considering the importance of quantitative data for
both the SR and SM and the fact that information
visualization explores the natural visual ability of
humans aiming to facilitate information processing
(Gershon, Eick, Card, 1998), StArt uses
visualization to facilitate knowledge management
about literature reviews. Using effective visual
interfaces, it is possible to quickly manipulate large
volumes of data to discover characteristics, patterns
and hidden trends.
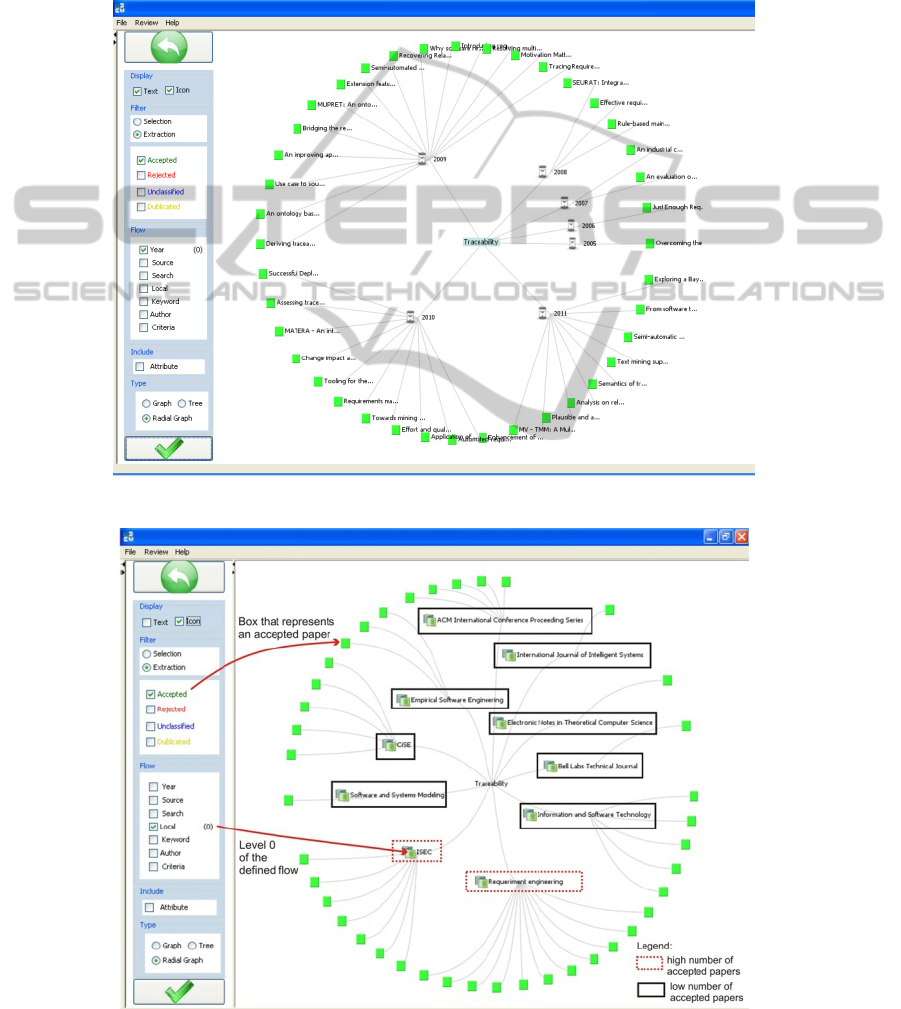
Based on visualization, for example, it is easier
to realize how a specific research topic evolved over
time. See Figure 6 where the researcher’s interest
was to understand how the topic “traceability” was
explored by the academic community, in relation to
the question investigated in this example. It is easy
to identify that in 2005 and 2006 there was only one
study published; in 2007 and 2008 there were few
additional studies, but in 2009, 2010 and 2011, the
number of studies that mentioned the research topic
was more significant than in the previous years.
To build this visualization, the researcher should
select the following options (Figure 6): green
rectangle representing an accepted study; part of the
study title nearby the rectangle, the publication year
as the grouping filter, and the Radial Graph as the
visualization technique.
Now, suppose that the researcher would like to
identify appropriated places for submitting a study
or for publishing results of a literature review. In this
ManagingLiteratureReviewsInformationthroughVisualization
39
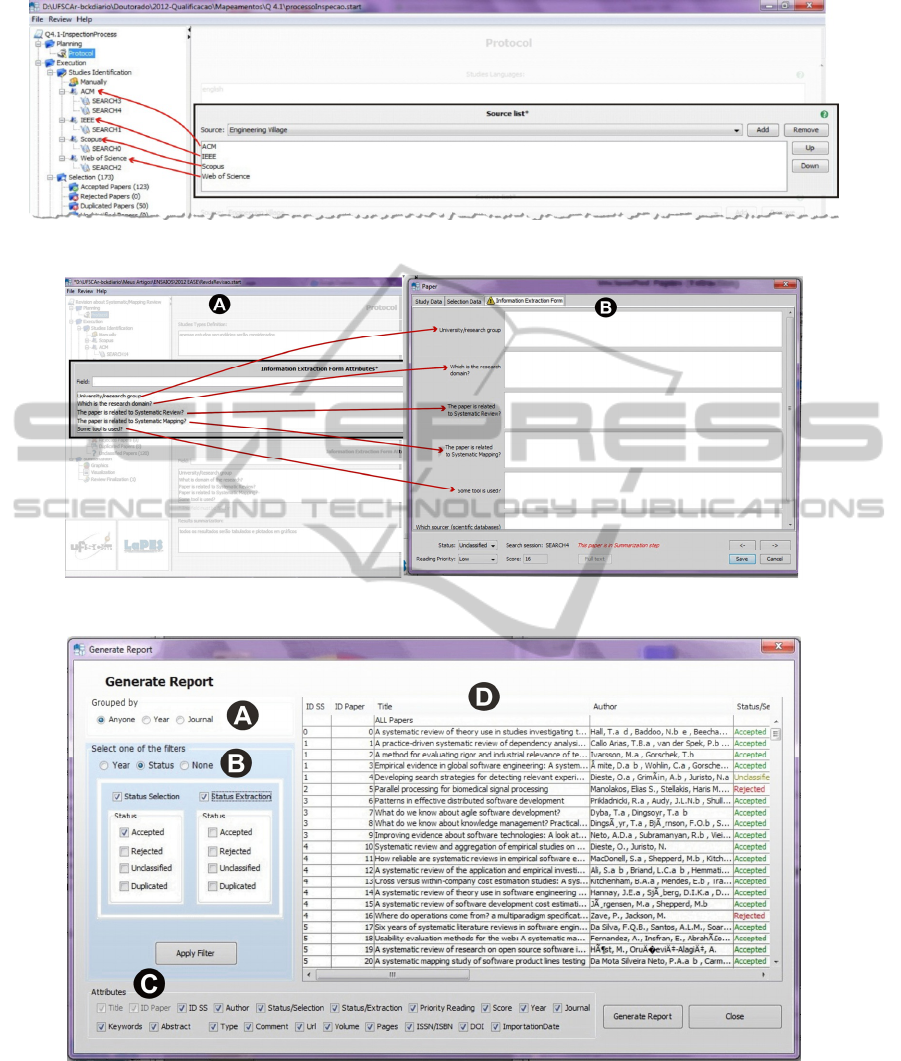
Figure 3: Search engines defined in the protocol are automatically inserted under Studies Identification.
Figure 4: Relationship between attributes defined in the protocol and the form available during the Extraction step.
Figure 5: Options for specifying reports.
case he/she should select almost the same options
mentioned before, exchanging year by place. This
visualization (Figure 7), allows identifying the main
discussion forums for the topic under investigation.
Observe that some places have few studies related to
“traceability”, while some others have have more
publications on this topic. Besides, the visualization
type was Radial Graph and the studies titles were
omitted.
If the researcher wishes to merge both the
previous analysis in one graph, it would be better to
use a different visualization type. In this case the
ICEIS2012-14thInternationalConferenceonEnterpriseInformationSystems
40
Tree technique seems better, as shown in the
screenshot of Figure 8. The researcher can expand
the levels according to their need.
A double click on a selected study shows
information (like authors, abstracts, etc) about it.
In addition to the features described above,
visualization is also used to show the relationship
among the studies recovered in literature review.
This information allows evaluating the set of studies
and enhancing the search for them. This resource is
better explained in next section.
4 TEXT MINING IN StArt
According to Dunne et al. (2012), the growing
number of publications combined with increasingly
Figure 6: Visualization of publications on “traceability” over time.
Figure 7: Visualization of places where “traceability” has been published.
ManagingLiteratureReviewsInformationthroughVisualization
41
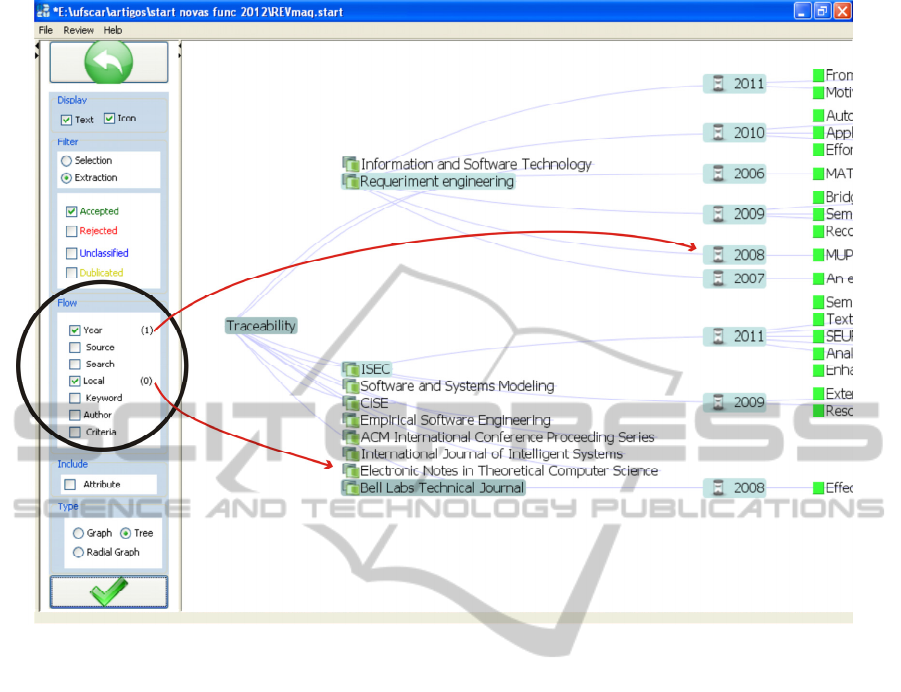
Figure 8: Visualization of places where “traceability” has been published according to the year.
cross-disciplinary sources makes it challenging to
follow emerging research topics and identify key
studies. It is even harder to begin exploring a new
field without a starting set of references.
During the conduction of literature reviews many
studies are retrieved from various search engines
through search strings. Hence, the researcher must
be careful not to leave out any studies that may be
relevant. According to Boell and Cezec-Kecmanovic
(2010), the usual problem of systematic reviews is
that the more inclusive the search strategy, the more
irrelevant studies will be retrieved; the more precise
and specific the search strategy, the more relevant
studies will be missed.
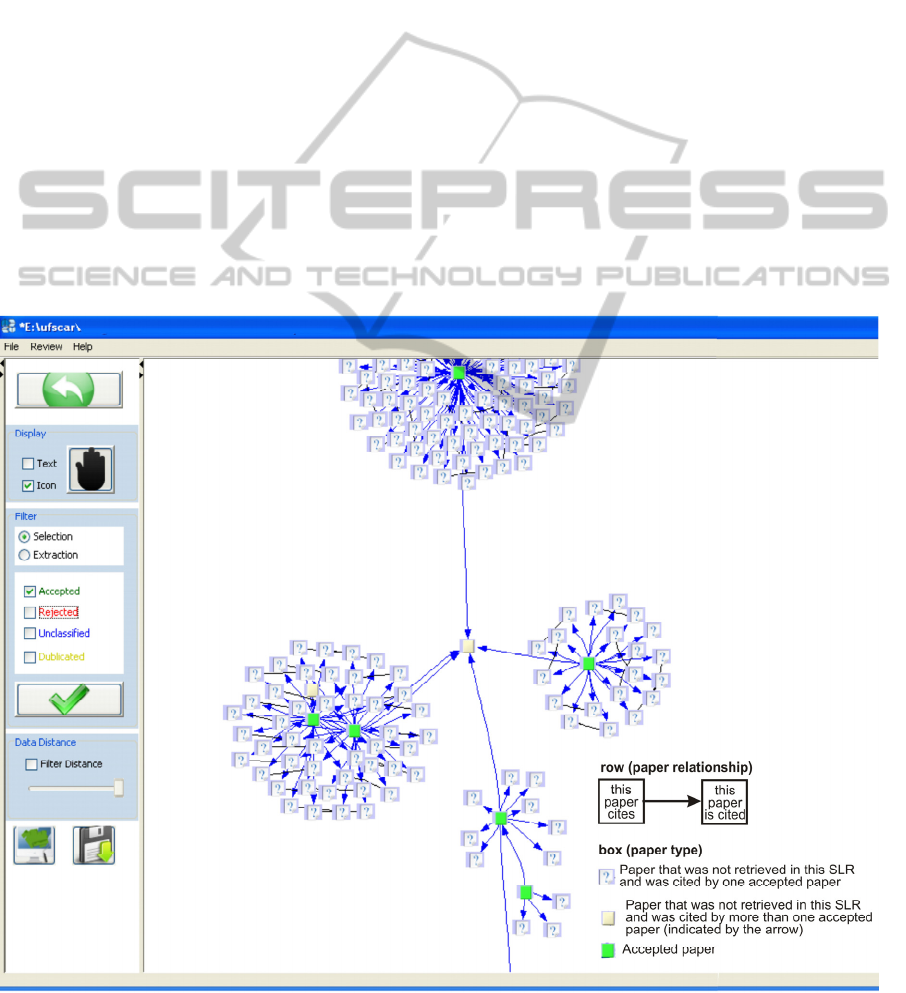
In order to help minimizing this problem, StArt
provides support to identify the references of each
study retrieved by the search strings. This support
allows knowing if there are studies not retrieved, but
referenced.
As the search engines generally do not provide
the list of references from each study, this
information is obtained by reading and extracting the
references of the PDF files of the retrieved studies.
Every time a PDF file is linked to a study, StArt
searches the references in the PDF file. Aiming to
identify information like authors, publication place
and title, regular expressions are used to identify the
bibliographic reference template that was used
(APA, Harvard, IEEE, etc.). To determine which
study is related to another one, the similarity
between the titles of the studies is calculated using
the text mining algorithm proposed by Salton
(1989). The result of this process is shown through
visualization as presented in Figure 9. The study in
the centre of the figure was not retrieved in the
literature review, but is referenced by five studies
that were retrieved.
This functionality is especially useful during the
execution of pilot literature reviews, which should
be conducted for adjusting the protocol and the
search strings, as suggested by Kitchenham (2007).
If there are studies not found but referenced many
times, the researcher should verify, for example, if
the keywords of these studies should be considered
in the protocol and search strings. If so, a new search
applying these new keywords must be performed
aiming to find relevant studies that were missed.
Start also offers the functionality for detecting
which of the studies imported into the tool are
similar. The similarity is calculated based on the
ICEIS2012-14thInternationalConferenceonEnterpriseInformationSystems
42
abstracts through Vector Processing Model (Salton,
Allan, 1994). The result of this processing is shown
in a table as presented in Figure 10. This table
provides a list of similar studies and their respective
similarity grade in relation to a study previously
selected
This list of similar studies can be used, for
example: (i) to define the next study to be analyzed;
(ii) to facilitate comparison between similar studies
and (iii) to make the inclusion and exclusion of
studies easier – studies with a high level of similarity
to an excluded study tend to be also excluded.
Other researches use text mining in the context
of SR or SM, but it is not available in tools that
support the whole SR or SM processes.
Malheiros et al. (2007) proposed the use of a
visualization tool, named PEx, to support the first
step of studies selection. PEx has a module that
processes the abstract of the primary studies,
eliminates stopwords, calculates the terms frequency
and, based on this result, displays clusters of studies
to facilitate their analysis.
Felizardo et al. (2011) continued the research
cited above presenting the VTM (Visual Text
Mining) tool which supports studies selection. Like
Malheiros et al. (2007), the result of text mining
processes is shown by different visualization
techniques which help applying the inclusion and
exclusion criteria previously inserted in VTM tool.
It is important to notice that the focus of these
studies is the studies selection step. On the other
hand, in Start, visualization and text mining are
currently being used to support the search string
definition and the SR or SM Summarization phase.
5 CONCLUSIONS AND FUTURE
WORK
This paper explored the use of visualization for
making easier the interpretation of data provided by
Systematic Literature Review and Systematic
Mapping. This visualization is available in StArt,
which also supports the steps of SR and SM
processes. As these processes are laborious, posses
Figure 9: Relationship among the studies uploaded into StArt and their references.
ManagingLiteratureReviewsInformationthroughVisualization
43
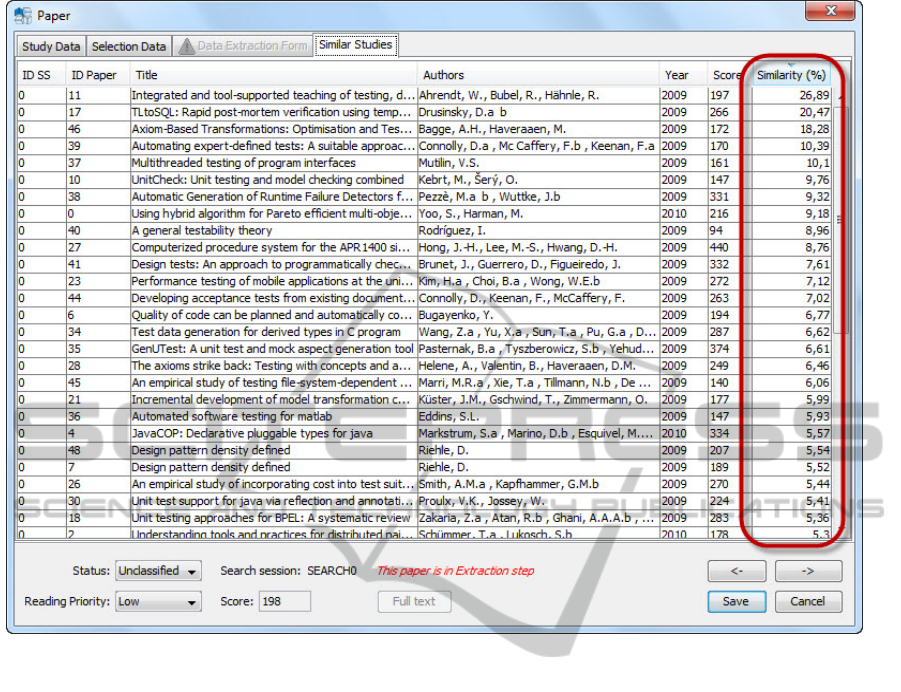
Figure 10: List of similar studies in relation to a selected study – the similarity grade is highlighted.
many repetitive steps and require that all information
is packed, the availability of computational support
is relevant.
Although there are some tools that have been
used by researches to aid the conduction of literature
reviews, most of them are reference manager. Some
examples are JabRef (jabref.sourceforge.net),
EndNote (www.endnote.com), ProCite
(www.procite.com), Reference Manager
(www.refman.com), RefWorks (www.refworks.com)
and Zotero (www.zotero.org). Only SLR tool
(Fernández-Sáez, Genero, Romero, 2010) focuses on
SR process (Kitchenham, 2007). However, it works
only on the English or Spanish versions of the
Windows operating system.
As StArt is closely associated to the SR and SM
processes, it provides many facilities that make
easier the conduction of these types of reviews.
Some characteristics that differentiate it from the
other tools are the score, which is calculated
automatically and can give insights on the paper
relevance; different types of data visualization that
can aid to map the research area; extraction of the
references of the studies gathered in the review, that
allows evaluating the adequacy of search strings and
improving the quality of the whole activity; and
other facilities that make the conduction of the
process more manageable.
Considering the importance of packing the SRs
or SMs data, StArt saves all data in a “.start” file
which allows conducting a review in sessions and
sharing a review with another researcher. In
addition, as StArt provides a simple text editor for
writing an initial summary of the state of the art, this
summary is also packed. StArt is being continuously
evolved and tested. The tool was also evaluated from
the perspective of its usefulness and ease of use,
according to the TAM model, which found that the
tool is useful to users and can be easily used by
researchers (Hernandes et al, 2010).
As future work, it is planned to continue the
development of StArt emphasizing the analysis
related to Systematic Mappings. This objective has
already initiated with the addition of visualization,
but there are other features that can enhance its
support for SM. Besides, it is planned some
experimental studies that aim to establish a strategy
to improve search strings based on the references of
ICEIS2012-14thInternationalConferenceonEnterpriseInformationSystems
44

the collected studies and also to explore the tool as a
support to conduct meta reviews.
ACKNOWLEDGEMENTS
The authors thank the students and researchers who
have been used StArt and are giving constant
feedback to development team and CNPq, CAPES
and Observatório da Educação Project for financial
support.
REFERENCES
Boell, S. K., Cezec-Kecmanovic, D. 2010. Are systematic
reviews better, less biased and of higher quality?. In
Proc. European Conference on Information Systems,
Helsinki, Finland.
Burley, D. 2010. Information visualization as a knowledge
integration tool. Journal of Knowledge Management
Practice.
Dunne, C., Shneiderman, B., Gove, R., Klavans, J. &
Dorr, B. 2012. Rapid understanding of scientific paper
collections: integrating statistics, text analytics, and
visualization. JASIST: Journal of the American Society
for Information Science and Technology.
Felizardo, K.R. et al. Using Visual Text Mining to Support
the Study Selection Activity in Systematic Literature
Reviews”. In: Int. Symposium on Empirical Software
Engineering and Measurement, ESEM, 2011, pp. 77-
86.
Fernández-Sáez, A.M., Genero, M., Romero, F.P. SLR-
Tool: A Tool for Performing Systematic Literature
Reviews. In Proc. JISBD, 2010, pp.329-332.
Gershon, N., Eick, S.G., Card, S. 1998. Information
visualization interactions, ACM Interactions, ACM
Press.
Hernandes, E. C. M.; Zamboni, A. B.; Thommazo, A. D.;
Fabbri, S. C. P. F. Avaliação da ferramenta StArt
utilizando o modelo TAM e o paradigma GQM. In: X
Experimental Software Engineering Latin American
Workshop, ICMC-São Carlos.
Kitchenham, B. A. 2004. Procedures for Performing
Systematic Reviews. Software Engineering Group,
Keele University, Keele, Tech. Rep. TR/SE 0401.
Kitchenham, B. A. 2007. Guidelines for performing
Systematic Literature Reviews in Software. Software
Engineering Group, Keele Univ., Keele, Univ.
Durham, Durham, Tech. Rep. EBSE-2007-01.
Malheiros, V., Höhn, E., Pinho, R., Mendonça, M.,
Maldonado, J.C. “A Visual Text Mining approach for
Systematic Reviews”. In: International Symposium on
Empirical Software Engineering and Measurement,
ESEM, 2007, pp. 245-254.
Montebelo, R. P. et. al. 2007. SRAT (Systematic Review
Automatic Tool) Uma Ferramenta Computacional de
Apoio à Revisão Sistemática, In V Experimental
Software Engineering Latin American Workshop.
ICMC-São Carlos.
Pai, M., McCulloch, M., Gorman, J. D., Pai, N., Enanoria,
W., Kennedy, G., Tharyan, P., Colford Jr., J. M. 2004.
Clinical Research Methods - Systematic reviews and
meta-analyses: An illustrated, step-by-step guide. The
National Medical Journal of India.
Petersen, K. et al. 2008. Systematic Mapping Studies in
Software Engineering, In: Proc. Inter. Conf. on
Evaluation and Assessment in Software Engineering,
Bari, Italy.
Salton, G. 1989. Automatic Text Processing - The
Transformation, Analysis and Retrieval of Information
by Computer. Addison-Wesley.
Salton, G., Allan, J. Text Retrieval Using the Vector
Processing Model. In Symposium on Document
Analysis and Information Retrieval. University of
Nevada, Las Vegas, 1994.
Zamboni, A. B.; Thommazo, A. D.; Hernandes, E. C. M.;
Fabbri, S. C. P. F. StArt Uma Ferramenta
Computacional de Apoio à Revisão Sistemática. In:
Brazilian Conference on Software: Theory and
Practice - Tools session. UFBA.
ManagingLiteratureReviewsInformationthroughVisualization
45
