
Labeling Methods for Association Rule Clustering
Veronica Oliveira de Carvalho
1
, Daniel Savoia Biondi
1
,
Fabiano Fernandes dos Santos
2
and Solange Oliveira Rezende
2
1
Instituto de Geociˆencias e Ciˆencias Exatas, UNESP - Univ Estadual Paulista, S˜ao Paulo, Brazil
2
Instituto de Ciˆencias Matem´aticas e de Computac¸˜ao, Universidade de S˜ao Paulo, S˜ao Paulo, Brazil
Keywords:
Association Rules, Post-processing, Clustering, Labeling Methods.
Abstract:
Although association mining has been highlighted in the last years, the huge number of rules that are gen-
erated hamper its use. To overcome this problem, many post-processing approaches were suggested, such
as clustering, which organizes the rules in groups that contain, somehow, similar knowledge. Nevertheless,
clustering can aid the user only if good descriptors be associated with each group. This is a relevant issue,
since the labels will provide to the user a view of the topics to be explored, helping to guide its search. This
is interesting, for example, when the user doesn’t have, a priori, an idea where to start. Thus, the analysis of
different labeling methods for association rule clustering is important. Considering the exposed arguments,
this paper analyzes some labeling methods through two measures that are proposed. One of them, Precision,
measures how much the methods can find labels that represent as accurately as possible the rules contained in
its group and Repetition Frequency determines how the labels are distributed along the clusters. As a result,
it was possible to identify the methods and the domain organizations with the best performances that can be
applied in clusters of association rules.
1 INTRODUCTION
Association rules are widely used in many distinct
domain problems due to their ability to discover the
frequent relationships that occur among sets of items
stored in databases. Although this characteristic mo-
tivates its use, the main weakness of the association
technique occurs when it is necessary to analyze the
mining results. The huge number of rules that are gen-
erated makes the user’s exploration a difficult task.
Many approaches have been developed to overcome
this post-processingproblem, such as Querying, Eval-
uation Measures, Pruning, Summarizing and Group-
ing (Zhao et al., 2009; Natarajan and Shekar, 2005;
Jorge, 2004). There are other ways to reduce the num-
ber of rules before post-processing be done, using, for
example, extraction algorithms that are not exhaustive
as Apriori (Agrawal and Srikant, 1994). However, the
focus of this work is the post-processing phase. Thus,
it is considered, in this work, that it is better not to
eliminate rules (knowledge)during the extraction pro-
cess, but to work with all of them later.
Grouping is a relevant approach related to the
structure of the domain, since it organizes the asso-
ciation rules, previously obtained by algorithms like
Apriori (Agrawal and Srikant, 1994), in groups that
contain, somehow, similar knowledge. These groups
can improve the presentation of the mined patterns,
providing the user a view of the domain to be explored
(Reynolds et al., 2006; Sahar, 2002). The papers that
use clustering for post-processing association rules,
as seen in (Reynolds et al., 2006; Jorge, 2004; Sa-
har, 2002; Toivonen et al., 1995), are only concerned
with the domain organization. However, it is essential
that the organizations be used to aid the user during
the exploration process, minimizing its effort. Aid-
ing can be obtained from a structured domain by: (i)
highlighting the groups (clusters
1
) that are interest-
ing to be explored; (ii) generating good labels for the
groups that allow an easier browsing in the domain.
Regarding (i), (Carvalho et al., 2011), for exam-
ple, proposed the PAR-COM methodology that, by
combining clustering and objective measures, reduces
the association rule exploration space by directing the
user to what is potentially interesting. Thus, the user
only explores a small subset of the groups that con-
tain the potentially interesting knowledge. Regard-
ing (ii), it is essential that groups be represented by
1
The words groups and clusters are used in this paper as
synonymous.
105
Oliveira de Carvalho V., Savoia Biondi D., Fernandes dos Santos F. and Oliveira Rezende S..
Labeling Methods for Association Rule Clustering.
DOI: 10.5220/0003970001050111
In Proceedings of the 14th International Conference on Enterprise Information Systems (ICEIS-2012), pages 105-111
ISBN: 978-989-8565-10-5
Copyright
c
2012 SCITEPRESS (Science and Technology Publications, Lda.)

labels that can provide the user a view of the topics
contained in the exploration space, helping to guide
its search. Finding good labels is a relevant issue in
many tasks as in Text Mining (TM) and Information
Retrieval (IR) (see some applications in (Manning
et al., 2009)). It is necessary, for example, that good
descriptors be presented to the user to facilitate ex-
ploratory analyses, interesting when the user doesn’t
have, a priori, an idea where to start. Furthermore,
although many methods have been proposed to label
document clusters in TM and IR, the papers related to
association rule clustering have not explored this is-
sue. Thus, as in other tasks, the analysis of different
labeling methods for association rule clustering is also
relevant, since it is necessary to identify the methods
that present good results. Besides, the integration of
good labeling methods with other methodologies can
allow association rule clustering to become a power-
ful post-processing tool. The integration with PAR-
COM (Carvalho et al., 2011), for example, can enable
the identification of the potentially interesting topics
in the domain.
Considering the exposed arguments, this paper
aims to analyze some labeling methods in order to
identify: (a) the methods that are more adequate for
association rule clustering; (b) the domain organiza-
tions that provide the best results, since the perfor-
mance of the methods are affected by them, i.e., by a
clustering algorithm combined with a similarity mea-
sure; (c) a consequence of (b), the domain organiza-
tions that best structure the knowledge. Two measures
are proposed and used to evaluate the methods. The
ideal is that the labels of each cluster represent as ac-
curately as possible the knowledge of its group (Pre-
cision (P) measure) and be as different as possible of
the labels of the other groups (Repetition Frequency
(RF) measure). It is important to mention that this
paper doesn’t fit in the post-processing approaches it-
self. The labeling methods here presented have to be
applied to clustering of association rules, i.e., along
with a post-processing methodology.
The paper is structured as follows: Section 2
presents some related works; Section 3 and Sec-
tion 4 the labeling methods that were selected and
the measures that were proposed to evaluate the ex-
periments results, respectively; Section 5 the config-
urations used in experiments; Section 6 the results
and discussion; Section 7 the conclusions and future
works.
2 RELATED WORKS
Since this paper aims to analyze some labeling meth-
ods for association rule clustering, this section
presents some papers related to the clustering ap-
proach and the labeling methods they use.
In order to structure the extracted knowledge,
different clustering strategies have been used for
post-processing association rules. In (Reynolds
et al., 2006) clustering is demonstrated through
partitional (K-means, PAM, CLARANS) and hi-
erarchical (AGNES) algorithms using Jaccard as
the similarity measure. In this case, the Jac-
card between two rules r and s, expressed by
J-RT(r,s)=
#{t matched by r}∩ #{t matched by s}
#{t matched by r}∪ #{t matched by s}
, is calcu-
lated considering the common transactions (t) the
rules match – we refer to this similarity measure as
Jaccard with Rules by Transactions (J-RT). A rule
matches a transaction t if all the rule items are con-
tained in t. (Jorge, 2004) demonstrates the use
of clustering through hierarchical algorithms (Sin-
gle Linkage, Complete Linkage, Average Linkage)
also using Jaccard as the similarity measure. How-
ever, the Jaccard between two rules r and s, ex-
pressed by J-RI(r,s)=
#{items in r}∩ #{items in s}
#{items in r}∪ #{items in s}
, is calcu-
lated considering the items the rules share – we refer
to this measure as Jaccard with Rules by Items (J-RI).
(Toivonen et al., 1995) proposes a similarity measure
based on transactions and uses a density algorithm to
carry out the clustering of the rules. (Sahar, 2002)
also proposes a similarity measure based on transac-
tions considering (Toivonen et al., 1995)’s work, al-
though using a hierarchical algorithm to carry out the
clustering.
All the above papers, related to the structure of
the domain, are only concerned with the domain or-
ganization. In general, each paper only uses one fam-
ily of clustering algorithms along with one similarity
measure to cluster the association rules and a unique
labeling method to present the mined results to the
user. (Reynolds et al., 2006) and (Jorge, 2004) se-
lect as labels of each group the items that appear in
the rule which is more similar to all the other rules
in the group (the medoid of the group). (Toivonen
et al., 1995) doesn’t mention how the labels are found,
but provides some traces that the labels represent the
more frequent and distinct items in the group. On
the other hand, (Sahar, 2002) proposes an approach to
summarize each cluster by finding the patterns a ⇒ c
that cover all the rules in the cluster; a and c are items
in the domain and a pattern a ⇒ c covers a rule A ⇒ C
if a ∈ A and c ∈ C. As observed, although the pro-
posed approach is used to summarize the clusters and
not, in fact, to define the cluster’s labels, the idea can
be used for this purpose.
Although many methods have been proposed to
label document clusters in tasks of Text Mining (TM)
ICEIS2012-14thInternationalConferenceonEnterpriseInformationSystems
106

and Information Retrieval (IR), as in (Moura and
Rezende, 2010; Lopes et al., 2007; Kashyap et al.,
2005; Fung et al., 2003; Glover et al., 2002; Popes-
cul and Ungar, 2000; Larsen and Aone, 1999; Cut-
ting et al., 1992), the papers related to association rule
clustering have not explored this issue. However, as
presented in next section, many of these methods used
to label document clusters are similar to the ones used
to label association rule clusters, i.e, they are, some-
how, related. Thus, some methods, apart from the
ones presented in the next section, could be adapted
from TM and IR for association rule clustering.
3 LABELING METHODS
Aiming to analyze some labeling methods (LM) for
association rule clustering regarding their behavior
in relation to precision and distinctiveness, four
methods were selected and implemented. These
methods represent the ideas of many of the methods
previously described and cited in Section 2 (both for
association rules (AR) as for documents (TM and
IR)). In order to understand the methods, consider a
clustering composed of three clusters of association
rules: C
1
={r
1
: coffee ⇒ butter; r
2
: milk ⇒ coffee;
r
3
: milk & butter ⇒ coffee}; C
2
={r
1
: butter ⇒
coffee; r
2
: milk ⇒ butter}; C
3
={r
1
: butter ⇒
milk; r
2
: coffee ⇒ milk}. The example is merely
illustrative. The four methods described below are
LM-M, LM-T, LM-S and LM-PU.
In LM-M (Labeling Method Medoid) the labels
of each cluster are built by the items that appear in
the rule of the group which is more similar to all the
other rules in the cluster (the medoid of the group).
So, is computed the accumulated similarity (a
s) of
each rule considering its similarity with respect to
the other rules and the one with the highest value is
selected. Considering C
1
of the above example and
that r
1
covers {t
1
, t
3
, t
5
, t
7
}, r
2
{t
1
, t
3
, t
5
, t
7
, t
9
}, r
3
{t
3
, t
5
, t
7
}, the similarities s(r
1
,r
2
)=s(r
2
,r
1
)=
4
5
= 0.8,
s(r
1
,r
3
)=s(r
3
,r
1
)=
3
4
= 0.75, s(r
2
,r
3
)=s(r
3
,r
2
)=
3
5
= 0.6,
consideringJ-RT (Section 2), are obtained and the fol-
lowing a
s are found: a s(r
1
)=s(r
1
,r
2
)+s(r
1
,r
3
)=1.55;
a s(r
2
)=s(r
2
,r
1
)+s(r
2
,r
3
)=1.40;
a
s(r
3
)=s(r
3
,r
1
)+s(r
3
,r
2
)=1.35. Thus, r
1
is se-
lected and C
1
’s labels are defined to be {coffee,
butter}. These similarities among rules can be
obtained through any similarity measure, as the ones
presented in Section 2. In this paper we used J-RT as
in the most of the literature works. The papers related
with this idea are (Reynolds et al., 2006; Jorge,
2004) from AR and (Kashyap et al., 2005; Larsen
and Aone, 1999; Cutting et al., 1992) from TM and
IR. In this case, the user can also know the existing
relationship among the labels through the rule.
In LM-T (Labeling Method Transaction) the
labels of each cluster are built by the items that
appear in the rule of the group that covers the largest
number of transactions. A rule covers a transaction t
if all the rule items are contained in t. Considering
C
1
of the above example and that r
1
covers {t
1
, t
3
, t
5
,
t
7
}, r
2
{t
3
, t
5
, t
7
}, r
3
{t
1
, t
3
, t
5
, t
7
, t
9
}, r
3
is selected
and C
1
labels are defined to be {milk, butter, coffee}.
The paper related to this idea is (Fung et al., 2003)
from TM and IR. In this case, the user can also know
the existing relationship among the labels through the
rule.
In LM-S (Labeling Method Sahar due to its
reference to (Sahar, 2002)), a simplified version
of the process described in (Sahar, 2002) from
AR and explained in Section 2, the labels of each
cluster are built as follows: (i) considering a set
I = {i
1
, ..., i
m
} containing all the distinct cluster
items, a set R = {r
1
, ..., r
n
} containing all the possible
relationships a ⇒ c, where a, c ∈ I – each one of
these relationships represents a rule pattern; (ii) the
number of rules that each pattern r
i
∈ R covers is
computed (N
c
); a pattern a ⇒ c covers a rule A ⇒ C
if a ∈ A and c ∈ C; (iii) the pattern with the highest
cover is selected; in the event of a tie all tied pattern
are selected; (iv) all the selected patterns compose
a set P ⊆ R; (v) at the end, all the distinct items
in P compose the labels. Considering C
1
of the
above example we have: I={coffee, butter, milk},
R={r
1
: cof fee ⇒ butter, r
2
: butter ⇒ co f fee,
r
3
: cof fee ⇒ milk, r
4
: milk ⇒ co f fee,
r
5
: butter ⇒ milk, r
6
: milk ⇒ butter}, N
c
={r
1
: 1,
r
2
: 1, r
3
: 0, r
4
: 2, r
5
: 0, r
6
: 0} and P={r
4
}. Thus,
C
1
’s labels are defined to be {milk, coffee}. In this
case, the user can also know the existing relationship
among the labels through the rule(s).
In LM-PU (Labeling Method Popescul and Ungar
due to its reference to (Popescul and Ungar, 2000))
the labels of each cluster are built by the N items
in the cluster that present the best tradeoff between
frequency and predictiveness; formally we have:
f(i
n
|C
n
) ∗
f(i
n
|C
n
)
f(i
n
)
. The f(i
n
|C
n
) measure computes
the frequency f of each item i
n
in its cluster C
n
. The
f(i
n
|C
n
)
f(i
n
)
measure computes the frequency f of each
item i
n
in its cluster C
n
divided by the item frequency
in all the clusters. The i
n
items are all the distinct
items that are present in the rules of the cluster.
Each time an item i
n
occurs in a rule its frequency is
incremented by one. Therefore, the labels are built by
the N items that are more frequent in their own cluster
and infrequent in the other clusters. Considering
C
1
of the above example, its distinct items {coffee,
LabelingMethodsforAssociationRuleClustering
107
butter, milk} and N = 1 we have: coffee=3∗
3
5
=1.8;
butter=2∗
2
5
=0.8; milk=2∗
2
5
=0.8. Thus, C
1
’s labels
are defined to be {coffee}. The papers related to this
idea are (Toivonen et al., 1995) from AR and (Lopes
et al., 2007; Glover et al., 2002; Popescul and Ungar,
2000) from TM and IR. In this case, the user doesn’t
know the existing relationship among the labels.
4 EVALUATION
METHODOLOGY
In order to evaluate the precision and distinctiveness
of the four labeling methods, two measures, presented
in Equations 1 and 2, were proposed, where N refers
to the number of clusters. Both measures range from
0 to 1. To understand the measures, consider a clus-
tering composed of three clusters of association rules:
C
1
={coffee ⇒ butter; milk ⇒ butter} with the labels
{butter, coffee, milk}; C
2
={butter ⇒ coffee; milk ⇒
coffee} with the label {milk}; C
3
={butter ⇒ milk;
coffee ⇒ milk} with the labels {butter, milk}. The
example is merely illustrative.
Precision (P), in Equation 1, measures how much
the labeling method can generate labels that really
represent the rules contained in the clusters. This
measure is an adaptation of Recall used in Informa-
tion Retrieval (see (Manning et al., 2009)); however,
in this case, the relevant items to be retrieved are all
the rules in a cluster. Considering the above exam-
ple, the illustrative method has a P of 0.83 (P(C) =
2
2
+
1
2
+
2
2
3
), since the labels ofC
2
represent only one rule
of a total of two. It is considered that a rule is repre-
sented (covered) by a set of labels if the rule contains
at least one of the labels. Thus, it is expected that a
good method must have a high precision. However,
it is not enough to be precise if the labels appear re-
peatedly among the clusters. Therefore, Repetition
Frequency (RF), in Equation 2, measures how much
the distinct labels that are present in all the clusters
don’t repeat. Considering the above example, the il-
lustrative method has a RF of 0.33 (RF(C) = 1 −
2
3
):
one of the three distinct labels (butter, coffee, milk)
that are present in clusters doesn’t repeat. The higher
the RF value, the better the method, i.e., less repeti-
tions implies in better performance. Observe that RF
can be used to compute the repetition frequency if we
omit “1-” of Equation 2; however, in this case, the
lower the RF value, the better the method. Thereby,
the choice of not computing the repetition was to stan-
dardize the interpretation of the measures.
P(C) =
∑
N
i=1
P(C
i
)
N
, where (1)
P(C
i
) =
#{rules covered in C
i
by C
i
labels}
#{rules in C
i
}
RF(C) = 1−
#{distinct labels that repeat in the clusters}
#{distinct labels in the clusters}
(2)
Considering the labeling methods and the above
measures, some experiments were realized, which are
next described.
5 EXPERIMENTS
Some experiments were carried out to evaluate the
labeling methods regarding precision and distinctive-
ness through P and RF. The four data sets used in
experiments are presented in Table 1. The first three
are available in R Project for Statistical Computing
through “arules” package
2
. The last one was do-
nated by a supermarket located in S˜ao Carlos city,
Brazil
3
. All the transactions of the Adult and In-
come contain the same number of items (referred here
as standardized-transaction data sets), different from
Groceries and Sup (referred here as non-standardized-
transaction data sets). Thus, the labeling methods
were evaluated on different types of data. The rules
were mined using an Apriori implementation devel-
oped by Christian Borgelt
4
with a maximum number
of 5 items per rule and excluding the rules of type
/
0 ⇒ X, where X is an item contained in data. With the
Adult set 6508 rules were generated using a minimum
support (min-sup) of 10% and a minimum confidence
(min-conf) of 50%; with Income 3714 rules consider-
ing a min-sup of 17% and a min-conf of 50%; with
Groceries 2050 rules considering a min-sup of 0.5%
and a min-conf of 0.5%; with Sup 7588 rules con-
sidering a min-sup of 0.7% and a min-conf of 0.5%.
These parameter values were chosen experimentally
considering the exposed arguments in Section 1 and
(Carvalho et al., 2011)’s work.
Table 1: Details of the data sets used in experiments.
Data set # of transactions # of distinct items
Adult 48842 115
Income 6876 50
Groceries 9835 169
Sup 1716 1939
Since the papers described in Section 2 only use
one family of clustering algorithms and one similar-
2
http://cran.r-project.org/web/packages/arules/index.html.
3
http://sites.labic.icmc.usp.br/research/Cjto-Sup.data.
4
http://www.borgelt.net/apriori.html.
ICEIS2012-14thInternationalConferenceonEnterpriseInformationSystems
108
ity measure to cluster the association rules, it was de-
cided to use one algorithm of each family and the two
most used similarity measures (J-RI and J-RT (Sec-
tion 2)). The Partitioning Around Medoids (PAM)
was chosen within the partitional family and the Av-
erage Linkage within the hierarchical family. PAM
was executed with k ranging from 5 to 50 considering
a step of 5. The dendrograms generated by Average
Linkage were cut in the same ranges (5 to 50 con-
sidering a step of 5). All the choices were made con-
sidering an analysis of many clustering configurations
presented in (Carvalho et al., 2012). Table 2 summa-
rizes the configurations used in the experiments.
Table 2: Configurations used in the experiments.
Data Adult; Income; Groceries; Sup
sets
Algorithms PAM; Average Linkage
Similarity J-RI; J-RT
measures
k 5 to 50, step of 5
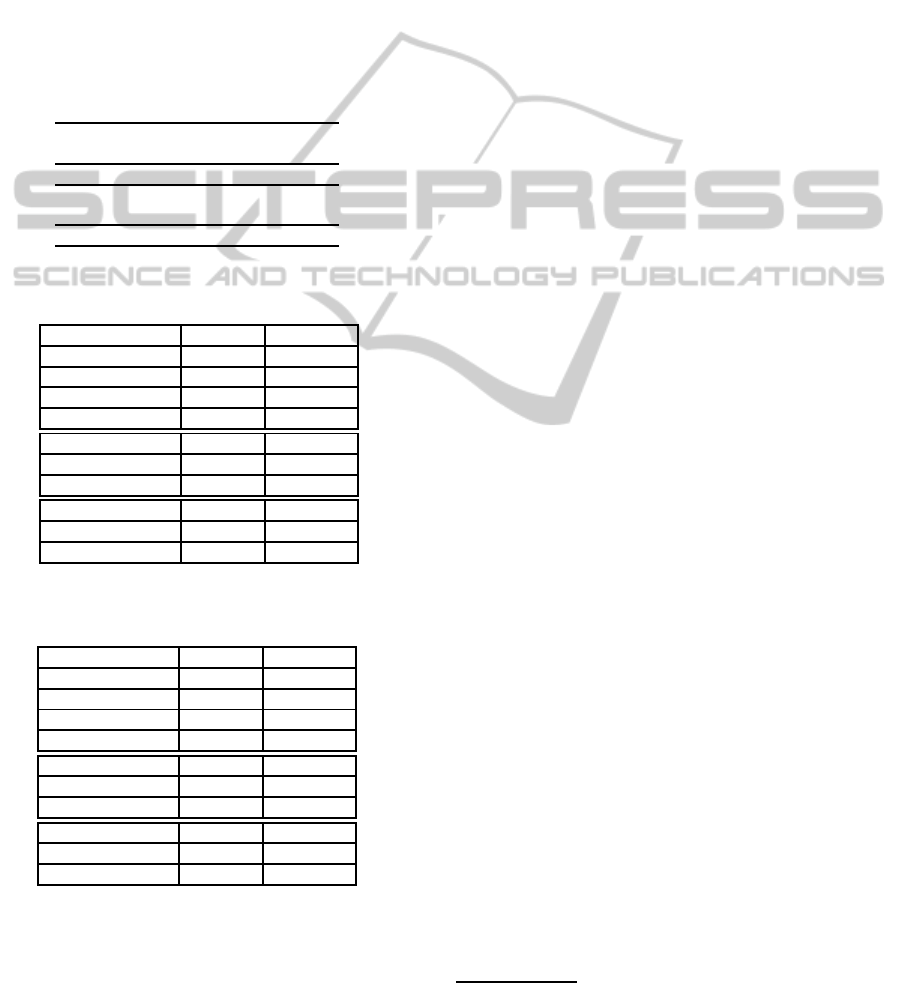
Table 3: Results for P and RF considering the ADULT and
INCOME data sets.
Labeling method Mean of P Mean of RF
LM-M 0.995310 0.321458
LM-T 0.923752 0.340560
LM-S 0.965381 0.416278*
LM-PU 0.997238* 0.305087
Clustering algorithm Mean of P Mean of RF
PAM 0.969465 0.285709
Average 0.971375* 0.405983*
Similarity measure Mean of P Mean of RF
J-RI 0.970287 0.269874
J-RT 0.970553* 0.421818*
Table 4: Results for P and RF considering the GROCERIES
and SUP data sets.
Labeling method Mean of P Mean of RF
LM-M 0.924978 0.700539*
LM-T 0.771151 0.696544
LM-S 0.899201 0.641688
LM-PU 0.971076* 0.662681
Clustering algorithm Mean of P Mean of RF
PAM 0.873818 0.564347
Average 0.909385* 0.786379*
Similarity measure Mean of P Mean of RF
J-RI 0.930973* 0.616215
J-RT 0.852230 0.734511*
Considering the configurations in Table 2, the four
labeling methods (LM-M; LM-T; LM-S; LM-PU)
were applied in the different domain organizations. In
relation to the labeling methods, LM-M and LM-T se-
lect only one rule as label, LM-S one or more rules,
in case of tie, and LM-PU the 5 items that present
the best tradeoff between frequency and predictive-
ness. Thus, in average, all the labeling methods gen-
erate the same amount of labels per cluster. In the end,
the performance of each labeling method was evalu-
ated through RF and P, whose results are presented in
the next section. It is important to remember that the
aim of the measures is to evaluate, respectively, how
much the method can find labels that represent as ac-
curately as possible the knowledge contained in their
own groups and how the labels are distributed along
the clusters. The ideal is to identify methods that have
high values for both measures.
6 RESULTS AND DISCUSSION
As mentioned before, the performance of the labeling
methods were evaluated through P and RF. Thus, in
order to identify the methods that are more adequate
for association rule clustering and the domain organi-
zations that provide the best results, an analysis based
on the mean of each measure was done. Tables 3
and 4 present the results – the best values are marked
with “*”. Each mean was obtained considering all the
results of the experiments
5
, which were grouped ac-
cording to the criteria shown (labeling method, clus-
tering algorithm, similarity measure) and according
to the different types of data (standardized-transaction
(Table 3) and non-standardized-transaction(Table 4)).
It is important to mention that since the results are de-
terministic no statistical test was done. It can be ob-
served that:
• in the standardized-transaction data sets (Table 3)
the method that presents the best result regarding
P is LM-PU and considering RF LM-S. Thereby,
the user can choose one of them based on his
interests: accurate or distinctiveness. However,
it is possible to note that in all the methods RF
presents low values while P presents high val-
ues. Thus, it is better to use LM-S when the user
wants a tradeoff between P and RF, since it im-
proves RF (difference above 0.1) while maintain-
ing a good P (difference of 0.03).
• in the non-standardized-transaction data sets (Ta-
ble 4) the method that presents the best result re-
garding P is LM-PU and considering RF LM-M.
Thereby, the user can choose one of them based
on his interests: accurate or distinctiveness. On
the other hand, it is possible to note that both
methods have similar values (difference of 0.05
5
All the results of the experiments are available in
http://veronica1.rc.unesp.br/public/ICEIS-2012-R.pdf.
LabelingMethodsforAssociationRuleClustering
109
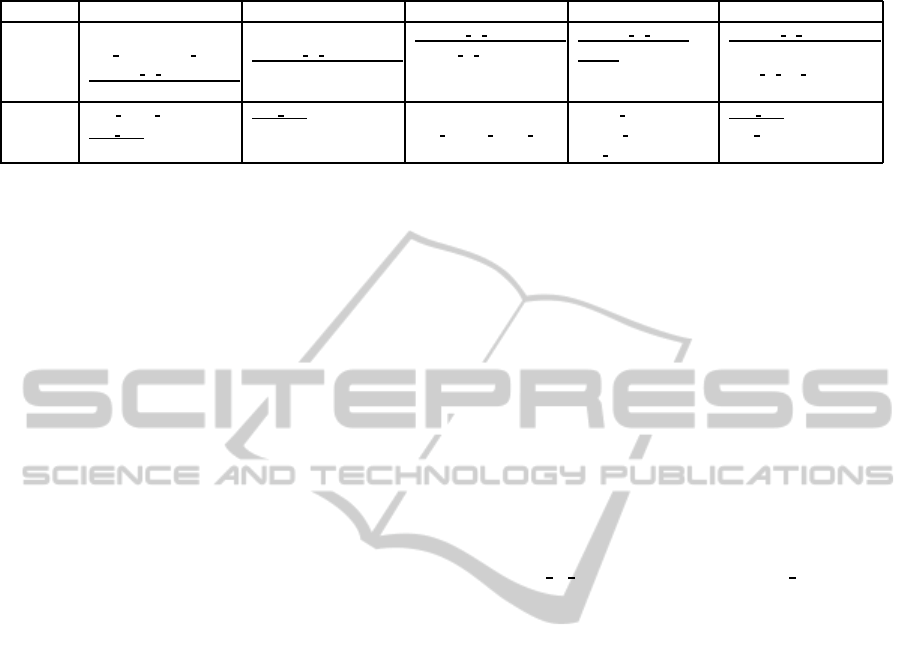
Table 5: Examples of labels obtained in some of the experiments using Average+J-RT and k = 5.
Experiment Cluster 1 Cluster 2 Cluster 3 Cluster 4 Cluster 5
Income+ age=14-34 age=35+ language in home=english language in home= language in home=english
LM-S dual incomes=not married language in home=english number in household=1 english sex=female
language in home=english occupation= years in bay area=10+
professional/managerial
SUP+ agua tonica antartica coca cola deterglimpol fartrigo renata coca cola
LM-M coca cola gatorade oleo girassol salada bunge gelatina royal leite salute
leite moca
in P and of 0.04 in RF). Thus, both of them could
be used when the user wants a tradeoff between P
and RF. However, it seems more adequate to use
LM-M in spite of LM-PU since LM-M (i) can be
more easily computed with partitional algorithms,
(ii) can allow the user to know the existing rela-
tionship among the labels and (iii) presents a bet-
ter value for RF (above 0.7) while maintaining a
good P (above 0.9). Finally, it is possible to note
that these types of data sets present better RF val-
ues in relation to the RF values in Table 3.
• the algorithm that presents the best performance
in all the tests is Average (Tables 3 and 4).
• the similarity measure that presents the best per-
formance in almost all the tests is J-RT (Tables 3
and 4). The only exception is P in Table 4, where
J-RI presents a better performance.
Considering the exposed arguments, it can be
observed that: (i) for standardized-transaction data
sets the method that seems to be more adequate
for association rule clustering is LM-S; (ii) for non-
standardized-transaction data sets the method that
seems to be more adequate for association rule clus-
tering is LM-M; (iii) the methods present better re-
sults when the clustering is obtained through Average;
(iv) J-RT seems to be a good similarity measure to
be used along with Average; (v) as a consequence of
(iii), it is possible to verify that Average represents the
domain organization which best separates the domain
knowledge, independently of the similarity measure
used – it can be inferred that a domain is well sep-
arated if a domain organization, along with an ade-
quate labeling method, provides good labels. These
conclusions cover the three objectives stated in Sec-
tion 1 (letters (a) to (c)). Besides, these results can
be used with other methodologies, as the methodol-
ogy described in (Carvalho et al., 2011), to make the
association rule clustering a powerful post-processing
tool.
Finally, Table 5 presents examples of la-
bels obtained in some of the experiments using
Average+J-RT and k = 5. One data set of each type
of data (standardized or non-standardized) is shown
along with its labeling method, according to the re-
sults above discussed, that had the best performance.
The items that occur more than once are underlined.
It can be observed that: (i) the labels of Income de-
scribe, with good precision and distinctiveness (P =
0.835; RF = 0.875), some specificities well defined
of the domain – cluster 2, for example, is related to
people above 35 years and cluster 5 to people who
are female and live for more than 10 years in the San
Francisco Bay area; (ii) on the other hand; the labels
of SUP describe, also with good precision and dis-
tinctiveness (P = 0.788; RF = 0.889), some types of
beverages that can be purchased, as clusters 1, 2 and
5, which are related with distinct shop styles: clus-
ter 1 with water, cluster 2 with soft drink and clus-
ter 5 with milk; (iii) the items that occur in many
clusters labels are very frequent in their data sets
(language
in home=english: 91%; coca cola: 22%),
which means that they can be used as complemen-
tary information of the clusters. Thus, as observed, it
is essential that good labels be found, since they can
aid the users in exploratory analyses by guiding their
search.
7 CONCLUSIONS
Due to the huge amount of association rules that are
obtained, considering the exposed arguments in Sec-
tion 1, many approaches were suggested, as cluster-
ing. However, for clustering to be useful to users it is
essential that good descriptors be associated with each
cluster to help, for example, in guiding their search.
Thus, the analysis of different labeling methods for
association rule clustering is a relevant issue. Con-
sidering the exposed arguments, this paper analyzed
some labeling methods. Two measures were proposed
and used to evaluate the methods. Precision, P, mea-
sures how much the methods can find labels that rep-
resent as accurately as possible the rules contained in
their own groups. Repetition Frequency, RF, mea-
sures how the labels are distributed along the clusters.
As a result, it was possible to identify the methods and
the domain organizations with the best performances
that can be applied in clusters of association rules.
ICEIS2012-14thInternationalConferenceonEnterpriseInformationSystems
110

As future work we will explore some approaches
that aim to improve the labels through a general-
ization process. We want to explore the impact of
generic labels on P and RF to analyze if the results
of the labeling methods can be improved. From this
generalization process we intend to discover a topic
for each cluster considering the context given by the
user through ontology. Given, for example, the labels
“rice”, “bean” and “salad”, the topic could be food
or lunch, depending on the knowledge codified in the
ontology.
ACKNOWLEDGEMENTS
We wish to thank Fundac¸˜ao de Amparo `a Pesquisa do
Estado de S˜ao Paulo (FAPESP) (processes numbers:
2010/07879-0 and 2011/19850-9) and Fundac¸˜ao para
o Desenvolvimento da Unesp (FUNDUNESP) for the
financial support.
REFERENCES
Agrawal, R. and Srikant, R. (1994). Fast algorithms for
mining association rules. In Bocca, J. B., Jarke, M.,
and Zaniolo, C., editors, Proceedings of the 20th Inter-
national Conference on Very Large Data Bases, VLDB
1994, pages 487–499.
Carvalho, V. O., Santos, F. F., and Rezende, S. O. (2011).
Post-processing association rules with clustering and
objective measures. In Proceedings of the 13th Inter-
national Conference on Enterprise Information Sys-
tems, volume 1, pages 54–63.
Carvalho, V. O., Santos, F. F., Rezende, S. O., and Padua,
R. (2012). PAR-COM: A new methodology for post-
processing association rules. Lecture Notes in Busi-
ness Information Processing, 102. In press. Available
due May 19.
Cutting, D. R., Karger, D. R., Pedersen, J. O., and Tukey,
J. W. (1992). Scatter/gather: a cluster-based approach
to browsing large document collections. In Proceed-
ings of the 15th Annual International ACM SIGIR
Conference on Research and Development in Infor-
mation Retrieval, pages 318–329.
Fung, B. C. M., Wang, K., and Ester, M. (2003). Hier-
archical document clustering using frequent itemsets.
In Proceedings of the 3rd SIAM International Confer-
ence on Data Mining, pages 59–70.
Glover, E. J., Pennock, D. M., Lawrence, S., and Krovetz,
R. (2002). Inferring hierarchical descriptions. In
Proceedings of the 11th International Conference on
Information and Knowledge Management, pages 507–
514.
Jorge, A. (2004). Hierarchical clustering for thematic
browsing and summarization of large sets of associ-
ation rules. In Proceedings of the 4th SIAM Interna-
tional Conference on Data Mining. 10p.
Kashyap, V., Ramakrishnan, C., Thomas, C., and Sheth, A.
(2005). Taxaminer: An experimentation framework
for automated taxonomy bootstrapping. International
Journal of Web and Grid Services, 1(2):240–266.
Larsen, B. and Aone, C. (1999). Fast and effective text
mining using linear-time document clustering. In Pro-
ceedings of the 5th ACM SIGKDD International Con-
ference on Knowledge Discovery and Data Mining,
pages 16–22.
Lopes, A. A., Pinho, R., Paulovich, F. V., and Minghim,
R. (2007). Visual text mining using association rules.
Computers & Graphics, 31(3):316–326.
Manning, C. D., Raghavan, P., and Sch¨utze, H. (2009).
An Introduction to Information Retrieval. Cambridge
University Press. 544p.
Moura, M. F. and Rezende, S. O. (2010). A simple method
for labeling hierarchical document clusters. In Pro-
ceedings of the 10th IASTED International Confer-
ence on Artificial Intelligence and Applications, pages
336–371.
Natarajan, R. and Shekar, B. (2005). Interestingness of as-
sociation rules in data mining: Issues relevant to e-
commerce. S
¯
ADHAN
¯
A – Academy Proceedings in En-
gineering Sciences (The Indian Academy of Sciences),
30(Parts 2&3):291–310.
Popescul, A. and Ungar, L. (2000). Automatic label-
ing of document clusters. Unpublished manuscript.
http://www.cis.upenn.edu/∼popescul/Publications/po
pescul00labeling.pdf.
Reynolds, A. P., Richards, G., de la Iglesia, B., and
Rayward-Smith, V. J. (2006). Clustering rules: A
comparison of partitioning and hierarchical clustering
algorithms. Journal of Mathematical Modelling and
Algorithms, 5(4):475–504.
Sahar, S. (2002). Exploring interestingness through cluster-
ing: A framework. In Proceedings of the IEEE Inter-
national Conference on Data Mining, pages 677–680.
Toivonen, H., Klemettinen, M., Ronkainen, P., H¨at¨onen,
K., and Mannila, H. (1995). Pruning and grouping
discovered association rules. In Workshop Notes of
the ECML Workshop on Statistics, Machine Learning,
and Knowledge Discovery in Databases, pages 47–52.
Zhao, Y., Zhang, C., and Cao, L. (2009). Post-mining of
association rules: Techniques for effective knowledge
extraction. Information Science Reference. 372p.
LabelingMethodsforAssociationRuleClustering
111
