
ELECTRIC VEHICLE ROUTE RECOMMENDER SYSTEM
João C. Ferreira
1
, Vitor Monteiro
2
and João L. Afonso
1
1
Centro Algoritmi, Univ. of Minho, Guimarães, Portugal
2
ADEETC, ISEL, Lisboa, Portugal
Keywords: Electric Vehicle, Recomender System, Range Prediction, Driver Profile.
Abstract: This paper presents a recommender system responsible for processing information that will help the driver
in the daily use of his Electric Vehicle (EV), minimizing the problem of range anxiety through a
personalized range prediction and by presenting in real time relevant information about the charging stations
that can be reached within the range autonomy. Given the success of recommendation systems on automatic
delivery of relevant information in numerous areas of usage, this type of systems can also be applied in the
electric mobility scenario, with the objective of maximizing the relevance of the information presented to
the driver, which should be the strictly needed data for the driver to make important decisions, filtering out
the unnecessary information.
1 INTRODUCTION
Aiming the electric mobility in Smart Grids (SG),
mainly electric vehicles and the driver habits, in this
paper is proposed a recommendation system that
aims to present to the users the recommended
charging point according to their preferences, with
their usual choices and according to the data
collected from public transportation, traffic
information and charging places. The
recommendation system is also used to present to
the user sites and services near of the charging point
or typical services associated with mobility in large
urban areas. The system communicates with the
vehicle system to obtain information of the battery
status and the range prediction estimation (Ferreira,
2011). The integration of information
recommendation systems with information of the
Smart Grids energy systems in conjunction with the
interface with the EV allows deliver alerts to the
driver during the normal vehicle use. Control the
vehicle's range and indicating the nearest point of
charging through geographical positioning
information, use the user profile to indicate the
direction of the planned route, loading preferences
between fast or slow charge, identifying the
proximity to public transportation scheme, are the
main objectives of the proposed recommendation
system. The system provides to the driver several
points of interest (e.g. loading points, interface with
public transport, parking lots with charging or tourist
areas of interest), based on a recommendation
system, based on the profile and the preferences of
the driver. The system will target a mobile device
that may be a Personal Data Assistant (PDA) or a
device integrated into the EV, taking into account
the specifics of these devices which have advantages
such as mobility and integration with geographic
positioning systems and disadvantages such as
limitation of processing capacity and size of the
graphic interface.
2 RECOMENDER ENGINE AND
SYSTEM
Given the success of recommendation systems in
automatically delivering the relevant information in
numerous areas of usage, it can be applied in this
scenario as well, with the objective of maximizing
the relevance of the information presented to the
driver, which should be the strictly needed for
him/her to make decisions, filtering out the
unnecessary one.
Based on the available information (charging
points, traffic and public transportation information,
and EV range autonomy), the recommendation
system will choose (recommend) the ‘right’
information, based on user pre-defined preferences
expressed in their profile. This system uses n
49
C. Ferreira J., Monteiro V. and Afonso J..
ELECTRIC VEHICLE ROUTE RECOMMENDER SYSTEM.
DOI: 10.5220/0003954400490058
In Proceedings of the 1st International Conference on Smart Grids and Green IT Systems (SMARTGREENS-2012), pages 49-58
ISBN: 978-989-8565-09-9
Copyright
c
2012 SCITEPRESS (Science and Technology Publications, Lda.)
dimensions to calculate utility function (information
relevance measurement) for all input information:
user D
1
, information D
2
and context D
3
. A diversity
of recommendations is displayed. So, a
recommended function has a new dimension d
(means context), and is a three dimensional vector u
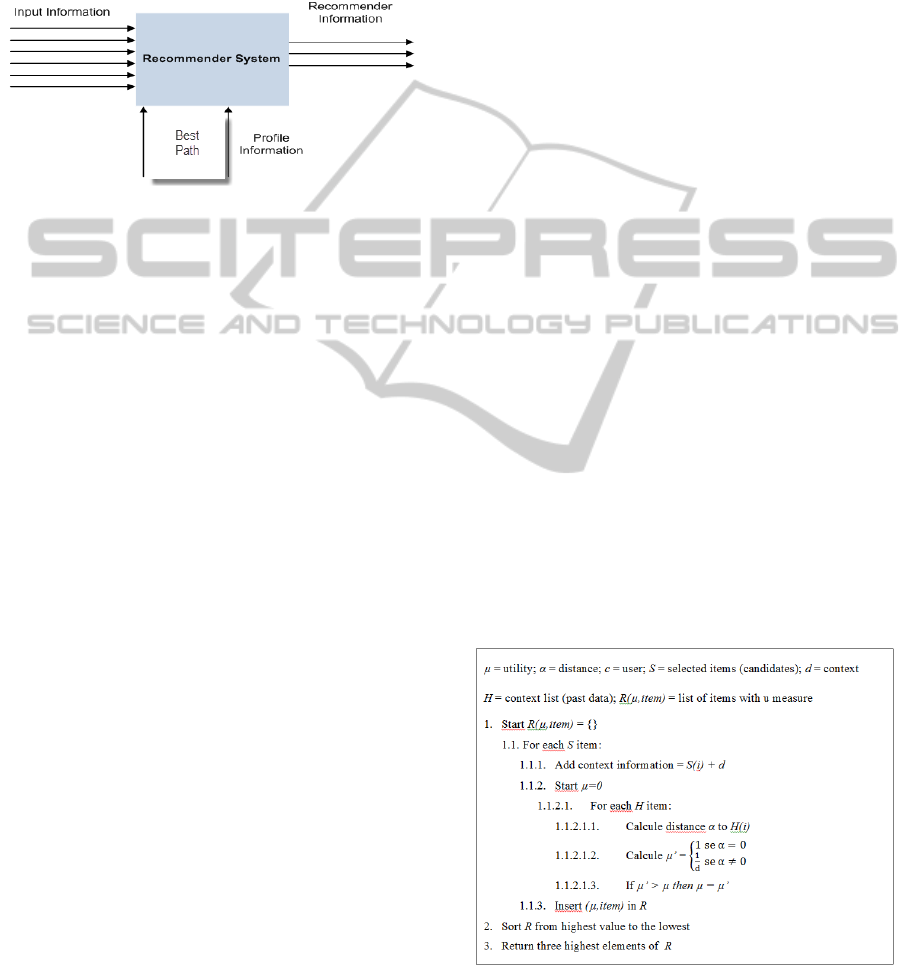
(user, item, and context), see Figure 1:
Figure 1: Overview of the Recommender System.
Input Information: Is the available information
and represents charging places and other information
related to EV driver.
Best Path: Is the algorithm implemented to
define the best travel to be performed.
Driver Profile: Represents past user options in a
three dimensional matrix based on selected
information. In our implementation this field has
only two values: value 1 represents a user choice,
and value 0 signifies user disagreement. It is used to
improve recommender system performance, based
on the fact that user preferences change based on the
context. For example, in a tourism recommender
system, the year period changes the user’s
preferences, among others. Several authors,
(Gediminas, 2005) and (Tuzhilin, 2001), suggest that
context information is used based on a bi-
dimensional space, (User, Information), in a
multidimensional matrix, u (utility): u:D
1
xD
2
x …
D
n
ÆR. Each D dimension is represented by an
information vector and the algorithm to find the best
tuple (d1,…,dn), that maximizes the utility function
(Gediminas, 2005). Our implementation uses as
context information based on four main types:
(1) function mode: “leisure” or “direct”;
(2) day period: “morning”, “afternoon” or
“night”;
(3) destination: “home” or “work”;
(4) trip status: “starting” “middle” or “ending”.
This information is stored on information
repository and is obtained by interaction with the
driver, (1) plus (3), and (2) plus (4), by the system
based on pre-defined rules. So, day period is pre-
defined on system, morning is until 12 am, afternoon
from 12 am to 19 pm, and night in the remaining
hours. Trip status is based on target distance, the
first 25% km is considered starting and the last
25% km are considered ending.
Recommender Information: Generates new
system output information, ordered by a utility
function. In this pre-release phase the proposed
system takes care of the charging point.
Each information type is represented by a vector,
with class values. The PCSs (Public Charging
Stations) are based on:
• Charging Modes: Slow, Fast;
• Operator: “MOBI.E”, “Better-Place”, “EDP”;
• Location Type: “Street”, “Small Station” and
“Big Station”;
• Services: “Without Services”, “Reservation”,
“Washing Services” and “Others”:
• Public Transportation Interface: “1”,”0”;
• Nearby Points of Interest (POI): “1”,”0” – only
if operator mode is on travel mode.
Utility (u) Calculation
User recommendation is based on utility function
(u), where only three items are showed to the user
(this is a configurable parameter). After distance
measure is introduced (Manhattan distance, others
could be implemented), it is calculated the utility
based on context information, for each piece of input
information, item I
i
: I
i
= {I
1i
, I
2i
, I
3i
, I
4i
, C
1i
, C
2i
, C
3i
}.
Where {I
1i
, I
2i
, I
3i
, I
4i
} are the characteristics of input
information I
i
and {C
1i
,C
2i
,C
3i
} are the context
characteristics.
The utility function is based on the nearest
neighbor algorithm, see Figure 2, where it includes
context and distance function. For details see
(Pereira, 2010).
Figure 2: Nearest Neighbour Algorithm used to calculate
the function utility.
SMARTGREENS2012-1stInternationalConferenceonSmartGridsandGreenITSystems
50
3 DRIVER PROFILE
Initial driver profile is manually created by the
driver, with the following information (Table 1):
Table 1: Driver profile of an Electric Vehicle (EV).
Propriety Description
User login
information
User name and password
Home Address GPS position of home address
Work Address GPS position of Drivers work
Car Information
Model, Year, Battery type and
power
Trip information
Work days or week-end +
holidays, start time, finish time,
distance (km), SOC level
This profile, later receives information about
driver trip (time, duration and km travelled) from the
tracking system. A resume of EV parameters (speed,
SOC level, travelled distance) is also stored and
associated with this profile for later range prediction.
Driving range (see section 4) is intensively
related to the driving style or mode. This happens in
all types of vehicles, but on EV, due to the weakness
related to the amount of energy stored on-board, this
relation is much clearer. Thus, changing driving
style and driving habits may be a considerable factor
on energy saving and on extending vehicle
autonomy. Considering the actions or driving habits
that can bring significant energy saving to the
vehicle operation, it is important to evaluate how
receptive EV drivers will be in changing their
driving style and driving habits towards the
achievement of the intended energy saving. The
study of this receptivity for change will be addressed
through a set of surveys made over a group of
potential EV drivers with different profiles, from
gender, age, education, job, etc. These surveys will
allow the identification of correlations between the
driver profile and new driving habits. Under these
surveys another factor that will be evaluated relates
with the acceptance for automated actions performed
by the vehicle control system. This type of actions
may be accepted for some of the driving process but
not for all driving process. For example, one driver
may accept the vehicle control system to
automatically turn off the air-conditioning under
certain conditions, but will not accept the system to
limit his driving speed. Part of this study will create
and store for further analysis a Driving Profile.
Driver profiles will play an important role to
determine the EV range, since range prediction will
be based on the assessment of the drivers’ usual
behaviour. An initial Driver profile can be identified
by the system, after being created manually by the
driver with the information presented in Table 1.
Part of this driver profile will be based on a
tracking application running on a driver’s mobile
device. This application will update driver profile
with travel distances, time and SOC levels, weather
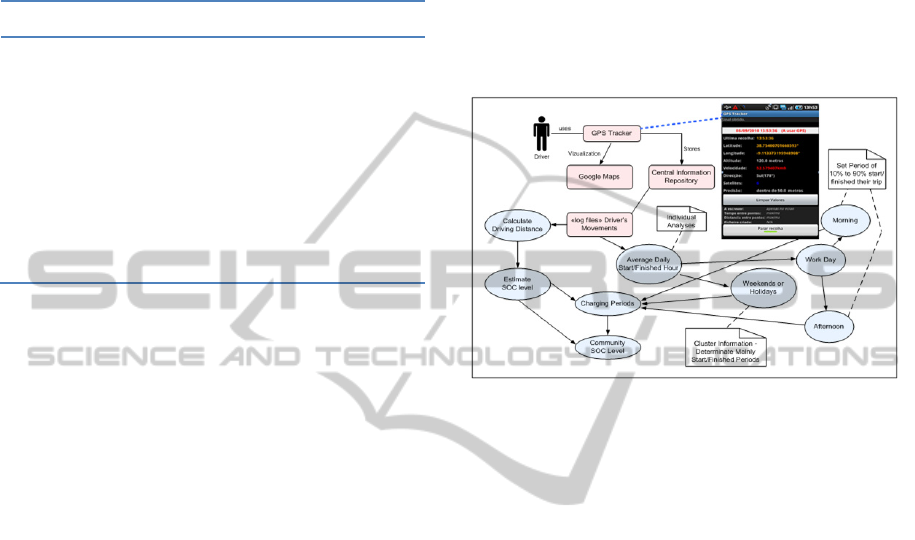
information, etc. as showed in Figure 3.
Figure 3: Main module of the driver’s tracking system in a
mobile device with GPS and with information created
from the Drivers Movements database.
4 RANGE PREDICTION
Range prediction is the process of estimation the EV
range based on three main dependency types:
1) The EV with its main variables: the model of
the vehicle (mainly its performance under different
scenarios, speed, and acceleration), the chemical
technology of the batteries (as lithium-iron-
phosphate, lithium-titanate, or nickel-metal-hidride)
the batteries characteristics (mainly, variation of
SOC, temperature, lifespan, performance, specific
power, specific energy, and safety), and the EV
powertrain (electric motor and its power converter,
as well as the other electric parts, as batteries
charger, controllers, and power cables). This data is
stored on an information repository on a central
server. All of these parts will influence the SOC and
consequently the range prediction. The batteries
SOC, and other relevant parameters, are provided to
the main control system through CAN-bus
communication, and then these information’s are
stored in a data base (DB), in order to predict the
available range.
2) The driver behavior: speed and acceleration
information are taken from EV through the CAN-
bus communication, and the driver past behavior
ELECTRICVEHICLEROUTERECOMMENDERSYSTEM
51
(e.g., SOC level versus travelled distance achieved),
are stored in a DB. Weight is a manual input, and
driving directions are acquired based on the GPS
information.
3) Environment: current location, traffic
conditions (taken from a web service), road
information (in a distance graph), weather
information (wind and temperature, taken from a
web service), and altitude, taken from GPS.
The range prediction procedure is in a first step
based on the batteries SOC level, and using driving
behavior (relation of SOC level versus travelled
distance achieved, from past experience, stored in a
central information repository). This distance is
tuned based on weather information: if it is hot, a
percentage of the energy stored in the batteries is
taken for air-conditioning; if it is raining, a
percentage of energy is taken for the window
cleaning process. For night drive, also a percentage
of energy is taken for light services. A web service
brings traffic information, and based on past
experience (e.g., information about driving times
and traffic information), a driving range is predicted.
Current driving behavior (e.g., driving speed and
accelerations) are taking into account in this process.
Once it is achieved the EV range estimation, it is
started the calculation of the possible reachable
points based on current position.
Most of these estimation processes were
performed based on simple heuristics
(Ferreira, 2011). For example, if the weight is above
a configurable threshold, a percentage of reduction
is applied on the range (this value should be tuned
from past experience data and depending on EV
parameters). Also altitude was taken into
consideration, using Google maps to obtain the
altimetry of the desirable path, again several levels
were configured, and also is applied a percentage of
reduction in the range, in function of the altitudes to
overcome in the path. Temperature is an important
parameter, because of the relation with air-
conditioning. The temperature was divided in five
classes range: (1) less than 5ºC; (2) from 5ºC to
15ºC; (3) from 15ºC to 25ºC; (4) from 25ºC to 30ºC;
and (5) above 30ºC. For classes 1 and 5 it was
assumed that all drivers use air-conditioning, for
class 3 no usage is performed, and for classes 2 and
4 it is considered that a percentage of drivers use air-
conditioning (initial profile parameter, but past data
can tune this behavior). Traffic information is used
again as a parameter that can reduce range, because
possible starts/stops on traffic jams increase
consumption.
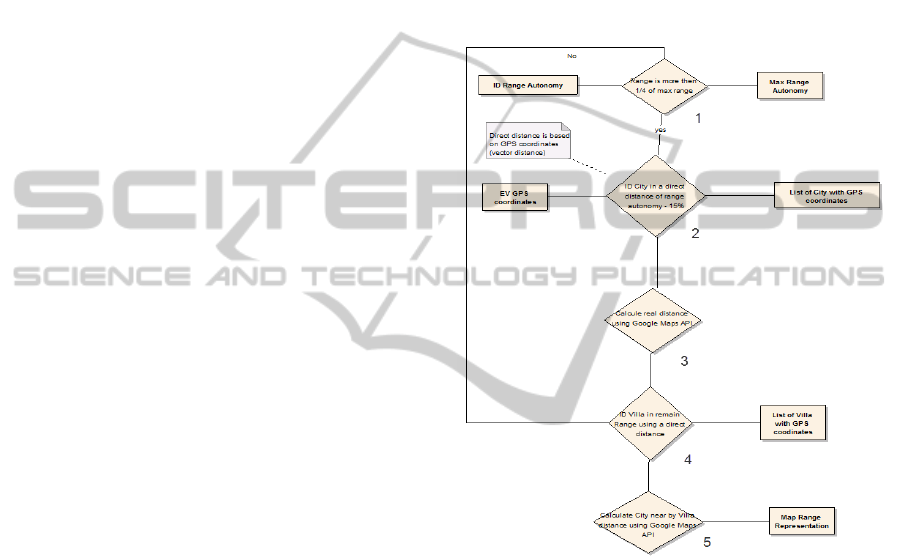
4.1 Range Representation
Once a range prediction is achieved, a topographical
search starts with the current driver position, based
in Figure 4. Main road nodes are used to check
distances from current position and a polygon
representation is achieved (see Figure 5 and Figure
6) based on Google API usage. A zone of
uncertainty can be marked, based on the uncertainty
parameters used to estimate the drive range (see
Figure 7).
Figure 4: Range representation process using Google
Maps API.
If the SOC level is below 25 % (available range
should be around 30 km-40 km) it is calculated
every road option with guidance to the nearest
charging point. Taking into account Figure 5, it was
considered Lisbon as the starting point. Since the
available range for the EV is around 160 km, the
implemented process starts to look for main
destinations in a radius of 130 km to 160 km. This
distance calculation is based on GPS coordinates of
correspondent places. For Lisbon as the starting
point, the process identified the following cities
(Figure 4, process (2)): Pombal, Leiria, Marinha
Grande, Ourem, Tomar, Évora, Grandola, Santiago
do Cacém and Sines. Then, the distances are
calculated based on Google Maps query (Figure 4,
process (3)), and the process identifies that Pombal
are out of the EV range. The distances calculated to
SMARTGREENS2012-1stInternationalConferenceonSmartGridsandGreenITSystems
52
the other locations are within the available range of
the EV. For example, the distance from Lisbon to
Évora is 134 km, so the process (4) (Figure 4) looks
nearby villas, and process (5) (Figure 4), identifies
the ‘real’ distance. In the case of the present
example (Figure 6) and using the city of Évora as
destination, it is available more 26 km, which allows
increasing the range representation around Évora
with a radius of 20 km. The output of this iterative
process is represented in Figure 6. For every 5 km of
EV movement this map is again calculated and
represented. The web range estimator represents
range by the connection of main distances and
putting the polygon together. To do so, our
application uses Google maps API and shows the
polygon on a mobile device display, as showed in
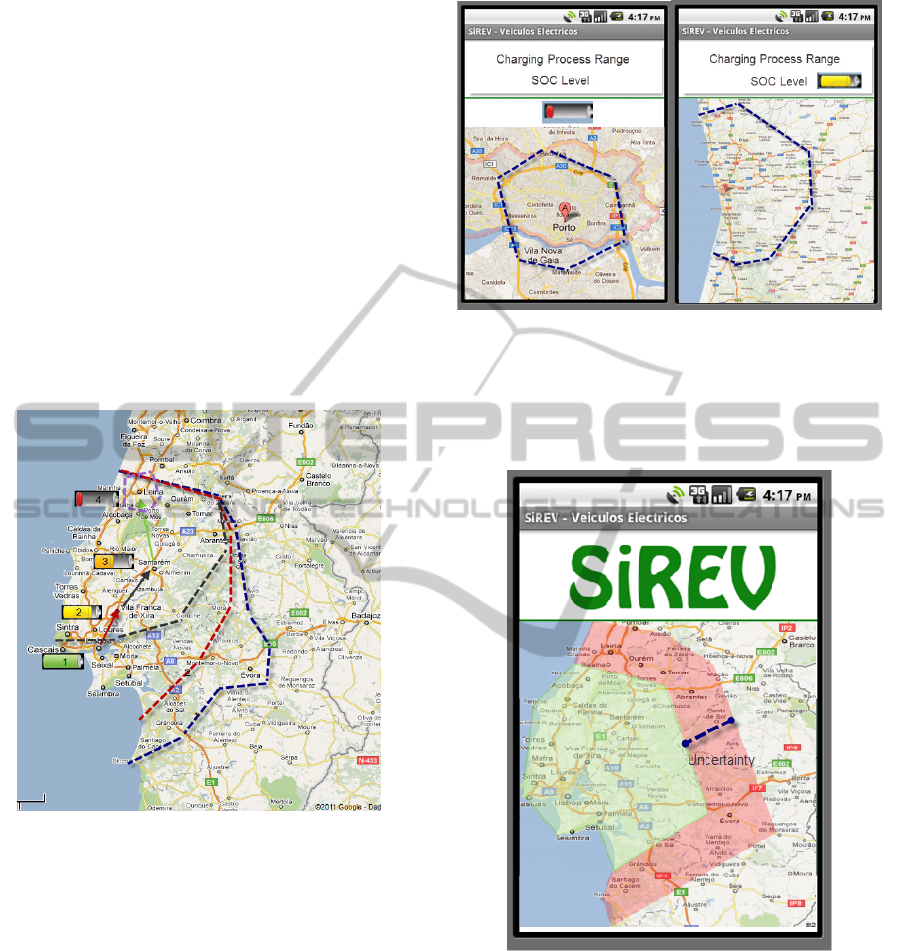
Figure 5 and Figure 6.
Figure 5: Range estimation of a trip from Lisbon to north,
where four different cases are shown.
For the charging process, the range prediction
and their representation is performed in the same
way. Based on the charging level (SOC information)
the application predicts the range based on previous
driving parameters (past relations of SOC levels and
distances achieved stored in driver profile) and
based on this information represents using Google
Maps the regions that is possible to reach with that
charging level. System is prepared to generate alerts
about charging levels needed to reach a charging
station (it is assumed that a charging process is
always performed in a charging station, in the
driver’s home or in the work place). The range
prediction process has several uncertainty factors
that reflect driving behaviour and external condition
(e.g . traffic, road topology and weather). These
Figure 6: Representation of the charging range for
different SOC levels, with a charging process performed
in a public charging station in the centre of Porto city. On
left, with a low SOC level, a small area is achieved. On
right, with almost 90% of SOC level, a large area is
achieved.
Figure 7: Range estimation based on the uncertainty
factors shown in Figure 4.
factors showed in Figure 4 can be used to estimate a
safe range (green shadow in Figure 7) and a
maximum range. The red shadow in Figure 7 is
arange that is possible to achieve but the driver
needs to perform driving optimization (air condition
off and avoid big accelerations). This could be
helpful information because driver can customize his
behavior function of the range it needs to achieve in
their trip. This process is can be continue updated
and when SOC level is low this uncertain gets low.
ELECTRICVEHICLEROUTERECOMMENDERSYSTEM
53

5 REAL TIME INFORMATION
AND BEST PATH
Real time information is available from road
concessionaries, but outside these organizations the
access to this information is most of times denied.
There are technical issues to solve because each
organization has its own data format, and data
integration is a real problem. During current
research work several approaches were performed to
have access to these data (with the Municipal
Chambers of Lisbon and Loures, and with the
company Brisa), but all the requests have been
denied. The problem was contoured with the
creation of a web crawler to pick traffic information
from specialized sites by pre-defined heuristics, and
a XML file with traffic information was created
(Fontes, 2008). The XML file is an approach of
future data integration from different source
providers. In Figure 8 is illustrated the process of
XML file with road information oriented to a geo-
reference graph.
Figure 8: Semi-automatic creation of a XML file with road
information to be used for graph creation.
The Crawler (WebNews, version 1.0) was
configured to pick traffic information from TVI web
site [http://www.tvi.iol.pt/transito.php] and also a
Web service from Sapo was implemented.
Information about nodes were checked against a
heuristic table, where a conversion factor (CVF)
reduces the node speed traffic (if the rode is blocked,
with no traffic flow, the CVF is zero). Figure 9
illustrates this process. The result is stored in an
adjacency matrix, where the number aij represents
the cost of going from i to j. This process creates a
graph representing the map, where the arcs represent
roads and nodes represent intersections or traffic
areas. To determine the best path between two points
on a map an algorithm could be applied to this graph
to find the path with less weight between the two
desired points.
The weight of an arc is basically the average
time in seconds that it needs to be traveled, for this it
is used the equation:
Time = (L / V) * 3600,
where L represents the size of the graph in km
and V is the top speed allowed. For all arcs there is a
speed limit which serves as the basis for the weight
of the cases in which there is no traffic information.
When there is traffic information for a particular arc,
the weight of this arc is affected because the traffic
influences the speed. For example, if an arc with
heavy traffic has a speed limit of 90 km/h, given the
existing traffic, the reduction factor of the maximum
speed has a value set between 0 and 1, based on
current traffic information, causing the increase of
the time required for this arc to be traversed, as
much as its weight increases. If the transit is cut off,
the factor of speed reduction assumes the value 0,
and the maximum attainable speed is set to 0 km/h,
what causes this arc to have an infinite weight.
If traffic is proceeding smoothly, without any
problems, the factor of speed reduction has a value
equal to 1, and the maximum attainable speed
becomes equal to the speed limit, which makes this
arc to assume the lowest weight possible, what is
translated in a reduction in the mean time the arc
needs to be traversed. This weight can integrate also
public transportation information and a price
associated with CO
2
emission of private
transportation. Users can choose the impact
parameters based on their strategies, in order to save
money, to satisfy conveniences, or even to save
time. For a complete description see (Fontes, 2008).
Figure 9: Graph node weight calculation based on traffic
information from web sites (traffic information in
Portuguese language).
Example: Path A1 (Alhandra – Alverca).
Maximum speed allowed on this section: 120 km/h
(motorway), but traffic information shows average
speed is 84 km/h. Distance is 5km, so
SMARTGREENS2012-1stInternationalConferenceonSmartGridsandGreenITSystems
54

arc weight = (arc distance / average speed) x 3600 s
= (5000/84000) x 3600 ≈ 214 s.
Let’s consider, in this example, that public
transportation takes more or less twice the time
spent with private transportation (by car), consisting
in a time of 400 s.
Transportation price is 1 € and car transportation
is 2 €, including the price for CO
2
emissions and fuel
price. If drivers choose the same weight factor for
time and price, then the arc weight for car
transportation is 214 x 2 = 428, and the
transportation arc weight is 400 x 1 = 400. In this
case these values approximately the same, but if the
process takes care of parking price of the vehicle in
the city, the system increases again the arc weight
for private car, and then the system suggests the
option of public transportation (PT), showing the
next PT arriving to the nearest PT stop. System is
able to provide orientation to the nearest PT stop.
To determine the best route or the quickest route
was implemented a Dijkstra's algorithm, where its
running time is proportional to N
2
, with N being the
number of nodes in the graph. The graph to be used
by this Dijkstra's algorithm is represented by an xml
file. The best way to apprehend the quickest way is
determined using the Dijkstra algorithm. In our web
application there is a class called Dijkstra, which is
where the algorithm is implemented. For a complete
description method sees (Fontes, 2008). Information
exchanges with external systems are based on XML
files.
6 CASE STUDY
EV create new paradigms to mobility due to its
limited range and long recharging times, and
inevitably have impact on the day-to-day of the
drivers, who have to plan their journeys and stops
for recharging. These problems will tend to decrease
with the technological advances that increase the
autonomy of the vehicles, and with the development
of a network of battery charging places, with an
increasing number of alternative sites, as well as
with a larger geographical dispersion.
Current work shows scenarios that could be
considered as representative for most types of
electric vehicles in the near future. In Table 2 are
presented the data used in the case study.
Table 2: Data used in the case study.
Characteristics Values
EV Autonomy 150 km
Charging Points in Portugal 1,300
Slow Charging 6 Hours
Fast Charging 30 Minutes
Change Battery 10 Minutes
6.1 Case 1 - Day-to-day Urban
This scenario shows the use of Electric Vehicle (EV)
by a driver who lives on the outskirts of a big city,
and uses the EV to go to the work. The driver takes
the kids to school every day, and after the job, goes
to a gym session before making the return trip. His
typical driving day is:
• 07:30 - He leaves home with the EV fully
charged, after charging during the night;
• 08:15 - He covers 30 km until reaches the school
of the first son;
• 08:30 - He traverses 5 km to reach the school of
the second child;
• 09:00 - He covers 10 km to came to his work
place;
• 12:30 - He goes out for lunch in his EV covering
a total of 10 km;
• 18:00 - He covers 10 km to the Gymnasium;
• 19:30 - He covers 10 km to the school of the
child;
• 19:45 - He covers 5 km to the school of the other
son;
• 20:30 - He covers 30 km in the way back home.
The driver returns home with 25% of the EV
battery capacity.
This is the optimal scenario, appointed by
opinion builders to justify the viability of EV,
vehicles even with the current state of autonomy.
However in this scenario an extra utilization of the
EV cannot exist, as leaving home in the evening for
dinner, or visiting friends. Besides, in this scenario
all EV owners have to be able to charge their
vehicles at home overnight. For the vast majority of
the population that lives in metropolitan areas, it is
not possible to charge the batteries of the vehicles
during the night, since the vast majority of them live
in buildings without parking or garage that make
possible the overnight charging. For these cases the
batteries charging must be carried out during the
day, or in the middle of a travel, as with today's
vehicles powered by fossil fuels.
ELECTRICVEHICLEROUTERECOMMENDERSYSTEM
55
Thus, maintaining the same schedule, but
removing the batteries charging during the night, the
driver will enter the vehicle with 25% of the battery
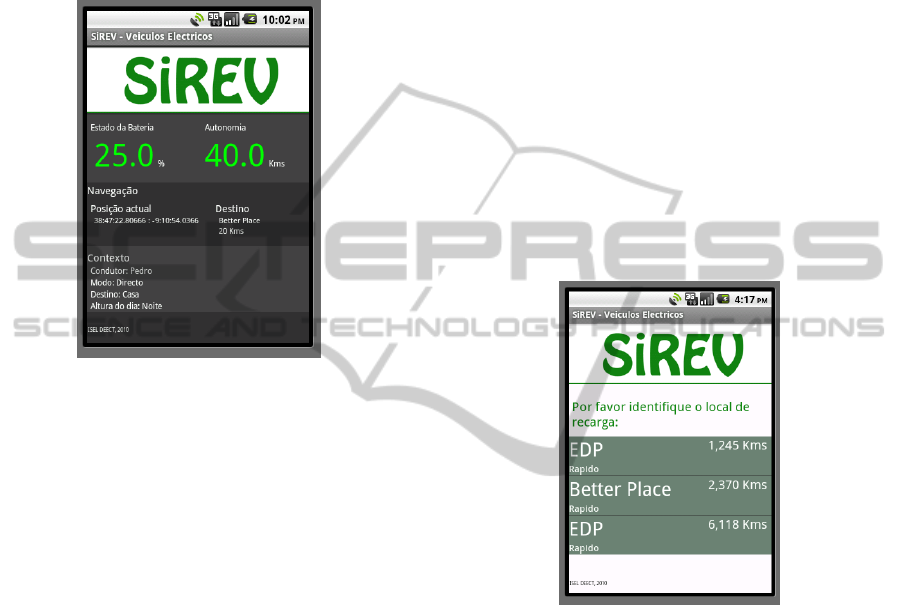
capacity. Figure 10 shows the main screen of the
application with the indication of charging and
battery life management system received from the
battery through the adapter.
Figure 10: SiREV: Charging indication (SOC); EV
estimated autonomy; A charging place identified (Better
Place) at 20 km; and the Context Information (driver,
mode, destination and day period) (in Portuguese
language).
The vehicle's range is 40 km, however the trip
will have a total of 45 km and it will be necessary to
recharge the EV batteries to get to the destination.
The SiREV presents an alert indicating the need
to recharge the batteries, and shows the alternatives
identified by the recommendation system. Since this
is a trip to work, the goal will be to arrive as quickly
as possible, so the recommendation system presents
three alternatives for fast charging, and set the route,
given the previous choices. The first step is to
submit a recommendation to select the candidate
items for the SiREV, and then it uses the
information gleaned from smartgrid to create a list
of all the charging points that can be reached by the
vehicle. In this scenery the vehicle is in Odivelas,
outside Lisbon, so the number of charging points is
high. It is created a list of 30 possible charging sites.
Then the list is sent to the component that manages
the public transport information to validate the
proximity of interfaces with different means of
public transport. The component validates each of
the candidate items and returns the updated list.
The next step is the processing of the
recommendation. At the entrance of the
recommendation system there is a list of 30
candidate items distributed as follows:
• 15 Points of slow charging: 5 of EDP; 5 of
Better Place; 5 of Mobi.E.
• 10 Points of fast charging: 4 of EDP; 3 of Better
Place; 3 of Mobi.E.
• 5 Points of drop-off (in which the batteries are
replaced): 1 of EDP; 3 of Better Place; 1 of
Mobi.E.
The driver of this studied case never chooses the
drop-off sites, nor it is important for him to select
locations near public transport. This driver has a
clear preference for places of charging of EDP,
followed by Better Place, and he never charges his
EV at places of Mobi.E. The algorithm returns a
recommendation to run the utility with more than
three items after comparison with the history of the
driver choices. The following screen is displayed to
the driver, Figure 11:
Figure 11: Showing recommendation, regarding charging
points that fits drivers’ choices (in Portuguese language).
The driver selects the first recommendation of
SiREV and sends the data on the location of the
Public Charging Station (PCS) for the navigation
system. Reached the PCS the charging process starts
and SiREV presents progress and an indication that
the vehicle performs in charging state. It is possible
to visualize in a map the distance that the EV can
reach with that charge. The driver can perform a
charge until the desirable distance is reached (if less
than the maximum range).
After the driver leaves the two children at school,
SiREV continues to put a notification in the
notification area that the vehicle's range is below the
limit. Upon reaching the destination the driver
selects the notice and recommendation system
introduces three new options for charging, this time
the system knows that the vehicle is at its destination
SMARTGREENS2012-1stInternationalConferenceonSmartGridsandGreenITSystems
56

because it is less than 5 km from the site displayed
as a destination, so presents options for charging
along three car parks within walking distance (see
Figure 12-left). The batteries will charge while the
driver is on his job.
After 4 hours, the driver receives an SMS
notification on his phone, indicating that the
batteries are fully charged (with 100% of energy
storage capacity). The driver rests, assured that he
can keep his routine the rest of the day, and that 150
km of EV autonomy are available until the next
working day.
Figure 12: Recommendation of charging places nearby
(left) and SiREV detects that EV range is below 30% of
initial range (right) (in Portuguese language).
6.2 Case 2 - Long Distance between
Home and Work
This scenario presents the situation of a driver who
lives at a considerable distance from his work place.
The driver lives in a distant city but works in
downtown Lisbon. The trip from home to work is
100 km. The driver lives in a building with a garage,
but without a charging point for electric vehicle. A
typical daily schedule of this driver is:
• 08:00 - Departure from home;
• 09:30 - He covers 100 km to his place of work;
• 13:00 - Out to lunch, traveling a total of 5 km;
• 19:30 - Return back home, covering 100 km.
This daily driver travel is 205 km long. Using the
system SiREV, and assuming that, as in the previous
case, in the morning the EV has 25% of its energy
storage capacity. Upon entering the EV and after
selecting the profile and identifying the destination
the driver is alerted to the fact that he must charge
his EV in a radius of 30 km. The system
immediately displays the recommendations taking
into consideration that the driver goes to his work
place (see Figure 12-right).
The three options presented are of fast charging
type, and have in common the fact that they are
service areas that have cafeteria service. Whenever
the driver needs to recharge the EV batteries in the
morning, he chooses a service station with cafeteria
service, because he takes the advantage of taking the
breakfast as the car recharges. While having
breakfast, the driver is alerted to the fact that the EV
batteries are already charged. Back to the car, he
follows his route to employment. Arriving at the
entrance to Lisbon the battery pack is again with a
low level of charge, with only 30% of stored energy,
so that the driver is alerted to that fact.
The diver remains far from his destination, thus
he is presented to all the fast charging options, and
to an option of slow charging, but he is also near an
interface to public transport, enabling the driver to
put the car in a park covered with charging service,
and continuing his journey by public transport. The
driver chooses to deposit the car in the park, let the
EV to be charged, and use public transport to go to
the work.
After 6 hours the driver is notified that the EV
batteries are fully charged, and so, he knows that can
return home with his EV, because the energy stored
in the batteries will be enough to cover the 100 km
back.
6.3 Case 3 - Car Ride at Weekend
In this scenario, the same driver of the second
scenario leaves home on a Saturday morning for a
ride with the family in the western coastal zone of
Lisbon. When entering the vehicle the driver
identifies himself and indicates that he will shift into
drive, with no predetermined destination.
After an hour of travel, the system notifies the
driver that the autonomy of the vehicle reached the
configured limit of 30 km, and displays an alert, as
showed in Figure 13 (left).
In this situation the recommendation system will
consider the following context: (1) Operating mode:
leisure; (2) Time of day: morning; and (3)
Destination: No destination.
The system has the following three charging
station recommendations, see Figure 13 (left).
All recommendations are slow and charging
points have in common the fact that they are near
centers of tourist interest, with places to visit. The
full charge will take about six hours, so the driver
and family can visit the Points of Interest (nearby),
lunch in one of several restaurants. Just four hours
ELECTRICVEHICLEROUTERECOMMENDERSYSTEM
57

after the driver decides to return home. The vehicle's
range is 70%, and will not reach the destination.
After walking 50 km of new drivers are notified
that you have to carry the load of the vehicle. In this
situation the recommendation system will consider
the following context: (1) Mode of Operation:
leisure; (2) Time of day: Afternoon; and (3)
Destination: House.
By stating that the destination is home, the
recommendation system provides fast charging
points along the route (Figure 13-right), in this
context because the driver always chooses this type
of sites because they want to get home as soon as
possible.
Figure 13: Recommendations given by the Recomender
System, because SiREV detected that range is below the
configured limit of 30 km: On left - recommendation for
slow charging points; On right - recommendation for fast
charging points (in Portuguese language).
7 CONCLUSIONS
The main objective of this work is to help drivers in
the daily use of Electric Vehicles (EV), acting
proactively and increasing the attractiveness of EV.
However, EV technology is still under development,
and so, all available information systems are
necessary for a successful full integration of the
Electric Vehicles in the transportation system. In this
work it is proposed the integration of information
from various areas that can be important in the
successful implementation of a mobility model for
drivers of Electric Vehicles. It is also necessary to
ensure that the integration model is sufficiently
generic and flexible to be adapted to different
systems, having a low impact on the implementation
of a Recommender System. On the other hand, it is
easy to see that the technologies needed to develop a
mobile system, capable of receiving position and
geographic information, and able to establish
connection to external devices or to the Internet,
have a very advanced level of development. The
Android system allows a very simple and efficient
development of applications, with the advantage of
being totally free of cost, both with regard to the
licensing of their own API and developer tools,
which are all based on free software. The ease of
development, the integration with GPS, USB,
Bluetooth, SMS, and the test execution, makes the
implementation work very efficient.
The usage of the developed Recommender
System showed only part of all its potential for
application in the Electric Mobility context, It will
be part of future work to deepen the study of a more
complex model for the Recommender System, with
the optimization of the scenario in question,
demonstrating the validity and enforceability of this
project in a real use, with its added value, in an
attempt to identify functional requirements and
possible ways for their implementation.
ACKNOWLEDGEMENTS
This work is financed by FEDER Funds, through the
Operational Programme for Competitiveness Factors
– COMPETE, and by National Funds through FCT –
Foundation for Science and Technology of Portugal,
under the project PTDC/EEA-EEL/104569/2008 and
the project MIT-PT/EDAM-SMS/0030/2008.
REFERENCES
Ferreira, J. C., Monteiro V. and Afonso J., 2011. Mobile
Geographic Range Prediction for Electric Vehicles.
Proceedings of the 1st Conference in Electronics,
Telecommunications, and Computer Engineering, from
24th to the 25th November, 2011, at Instituto Superior
de Engenharia de Lisboa – ISEL, Lisbon- Portugal.
Gediminas A., (2005). Toward the Next Generation of
Recommender Systems: A Survey of the State-of-the-Art
and Possible Extensions, IEEE Transactions on
Knowledge and Data Engineering, Vol. 17, Nº. 6, June
2005
Tuzhilin A., Gediminas A., 2001. Multidimensional
Recommender Systems: A Data Warehousing
Approach, Springer Berlin/Heidelberg, 2001.
Pereira P., (2010). Sistema de Recomendação para
Condutores de Veículos Eléctricos. MSc dissertation -
ADEETC- ISEL, Lisbon.
Fontes T. F., (2008). Determinação do melhor caminho
em sistemas de transporte terrestre (BPath – Best
Path). Final Year Project at ADEETC – ISEL, Lisbon.
SMARTGREENS2012-1stInternationalConferenceonSmartGridsandGreenITSystems
58
