
THE MERGE PROJECT
Impacts of Electric Vehicles on the Distribution System Steady-state Operation
F. J. Soares, P. N. Pereira Barbeiro, C. Gouveia, P. M. Rocha Almeida, C. Moreira
and J. A. Peças Lopes
INESC TEC – INESC Technology and Science (formerly INESC Porto) and FEUP – Faculty of Engineering,
University of Porto, Campus da FEUP, Rua Dr. Roberto Frias, 378, 4200 – 465, Porto, Portugal.
Keywords: Charging Strategies, Critical Mass, Distribution Grid, Electric Vehicle, Steady-state Operation.
Abstract: This paper describes the main results of the MERGE project relative to Electric Vehicle (EV) charging
strategies and the impacts of EV integration on the steady-state grid operation. MERGE is a €4.5m,
collaborative research project supported by the European Commission’s Seventh Framework Programme
(FP7). The consortium includes utilities, regulators, commercial organisations and universities with interests
in the power generation, automotive, electronic commerce and hybrid and electric vehicle sectors across the
entire European Union (EU). One of the MERGE project missions is to evaluate the impacts that EV will
have on EU electric power systems, exploring EV and SmartGrid/MicroGrid simultaneous deployment,
together with renewable energy increase, to achieve CO
2
emission reduction through the identification of
enabling technologies and advanced control approaches. The work presented proposes three charging
strategies, dumb charging, multiple price tariffs and smart charging, and uses EV integration scenarios of
adherence to these charging schemes. The resulting scenarios are tested using an algorithm coded with
Python and using PSS/E, created within the MERGE framework to study EU grids steady-state behaviour.
Additionally, the critical mass of EV adherence to smart charging schemes that brings positive impacts to
the distribution grids operation was also evaluated.
1 INTRODUCTION
The changes that the actual electric power systems
are facing, namely in what regards renewables and
Electric Vehicles (EV) integration, will require
system operators to develop new network planning
and operation strategies in order to deal with the new
challenges arising from their large scale deployment.
In what regards networks planning and operation,
especially at the distribution level, the integration of
EV should be seen not only as a challenge, but also
as big opportunity to exploit the power systems’
infrastructures in a more effective manner and to
safely integrate larger quantities of renewables in the
systems.
The large scale integration of EV is very likely to
provoke several impacts in the power systems,
namely at the distribution level, like changes in the
branches loading, voltage profiles and load
diagrams.
Since EV are expected to be plugged-in in the
distribution systems, namely in Low Voltage (LV)
and Medium Voltage (MV) grids, these type of
networks are the ones where the EV charging
impacts will be strongly noticed. Congestion
problems are expected in already heavily loaded
grids, while in radial networks voltage limits
violations are likely to appear more frequently. The
changes in the energy losses is also a matter of great
concern, since the increase in the energy demand
owed to EV charging will probably make their value
rise considerably. The negative impacts referred are
more prone to appear if uncontrolled EV charging
strategies are used. In addition, the non-
controllability of the EV charging will also impact
negatively the profit that the EV
Supplier/Aggregators (EVSA) might achieve from
the markets negotiations, as they will not have
flexibility to shift the EV load towards the lower
demand periods, being thus incapable of profiting
from lower energy prices (Lopes et al., 2011).
On the other hand, the possibility of controlling
the EV charging will be of great benefit for both
EVSA and Distribution System Operator (DSO).
91
Soares F., Barbeiro P., Gouveia C., Almeida P., Moreira C. and Lopes J..
THE MERGE PROJECT - Impacts of Electric Vehicles on the Distribution System Steady-state Operation.
DOI: 10.5220/0003953600910100
In Proceedings of the 1st International Conference on Smart Grids and Green IT Systems (SMARTGREENS-2012), pages 91-100
ISBN: 978-989-8565-09-9
Copyright
c
2012 SCITEPRESS (Science and Technology Publications, Lda.)

The EVSA will have the possibility of exploit the
EV flexibility for charging, namely the EV that are
parked during large periods of time overnight, thus
profiting from lower energy prices. Under these
circumstances, the EV charging management
performed by the EVSA will naturally shift a
significant amount of the EV load from the peak
hours towards lower demand periods, contributing to
improve the network operating conditions, to reduce
the energy losses and to diminish the DSO need to
invest in network reinforcements (Lopes et al.,
2011).
Nevertheless, in order to develop adequate
strategies to control the EV charging, it is first
required to evaluate the impacts that this new
elements will provoke in the power systems’
operation.
The project MERGE (Mobile Energy Resources
in Grids of Electricity) was created in order to seek
for solutions for the aforementioned problems. Its
mission is to evaluate the impacts that electric
vehicles will have on the European Union (EU)
electric power systems, in what regards planning,
operation and market functioning. The focus is
placed on EV and SmartGrid/MicroGrid
simultaneous deployment, together with renewable
energy increase, leading to CO
2
emission reduction
through the identification of enabling technologies
and advanced control approaches (Bower et al.,
2011).
One of the tasks of the MERGE project
involved the development of an evaluation suite
composed of several simulations tools capable of
identifying the impacts that the EV integration will
provoke in the electric power systems. The
assessment has been performed by analysing several
EU real networks using future EV integration
scenarios for 2020 and 2030.
This paper presents the results obtained with one
of the tools of the referred evaluation suite, which
was developed to perform steady-state simulations
in distribution networks (Rosa et al., 2011). The tool
incorporates several EV models, allowing estimating
the EV charging impacts in a given network, during
a week period, when different charging strategies are
adopted.
Five real MV networks were used as case
studies. For each network it was calculated the
maximum number of EV that can be safely
integrated, the changes provoked by EV in the
voltage profiles, lines loading, energy losses and in
the load diagrams. A comparison between the results
obtained for the maximum number of EV that can be
safely integrated in the studied MV networks and the
foreseen EV integration scenarios for 2020 and 2030
was also performed. Additionally, the critical mass
(percentage) of EV owners that need to adhere to
controlled charging schemes in order to enable the
safe operation of the networks was also analysed.
A brief description of the methodology followed
in the simulations, as well as the MV networks used
as case studies, is presented in the next section.
2 METHODOLOGY AND CASE
STUDIES
The methodology followed during the steady-state
simulations can be divided in two parts: one to
quantify the maximum EV number that can be safety
integrated in a given network (section 2.1) and
another to analyse the critical mass (section 2.3).
2.1 Methodology to Quantify the
Maximum Number of EV that can
be Safely Integrated
The quantification of the maximum number of EV
that can be safety integrated in the distribution
networks analysed was performed for each network
considering three charging strategies: dumb
charging, multiple tariff and smart charging.
In the dumb charging approach it is assumed that
EV owners are completely free to connect and
charge their vehicles whenever they want. The
charging starts automatically in the moment when
EV plug-in and only stops when the battery is fully
charged or when the EV is disconnected from the
grid by its owner. This approach should be described
as a no control strategy but it is particularly
important as it provides a measure for the
assessment of the efficacy of the other management
procedures.
The dual tariff intends to simulate a situation
where electricity is cheaper during some specific
hours of the day. For the simulations performed
within the MERGE project, the cheaper period was
assumed to be enclosed between 1h and 7h.
The smart charging strategy envisions an active
management system, where the EV aggregating
entities are capable of managing the EV charging
according to the market negotiations, always taking
into account the EV owners’ requests. In addition, it
is assumed that the DSO is capable of monitoring all
the elements connected to the grid and its state,
having also the capability of interfering in the EV
charging schedules in order to solve eventual
SMARTGREENS2012-1stInternationalConferenceonSmartGridsandGreenITSystems
92

technical problems that might appear in the grid.
This type of management provides the most efficient
usage of the resources available at each moment,
enabling congestion prevention and voltage control.
During the simulations performed, the following
EV charging scenarios were considered:
All EV in dumb charging mode;
All EV in multiple tariff mode;
All EV in smart charging mode.
The implementation of the different EV charging
strategies in the simulation platform is thoroughly
described in (Rosa et al., 2011).
The simulations for each network and for each
charging strategy starts assuming an EV integration
that corresponds to a replacement of 1% of the
conventional vehicles fleet by EV (see Table 1). The
impacts of the referred EV integration level are then
evaluated. If no violations of the network
components’ technical limits were detected, the EV
integration percentage is increased by 1% and a new
evaluation of the network operating conditions is
performed in order to detect if any violation
occurred. This process is repeated until one of the
following conditions is verified: violation of the
voltage limits specified and/or branch overloading.
The maximum percentages of EV that can be
safely integrated in the MV networks analysed, for
each charging strategy, is recorded in the end of the
simulations.
In all the case studies, it was assumed the
existence of one fast charging station per network.
As it will be further demonstrated through the results
presented in section 3, fast charging stations have a
considerable impact in branches’ congestion levels
and in the voltage profiles. For this reason, the
network bus to which the fast charging station was
assumed to be connected, in each case study, was
selected among the network buses with the highest
voltage values. The EV resort to the fast charging
stations when, during a journey, their battery SOC is
not enough to complete the journey.
For the EV charging scenario that considers the
multiple tariff, it was assumed that the period of
lower energy prices is between 1h and 7h, every day
of the week.
2.2 MV Networks used as Case Studies
As referred previously, a set of five real MV
networks were used as case studies. These networks
were carefully chosen in order to evaluate systems
with different characteristics, like their topology
(rural or urban) and their type of consumers
(industrial, commercial or residential). In Table 1 it
is presented the most relevant characteristics of the
tested networks. A detailed description of these
networks can be found in (Sánchez et al., 2010).
Table 1: Networks’ characteristics.
Besides the variables presented in Table 1, load
diagrams may also have a significant influence in
the results obtained. The load profiles of each
network, during a typical week, are presented in
Figure 1. As it can be seen, the load diagrams of the
networks tested vary significantly. This variation
may be explained by the different climate, social-
cultural and economic conditions of each area.
Despite de differences, well defined daily patterns
are easily identified for all the networks except the
rural, where the load consumption along the week is
more irregular.
The identification of the daily load patterns is
very important for the implementation of the dual
tariff and the smart charging. For the former, the
daily load patterns can be used to define the period
during which the electricity price is lower, seeking
to incentivize the EV owners to shift their EV
existence charging to the lower demand periods. For
the latter, the knowledge of daily load patterns will
considerably ease the EVSA tasks in what regards
the prediction of the EV load, since it will allow
them to reduce forecasting errors and schedule the
EV charging with higher accuracy.
0
25
50
75
100
125
150
175
200
225
250
Monday Tuesday Wednesday Thursday Friday Saturday Sunday
Power (MW)
MV Network 1 MV Network 2 MV Network 3 MV Network 4 MV Network 5
Figure 1: MV networks load profiles for a typical week.
THEMERGEPROJECT-ImpactsofElectricVehiclesontheDistributionSystemSteady-stateOperation
93

2.3 Methodology and Case Study used
in the Critical Mass Simulation
For the critical mass study, the first step of the
procedure followed consisted on the consideration of
a fixed EV integration percentage, of which one half
of the EV were assumed to be dumb charging
adherents and the other half multiple tariff
adherents. Then, if problems were not detected, the
EV integration percentage was increased by 10%,
assuming the same proportion of dumb charging and
multiple tariff adherents (50% of each). This
procedure was repeated until a problem in the
network was detected (either a voltage lower limit
violation or a branch overloading).
After detecting a technical problem, the second
step of the procedure consisted on iteratively
increasing the percentage of smart charging
adherents, in steps of 5%, while the dumb charging
and multiple tariff adherents percentage was
decreased accordingly, as explained in Figure 2.
First Iteration
• % of dumb charging adherents Æ 50%
• % of multiple tariff adherents Æ 50%
• % of smart charging adherents Æ 0%
Second Iteration
• % of dumb charging adherents Æ 47,5%
• % of multiple tariff adherents Æ 47,5%
• % of smart charging adherents Æ 5%
Third Iteration
• % of dumb charging adherents Æ 45%
• % of multiple tariff adherents Æ 45%
• % of smart charging adherents Æ 10%
E
tc
.
Figure 2: Flowchart of the steps followed for critical mass
estimation
The second step of the procedure was repeated
until the technical problems previously identified
were solved. In the end of the procedure, the
percentage of smart charging adherents that allowed
solving the problems detected (the critical mass of
smart charging adherents) was recorded.
The network used as case study for the critical
mass simulation was the MV network 1.
3 RESULTS AND ANALYSIS
3.1 Changes in Load Diagrams
The results presented in this subsection are referred
to the maximum percentages of EV that can be
safely integrated in the MV networks analysed, for
each charging strategy, as well as to the changes in
the weekly load diagrams verified. Due to space
restrictions, only charts for one of the networks
analysed will be presented (MV Network 1).
However, the results presented in this section can be
generalized for the remaining networks.
The maximum allowable EV integration
percentages in the MV Network 1 are depicted in
Figure 4. The percentages are relative to the total
number of conventional vehicles enclosed in the
geographical area covered by this network, which was,
in this case, 21135 vehicles. For the dumb charging,
multiple tariff and smart charging, the number of EV
that can be safely integrated in this network is,
respectively, 5072, 7186 and 11836, which correspond
to the percentages indicated in Figure 3.
0% 10% 20% 30% 40% 50% 60%
Dumb Charging
Multiple Tariff
Smart Charging
24%
34%
56%
Maximum EV Percentage
Figure 3: Maximum EV integration percentage in the MV
Network 1.
It is important to note that even when the smart
charging is considered, the continuous load growth
due to the increase of the EV integration provokes,
at a certain moment, at least one technical constraint
violation. In the case of the MV Network 1, the first
violation to occur was a branch overloading. The
technical violations detected in the all the networks
are presented in Table 4 and Table 5.
The EV power demand profile for the entire
week, in MW Network 1, for the three charging
strategies, is shown in Figure 4. When considering
the dumb charging strategy, the EV tend to charge
essentially at the end of the day, which is the time
period when people arrive home from work. In the
multiple tariff strategy, the EV owners tend to
charge their vehicles between 1h and 7h, which is
the period of time when the energy prices are
assumed to be lower. With the smart charging, the
EV are charged mostly during the night, as this is the
period when the EV availability is higher and the
demand is lower. These two facts combined, make it
possible to integrate a large number of EV in this
grid without causing any technical constraints
violations.
SMARTGREENS2012-1stInternationalConferenceonSmartGridsandGreenITSystems
94

0
5
10
15
20
25
30
35
40
Monday Tuesday Wednesday Thursday Friday Saturday Sunday
Power (MW)
Dumb Charging (25% EV) Smart Charging (57% EV) Multiple Tariff (35% EV)
Figure 4: EV load demand profiles in the MV Network 1.
Adding the EV load depicted in Figure 4 to the
conventional load of this network, makes it possible
to compute the total load diagrams for the three
charging strategies addressed, as presented in Figure
5. The load diagram for the scenario without EV
reveals a relatively constant pattern during the week
and the weekend days. A significantly large valley
period is notorious during the nights, while during
the days two small peaks are easily identifiable, one
occurring during lunch time and the other during the
evening.
0
20
40
60
80
100
120
140
160
Monday Tuesday Wednesday Thursday Friday Saturday Sunday
Power (MW)
Dumb Charging (25% EV) Without EV
0
20
40
60
80
100
120
140
160
Monday Tuesday Wednesday Thursday Friday Saturday Sunday
Power (MW)
Multiple Tariff (35% EV) Without EV
0
20
40
60
80
100
120
140
160
Monday Tuesday Wednesday Thursday Friday Saturday Sunday
Power (MW)
Smart Charging (57% EV) Without EV
Figure 5: Load profiles without and with EV (MV
Network 1).
In the scenario without EV, this network has a
peak load of 128.5 MW, which is incremented to
135.6 MW using the dumb charging, to 133.9 MW
using the multiple tariff and to 132.1 MW using the
smart charging. The latter can be considered an
outstanding achievement, since the peak load only
increased 3.6 MW with an EV integration of 57%,
representing ca. 12047 EV.
It is interesting to notice that the EV charging,
for the dumb charging and the multiple tariff,
provokes changes in the hour at which the networks’
peak load occurs. In the particular case of this
network, the peak load occurrence changes from 14h
to 19h of Thursday. For the smart charging, the hour
at which the peak load occurs remains unchanged.
In Table 2 is presented an overview of the
maximum EV integration percentage and the
correspondent absolute value of EV allowed in each
of the MV networks studied.
Table 2: Maximum EV allowed integration.
Dumb
Charging
Multiple
Tariff
Smart
Charging
MV Network 1
24%
(5072 EV)
34%
(7186 EV)
56%
(11836 EV)
MV Network 2
40%
(2081 EV)
57%
(2965 EV)
74%
(3850 EV)
MV Network 3
2%
(2193 EV)
4%
(4386 EV)
8%
(8771 EV)
MV Network 4
28%
(6090 EV)
24%
(5220 EV)
42%
(9135 EV)
MV Network 5
10%
(3416 EV)
5%
(1708 EV)
24%
(8197 EV)
From the results obtained, it can be observed that
the analysed systems can handle, up to a certain
level, the penetration of EV without concerns to the
networks’ infrastructures. However, it was verified
that the maximum number of EV that can be safely
integrated in the networks depends on the charging
schemes adopted by the EV owners. From the three
strategies analysed, smart charging yielded better
results in all the case studies addressed, as with it
was possible to reach higher EV integration levels
without violating the networks´ technical
restrictions, meaning that higher investments
deferral can be obtained. The dual tariff can be
classified as the second best strategy, as in three of
the five networks it attained better results than the
dumb charging.
The fact of the dumb charging yielding better
results than the multiple tariff in some of the
networks can be explained by the instantaneous
increase of the EV load verified around 1h when the
multiple tariff implemented. This occurs due to a
large number of multiple tariff adherents starting
their charging almost simultaneously. This load
increase might occur in specific locations of the grid,
where some grid components are already operating
very near their limits, provoking the occurrence of
technical violations.
THEMERGEPROJECT-ImpactsofElectricVehiclesontheDistributionSystemSteady-stateOperation
95

3.2 Feasibility of the Foreseen EV
Integration Scenario for 2020 and
2030
The purpose of this section is to evaluate the
feasibility of the foreseen EV integration scenarios
for 2020 and 2030, which were defined by the
MERGE partners in (Hasset et al., 2011).
In the referred deliverable of the project, three
possible EV penetration scenarios for the period
between 2010 and 2030 were defined. From the
three scenarios defined, the one recommended to be
used as reference by the MERGE partners was
scenario 2, as it is in-between a rather pessimistic
scenario and the most optimistic one. Following this
recommendation, and taking into account that the
networks analysed are Spanish, the values obtained
in scenario 2 for Spain were selected to be used as
comparison basis for the results presented in this
section.
The feasibility of the EV integration levels
defined for the years 2020 and 2030 was evaluated
as follows:
1) It was calculated the total number of EV that
are expected to be integrated in each of the
MV networks analysed, for 2020 and 2030.
These values were computed assuming that
the number of EV present in each network is
proportional to the number of conventional
vehicles enclosed in the networks’
geographical area.
2) Then, it was calculated the maximum number
of EV that can be safely integrated in the
analysed networks, with the different charging
strategies (as presented and discussed in
section 3.1).
3) Finally, it was performed a comparison
between the values obtained in steps 1) and 2).
The EV integration level forecasted is
assumed to be unfeasible if the values
obtained in step 1) are higher than those
obtained in step 2) and feasible otherwise.
All the results obtained are presented in Table 3.
The feasibility of the integration levels forecasted by
the MERGE partners, for each charging strategy, is
indicated by a cross.
As it can be seen, the only networks that are not
capable of coping with the EV integration levels
forecasted are the MV Network 3 and the MV
Network 5, for the year 2030, both due to branches’
overloading problems. While the MV Network 5
only presents problems when the dumb charging is
implemented, the MV Network 3 has some branches
overloaded with both dumb charging and multiple
tariff. The smart charging yields the best results,
since with it all the EV integration levels forecasted
are feasible.
Table 3: Feasibility of the foreseen EV integration
scenario for 2020 and 2030.
3.3 Impacts in the Voltage Profiles
Table 4 depicts, the voltage values obtained in the
worst bus of the networks analysed, when the
maximum allowable EV integration is reached. The
values presented are referred to the hour at which the
worst voltage conditions in the networks are
verified, which can be different from the hour of the
peak load.
Table 4: Voltage in the worst bus (p.u.).
Without
EV
Dumb
Charging
Multiple
Tariff
Smart
Charging
MV
Network 1
1.0238
(0% EV)
1.0235
(25% EV)
1.0228
(35% EV)
1.0234
(57% EV)
MV
Network 2
0.9460
(0% EV)
0.9295
(41% EV)
0.9306
(58% EV)
0.9310
(75% EV)
MV
Network 3
0.9721
(0% EV)
0.9715
(3% EV)
0.9721
(5% EV)
0.9704
(9% EV)
MV
Network 4
0.9866
(0% EV)
0.9853
(28% EV)
0.9866
(24% EV)
0.9848
(43% EV)
MV
Network 5
0.9722
(0% EV)
0.9705
(10% EV)
0.9722
(5% EV)
0.9712
(24% EV)
As it can be observed, with the exception of the
MV Network 2, the EV extra demand provokes
almost insignificant voltage drops when comparing
with the initial scenario (with no EV present in the
grids). It is important to recall that in MV networks
the R/X ratio is low, contrarily to LV networks, what
makes the impacts of the active power consumed by
EV less relevant regarding voltage drops. In
addition, as the majority of the MV networks studied
are from urban areas, they are more prone to
congestion problems than to undervoltage issues.
The voltage values attained for the MV Network
1, MV Network 3, MV Network 4 and MV Network
5 are within acceptable values, while for the MV
Network 2 they reach values near or even below the
minimum limit allowed (defined for these networks
as 0.93 p.u.).
From these results, it is possible to conclude that
the voltage lower limit is very likely the technical
SMARTGREENS2012-1stInternationalConferenceonSmartGridsandGreenITSystems
96

constraint that impedes a higher EV integration level
in the MV Network 2.
Although the voltage values regarding the use of
different charging strategies are presented in the
same table, for all the networks, it should be stressed
that they are referred to different scenarios of EV
integration. Thus, the only possible fact that can be
concluded from the values presented is that the
smart charging provides better results, as it is the
charging strategy that allows safely integrating a
larger number of EV in all the case studies
evaluated.
3.4 Impacts in the Branches
Congestion Levels
Differently to what was verified for the voltage
profiles, branches’ congestion levels were the most
critical aspect in the generality of studied networks,
with especially emphasis in the networks with urban
characteristics. Looking at Table 5, where the rating
percentage of the most congested branch of each
network is presented, it is possible to observe the
effects of the EV charging when the three different
charging methods are applied. The maximum rating
limit allowed was assumed to be 100%.
The results obtained show, in all the networks,
that the branches’ load levels considerably worsen
with the growth of the number of EV present in the
grids. In fact, branches overloading is the factor that
limits a further EV integration in the MV Network 1,
MV Network 3, MV Network 4 and MV Network 5.
The MV Network 2, besides having low voltage
problems, also presents branches’ overloading
issues.
Likewise to the voltage profiles, the rating
values presented in Table 5 for the different
networks are referred to different scenarios of EV
integration. Thus, the only possible fact that can be
concluded is that the smart charging provides better
results, as it is the charging strategy that allows
safely integrating a larger number of EV in all the
case studies evaluated. If it was considered a fixed
number of EV in the grids, the worst rating
percentage obtained with the smart charging would
be significantly lower than the value obtained with
the dumb charging and the multiple tariff.
The dumb charging strategy is the charging
scheme that accounts for the worst results in the MV
Network 1, MV Network 2 and MV Network 3,
while multiple tariff strategy accounts for the worst
results in the MV Network 4 and MV Network 5.
As referred previously, the worst results of the
multiple tariff obtained in the MV Network 4 and
MV Network 5, in comparison with the dumb
charging approach, might be explained by the
instantaneous increase of the EV load verified when
a large number of multiple tariff adherents start their
charging, almost simultaneously, in the beginning of
the lower electricity price period.
The location of the fast charging stations is also
a very important variable in what regards branches’
overloading, as the large amount of power absorbed
by these facilities might overload the branches
upstream. This problem has in fact occurred in the
MV Network 1 and MV Network 5, where the
branches overloading registered was due to EV
charging in the fast charging stations. For this
reason, it is advisable that the installation of a fast
charging station is always preceded by a detailed
impact study.
Table 5: Rating in the worst branch.
Without
EV
Dumb
Charging
Multiple
Tariff
Smart
Charging
MV
Network 1
96.5%
(0% EV)
100.0%
(25% EV)
101.6%
(35% EV)
100.4%
(57%
EV)
MV
Network 2
84.8%
(0% EV)
100.6%
(41% EV)
101.1%
(58% EV)
100.4%
(75%
EV)
MV
Network 3
97.9%
(0% EV)
101.7%
(3% EV)
101.0%
(5% EV)
101.3%
(9% EV)
MV
Network 4
79.1%
(0% EV)
100.1%
(28% EV)
102.4%
(24% EV)
100.5%
(43%
EV)
MV
Network 5
97.7%
(0% EV)
100.5%
(10% EV)
105.1%
(5% EV)
100.5%
(24%
EV)
3.5 Energy Losses
The weekly energy losses in the networks analysed,
for all the scenarios studied, are presented in Table
6. The first value presented in each cell is referred to
the absolute value of the losses, while the second is
relative to the ratio between the losses and the
overall energy consumption in the networks.
Table 6: Weekly energy losses (MWh) and Losses/Total
Energy (%).
Without
EV
Dumb
Charging
Multiple
Tariff
Smart
Charging
MV
Network 1
50.0
MWh
0.34%
(
0% EV
)
54.0 MWh
0.34%
(
25% EV
)
53.1
MWh
0.34%
(
35% EV
)
54.7
MWh
0.33%
(
57%
MV
Network 2
45.5
MWh
2.17%
(
0% EV
)
58.0 MWh
2.39%
(
41% EV
)
63.1
MWh
2.49%
(
58% EV
)
66.7
MWh
2.54%
(
75%
MV
Network 3
82.5
MWh
0.68%
(
0% EV
)
87.5 MWh
0.69%
(
3% EV
)
87.9
MWh
0.69 %
(
5% EV
)
92.4
MWh
0.68%
(
9% EV
)
MV
Network 4
50.6
MWh
0.40%
(
0% EV
)
54.3 MWh
0.39%
(
28% EV
)
53.0
MWh
0.39%
(
24% EV
)
54.6
MWh
0.39%
(
43%
MV
Network 5
465.9
MWh
1.72%
(
0% EV
)
483.1 MWh
1.75%
(
10% EV
)
471.9
MWh
1.73%
(
5% EV
)
497.3
MWh
1.77%
THEMERGEPROJECT-ImpactsofElectricVehiclesontheDistributionSystemSteady-stateOperation
97
A significant increase in the absolute value of
the weekly losses is easily identifiable when
comparing the scenarios with and without EV. As
the energy losses are directly proportional to the
square of the current, when the demand increases,
due to the EV charging, the current flowing along
the grids’ branches raises as well, provoking an
increase in the losses.
Although the absolute value of the energy losses
increases with the smart charging (due to a larger
EV integration), its relative value reveals that this
charging strategy is the one that yields best results in
the majority of the cases studied.
The adoption of the multiple tariff strategy could
also lead to some positive results. As it can be
observed, when comparing this strategy with the
dumb charging, it is possible to decrease losses
relative value in four of the analysed networks (MV
Network 1, MV Network 3, MV Network 4 and MV
Network 5), mainly due to the load valleys in the
load diagrams that occur between 1h and 7h. The
exception is the MV Network 2, where the valley
hours occur in the late afternoon, not coinciding with
the period when the majority of the multiple tariff
adherents charge their EV: between 1h and 7h.
Generally, the charging method that yields worst
results is the dumb charging, since it leads to the
occurrence of the highest peak loads, which,
expectably, lead to the higher increases in the energy
losses.
3.6 Critical Mass Analysis
The main goal of this study is to identify the
percentage of EV owners that need to adhere to the
smart charging in order to safely integrate a given
number of EV.
The first step of the methodology implemented,
as referred in section 2.3, consisted on the
consideration of an initial EV integration percentage,
of which one half of the EV were assumed to be
dumb charging adherents and the other half multiple
tariff adherents. Then, if problems were not detected
in the network, the EV integration percentage was
increased by 10 until a problem in the network was
detected. For the MV Network 1, used as test case,
the initial EV integration percentage assumed was of
10% and the first technical violation was detected
with a 30% EV integration.
The second step of the methodology consisted on
iteratively increasing the percentage of smart
charging adherents, in steps of 5%, while decreasing
the dumb charging and multiple tariff adherents
accordingly. This procedure was repeated until the
technical problems identified were solved. For the
case study under analysis, the percentage of smart
charging adherents that allowed solving the
problems detected – the critical mass – was of 45%.
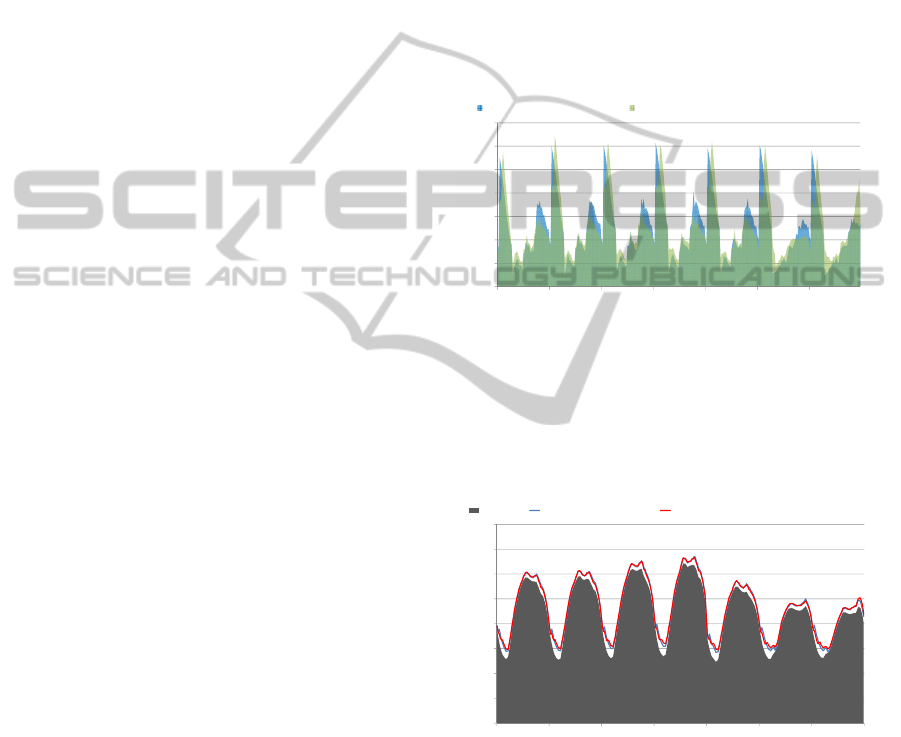
The differences between both scenarios referred
have a direct influence on the EV load profiles, as
presented in Figure 6. In the first scenario (in blue),
the EV power consumption has two daily peaks: one
in the late afternoon (due to dumb charging
adherents) and other during the first hours of the
night (due to multiple tariff adherents). When the
value of the smart charging adherents is incremented
to 45%, a decrease in EV power during the late
afternoon peak can be noticed.
0
2
4
6
8
10
12
14
Monda
y
Tuesda
y
Wednesda
y
Thursda
y
Frida
y
Saturda
y
Sunda
y
Power (MW)
50% Dumb + 50% Multiple Tariff 27.5% Dumb + 27.5% Multiple Tariff + 45% Smart Charging
Figure 6: EV load demand profiles in the MV Network 1
(30% EV).
In Figure 7 are depicted the load diagrams for
both cases studied. The peak load in the scenario
with 45% of smart charging adherents slightly
decreases, in comparison with the scenario with 50%
dumb charging and 50% multiple tariff.
0
20
40
60
80
100
120
140
160
Monda
y
Tuesda
y
Wednesda
y
Thursda
y
Frida
y
Saturda
y
Sunda
y
Power (MW)
Without EV 50% Dumb + 50% Multiple Tariff 27.5% Dumb + 27.5% Multiple Tariff + 45% Smart Charging
Figure 7: Load profiles without and with EV (MV
Network 1, 30% EV).
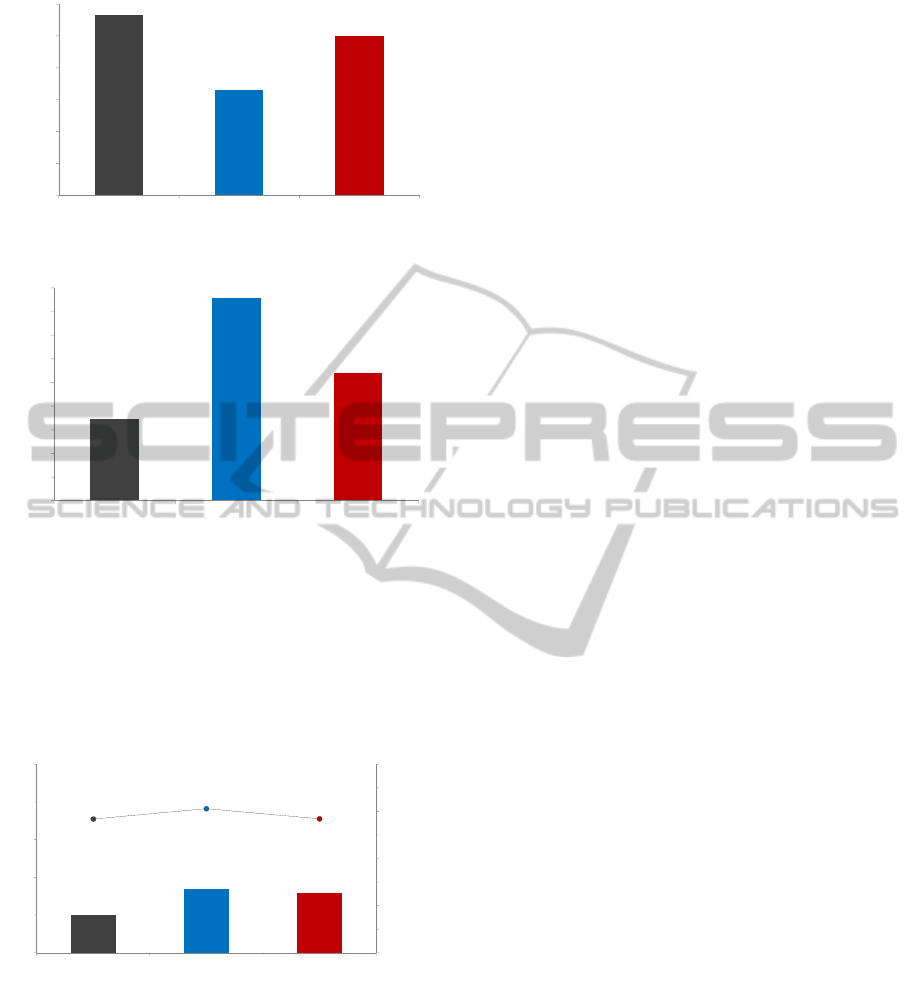
Figure 8, Figure 9 and Figure 10 show,
respectively, the voltages in the worst bus, the rating
in the worst branch and the weekly energy losses for
both scenarios simulated. As it can be noticed, the
increase in the number of smart charging adherents
yields benefits in all the indexes analysed.
As it can be seen in Figure 9, when considering
30% of EV integration, with 50% dumb charging
and 50% multiple tariff, there are some branches
SMARTGREENS2012-1stInternationalConferenceonSmartGridsandGreenITSystems
98
1.0238
1.0237
1.0238
1.0236
1.0236
1.0237
1.0237
1.0238
1.0238
1.0239
Without EV 50% Dumb + 50% Multiple
Tariff
27.5% Dumb + 27.5% Multiple
Tariff + 45% Smart Charging
Voltage (p.u.)
Figure 8: Voltage in the worst bus (30% EV).
96.5
101.6
98.4
93.0
94.0
95.0
96.0
97.0
98.0
99.0
100.0
101.0
102.0
Without EV 50% Dumb + 50% Multiple
Tariff
27.5% Dumb + 27.5% Multiple
Tariff + 45% Smart Charging
Rating (%)
Figure 9: Rating in the worst branch (30% EV).
already overloaded. The worst branch is 1.6% above
its maximum rated capacity. By incrementing the
share of smart charging adherents to 45% (critical
mass value), while decreasing both dumb and
multiple tariff adherents to 27.5 %, the worst branch
rating decreases to 98.4%, value within the allowed
limits.
50.0
53.5
52.9
0.34
0.34
0.34
0.28
0.29
0.3
0.31
0.32
0.33
0.34
0.35
0.36
45
50
55
60
65
70
Without EV 50% Dumb + 50% Multiple
Tariff
27.5% Dumb + 27.5% Multiple
Tariff + 45% Smart Charging
Losses / Total Energy (%)
Losses (MWh)
Figure 10: Weekly losses (30% EV).
A rather obvious assumption about the critical
mass is that its value is expected to increase as the
number of EV connected to the grid raises. In order
to prove it, a second scenario with a higher EV
integration (40%) was analysed. This EV integration
level leads to a considerable aggravation of the
branches congestion levels. The worst branch is ca.
10% above its maximum rated capacity, against the
1.6% verified in the previous case (with 30% of EV
integration). Under these conditions, the worst
branch rating can only be decreased to acceptable
values if the smart charging adherents’ percentage
reaches 60% (critical mass value). As expected, this
result proves that the critical mass increases as the
EV integration level rises.
4 CONCLUSIONS
By analysing the results obtained from the steady-
state simulations performed in the MERGE project,
it was possible to verify that the magnitude of the
EV impacts are influenced by several factors, like
the EV integration level, the EV owners’ behaviour,
mobility patterns, the networks’ load profiles and
technical characteristics, the number and location of
fast charging stations in the grid and the EV
charging modes, among others. These factors have
been carefully analysed, being possible to reach
some important conclusions.
The analysed systems can handle, up to a certain
level, the penetration of EV without concerns to the
networks’ infrastructures. However, it was verified
that the maximum number of EV that can be safely
integrated in the networks depends on the charging
schemes adopted by the EV owners. From the three
strategies analysed (dumb charging, dual tariff
charging and smart charging), smart charging
yielded better results in all the case studies
addressed, since it was possible to reach higher EV
integration levels without violating the networks´
technical restrictions.
In what regards the EV impacts in networks with
different topologies, some important conclusions
were also attained. Concerning urban networks, as
they are usually composed by short lines and are
subjected to high power demand levels, they are
very likely to face branch/transformer overloading
problems faster than voltage drop issues. The results
presented in this report prove this fact, as overload
problems were identified in all networks studied
with urban topologies. Differently from urban
networks, rural networks have usually long radial
lines, which provoke considerable voltage drops.
Thus, low voltage problems are expected in these
grids, namely in the buses farthest from the feeding
points. The results obtained prove this fact, as low
voltage problems were only detected in the rural
network analysed.
The extra power demanded by EV also provokes
several changes in the networks’ load diagrams,
which are more pronounced as the EV integration
level rises. Nevertheless, the analysis performed
THEMERGEPROJECT-ImpactsofElectricVehiclesontheDistributionSystemSteady-stateOperation
99

allows concluding that it is impossible to generalise
results in a rigorous manner, as the changes induced
in the load diagrams depend of a large number of
factors that are different from network to network.
The location of the fast charging stations should
be carefully analysed, as they might provoke severe
voltage violations or branches overloading, due to
the large amount of power that they may consume
when in full operation. In fact, the studies performed
have demonstrated that the overload problems
identified in two of the studied networks were likely
provoked by the power consumed in fast charging
stations.
As it happened with the load diagrams, the
simulations performed for the critical mass allow
concluding that it is impossible to generalise results
in a rigorous manner. From the analysis of the
results obtained, it is only possible to conclude that
the critical mass, besides being dependent of the
network considered, increases with the EV
integration level.
In what regards the feasibility of the forecasted
EV integration scenario for 2020 and 2030, it was
possible to conclude that, independently of the
charging strategy adopted, no relevant problems in
the MV networks are expected to occur until 2020.
Conversely, in 2030, several problems are expected
to arise, namely if dumb charging or dual tariff
approaches are adopted. However, as results
presented in section 3.2 show, the forecasted
problems may be entirely solved if the smart
charging is implemented on a large scale.
From the results obtained with the steady-state
analysis performed within the MERGE project, it is
clear that the path to safely integrate large quantities
of EV in distribution networks, without making
large investments in grid reinforcements, is to
implement mechanisms that allow managing the EV
charging not only taking into account their owners’
requests, but also the networks’ technical
restrictions. Nevertheless, it should be remarked that
the adherence to these controlled charging schemes
will ultimately be always a decision of the EV
owners. Thus, it is of utmost importance to timely
define and implement adequate incentives’ policies,
attractive enough to make EV owners willing to
participate in such controlled charging schemes.
ACKNOWLEDGEMENTS
This work was supported in part by Fundação para a
Ciência e Tecnologia under Grants
SFRH/BD/48491/2008 and SFRH/BD/47973/2008
and by the European Union within the framework of
the European Project MERGE – Mobile Energy
Resources in Grids of Electricity, Contract 241399
(7th Framework Programme).
REFERENCES
Bower, E. T., Lopes, J. A. P., Soares, F. J., Rua, D.,
Hatziargyriou, n., Strunz, K. & Ferdowsi, m. 2011.
Initial findings of ‘merge’ (mobile energy resources in
grids of electricity). JSAE EVTeC’11. Japan.
Hasset, B., Bower, E. & Alexander, M. 2011. Evaluation
of the impact that a progressive deployment of EV will
provoke on electricity demand, steady state operation,
market issues, generation schedules and on the volume
of carbon emissions Deliverable D3.2 of the European
Project MERGE.
Lopes, J. A. P., Soares, F. J. & Almeida, P. M. R. 2011.
Integration of Electric Vehicles in the Electric Power
System. Proceedings of the IEEE, 99, 168-183.
Rosa, M., Issicaba, D., Gil, N., Soares, F. J., Almeida, P.
M. R., Moreira, C., Ribeiro, P., Heleno, M., Ferreira,
R., Sumaili, J., Meirinhos, J., Seca, L., Lopes, J. A. P.,
Matos, M., Soultanis, N., Anestis, A., Karfopoulos, E.,
Mu, Y., Wu, J., Ekanayake, J. & Narayana, M. 2011.
Functional Specification for Tools to Assess Steady
State and Dynamic Behaviour Impacts, Impact on
Electricity Markets and Impact of High Penetration of
EV on the Reserve Levels. Deliverable D2.2 of the
European Project MERGE, .
Sánchez, C., Gonzalez, A., Rosa, M., Ferreira, R., Cabral,
P., Batista, F., Issicaba, D., Gil, N., Moreira, C.,
Ribeiro, P., Diaz-Guerra, B., Papadopoulos, P., Grau,
I., Voumvoulakis, E., Zountouridou, E., Karfopoulos,
E., Bourithi, Ferdowsi, M. & Abbasi, E. 2010.
Scenarios for the evolution of generation system and
transmission, distribution grid evolution requirements
for different scenarios of EV penetration in different
countries. Deliverable D3.1 of the European Project
MERGE.
SMARTGREENS2012-1stInternationalConferenceonSmartGridsandGreenITSystems
100
