
A STEREO LINE SENSOR SYSTEM TO HIGH SPEED
CAPTURING OF SURFACES IN COLOR AND 3D SHAPE
Trendafil Ilchev
1
, Erik Lilienblum
3
, Bernd Joedicke
2
, Bernd Michaelis
3
and Markus Schnitzlein
1
1
Chromasens GmbH, Max-Stromeyer-Straße 116, 78467 Konstanz, Germany
2
Hochschule Konstanz, University of Applied Sciences, Brauneggerstr. 55, 78462 Konstanz, Germany
3
Otto von Guericke University Magdeburg, Institute for Elektronics, Signalprocessing and Communications (IESK,) Chair
Technical Computer Science, PO Box 4120, 39016 Magdeburg, Germany
Keywords: Stereo Vision, Line Scan Camera, 3D Measuring Technology, Color.
Abstract: Line scan cameras offer very high spatial resolution, allowing even multispectral color acquisition and are
therefore often used for quality control at the conveyor belt. A logical extension is to complement the broad
spectrum of the missing channel depth data. For industrial use, the technology combines the advantages of
customized cameras with proven 3D evaluation methods which are known from 3D-matrix camera systems.
The present system allows the rapid and simultaneous detection of color and 3D depth with small random
errors, preferably relatively flat (not fissured) surfaces. Standard deviation of 10 microns could already be
realized in practice. Color and 3D data are from the same measurement system and are in exactly the same
coordinate system. This can be a significant advantage in quality assurance, such as testing manufactured
goods to a good match of form and texture. The use of massively parallel hardware (GPUs) currently allow
performance of approximately 100 million disparity values per second.
1 INTRODUCTION
Procedures for non-contact optical surface
measurement of three-dimensional objects are
becoming increasingly important. There exists a
wide range of applications to detect the surface
shape and detection of surface defects, which is
covered by a variety of different methods
(Nalpantidis, Sirakoulis and Gasteratos, 2007).
Important system parameters, especially for
applications in industrial manufacturing process are
the speed and resolution of the 3D survey in relation
to the size of the surface to be detected. In this
regard, the established measurement methods based
on matrix cameras often cannot meet the relevant
system requirements.
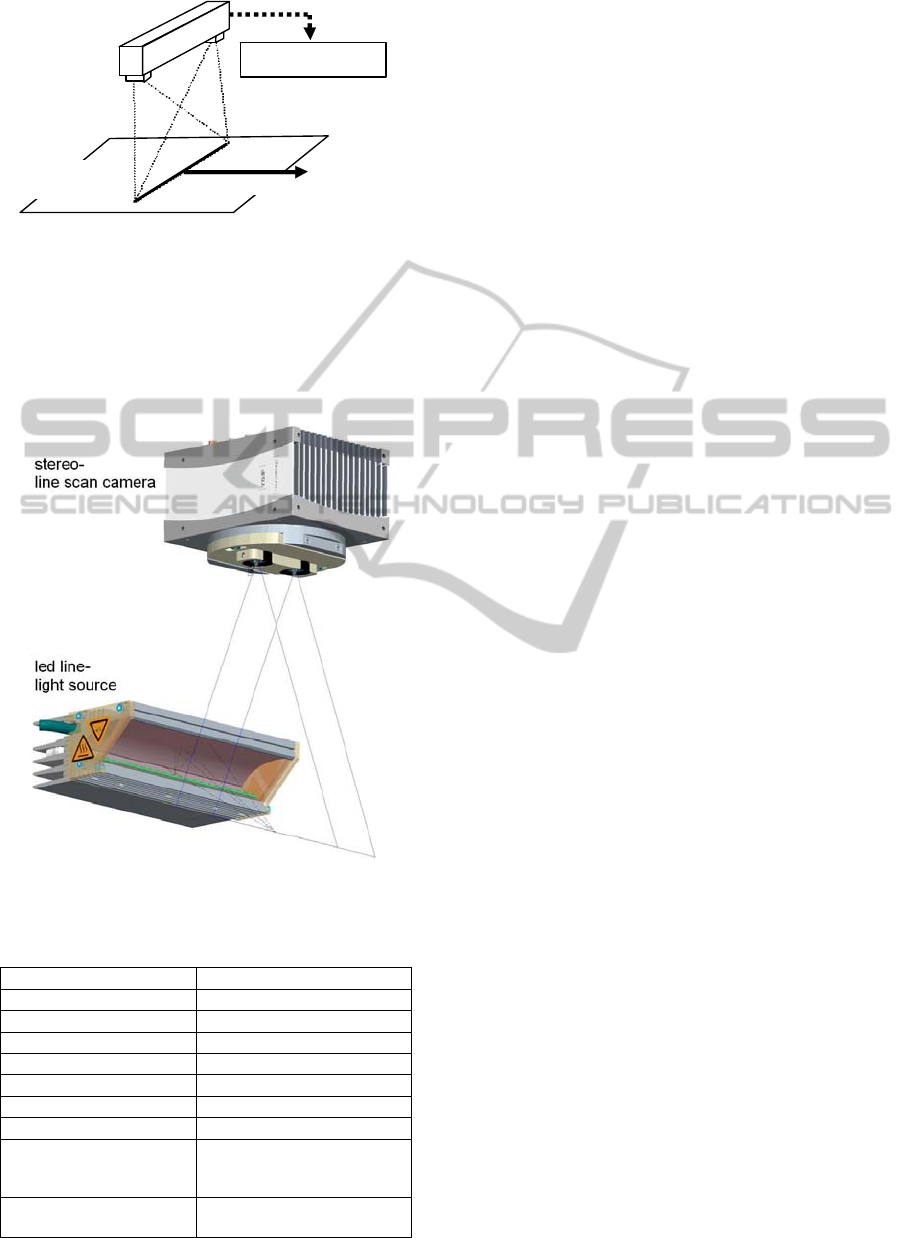
By using line sensors we propose a new method
to increase significantly the speed and resolution of
the optical and 3D measurement for special
applications. The hardware for image acquisition
essentially consists of two coplanar oriented tree
linear line scan cameras, which generate a
continuous stream of stereo RGB color lines. The
system is based on a stereoscopic recording of the
original surface. Based on texture, the two images
are correlated and the corresponding altitude
information is captured (Figure 1). The altitude
measurement precision is in the region of 1/5-1/10
of the object pixel. The software calculates a colored
3D surface reconstruction with high spatial
resolution. The algorithm for computing the colored
3D point cloud is implemented in CUDA and runs in
real time on multiple GPUs simultaneous with the
image acquisition (Calow and Ilchev, 2010).
2 DEMO SETUP
The new approach was first successfully tested by
simulations. On this basis a real stereo line-scan
camera is designed and realized as a demonstrator of
the technology. The camera on the top of the demo
setup (Figure 2) works like a scanner. The objects to
measure are placed on a height adjustable stage
underneath the camera. The linear unit moves the
stage forward and the camera acquires the images
during the movement.
Based on the acquired images the calculation of
the 3D object surface is carried out. The result of the
809
Ilchev T., Lilienblum E., Joedicke B., Michaelis B. and Schnitzlein M..
A STEREO LINE SENSOR SYSTEM TO HIGH SPEED CAPTURING OF SURFACES IN COLOR AND 3D SHAPE.
DOI: 10.5220/0003941508090812
In Proceedings of the International Conference on Computer Graphics Theory and Applications (IVAPP-2012), pages 809-812
ISBN: 978-989-8565-02-0
Copyright
c
2012 SCITEPRESS (Science and Technology Publications, Lda.)
stereo scan
s
y
stem
measured
shape
3D+colour
linear
scan movement
Figure 1: Schematic diagram of the overall scan system.
3D calculation is shown as a texture images, depth
map in false color and as a 3D view (Figure 4). The
3D data and the color images can be saved for
further processing. This demo setup may be used as
well for real application. Table 1 summarizes the
data with a potential application of this camera.
Figure 2: CAD model of the image acquisition stereo
system.
Table 1: Example of an application.
Features Example of an application
Scan width 150 mm
Scan range continuous
Scan speed up to 1,38 m/s (22000 lines/s)
Height range 10 mm
Resolution lateral 0.063mm
Resolution axial 0.020 mm
Color 24 bit (RGB)
Duration of image
acquisition and 3D
calculation
continuous
Performance of the 3D
computation
approximately 100 million
disparity/s
3 DESCRIPTION OF THE WORK
The establishment, adjustment and calibration of the
measuring system is done offline. Targets can then
be measured online, keeping pace with the
movement. The image data of the trilinear color line
scan cameras are first rectified, correcting the color
channels red, green and blue, so that they lie exactly
above one another in both camera images.
Corresponding points between the camera images
are provided in a picture line (epipolar constraint).
The resulting image is buffered for later texturing of
the 3D surface. Subsequently, the pixel by pixel
mean values of red, green and blue channels are
calculated to obtain a rectified gray-scale image with
a lower temporal noise for each camera.
The rectified greyscale images serve as the basis
for the ensuing correlation method for searching
corresponding points. The displacement of the
corresponding points will be delivered in the form of
a disparity map. It is approximately inversely
proportional to the distance of the object point to the
camera system. The disparity maps contain either
the measured disparity or an appropriate error status,
if no disparity was found for a given pixel position.
The previously buffered color image and the
disparity maps are positioned accurately over one
another. For many applications, such a disparity or
depth map is already sufficient. From the disparity
maps a textured 3D point cloud can be calculated
and presented in an OpenGL window from different
views. The whole procedure is implemented using
ring buffers, allowing streaming mode, e.g. a
continuous processing. The search for corresponding
image points (disparity calculation) and the 3-point
calculation of the depth maps is done in blocks and
parallel on currently available graphics cards
(GTX285 or GTX485). The code was created in the
CUDA development environment. CUDA SDK
allows to program in C-like programming style.
However, certain conditions must be considered so
that the code can be efficiently executed on the GPU
(Calow and Ilchev, 2010).
4 CAMERA MODEL AND
CALIBRATION
For the recording the color information a trilinear
line sensors are used. A standard matrix camera
model was used for the modelling of each line scan
camera. Only the three middle lines from the matrix
camera model (corresponding to the three color
IVAPP 2012 - International Conference on Information Visualization Theory and Applications
810

channels red, green and blue) were used for the
calculations. The relative position of both cameras to
each other is assumed to be constant during the
measurement. The movement of the whole camera
head is represented by a 4x4 homogeneous
transformation matrix for each line. A linear model
to calculate the motion of the 4x4 transformation
matrix of each image line is used for the application
of the camera head combined with a linear unit.
This approach allows great flexibility, both in
describing the optical properties of the cameras as
well as in modelling the trajectories of the camera
head. On the other hand it gives rise to two new
problems. The calculation of the projection of a
point in space in the line scan camera system
(function "World2Pix") is complicated. Secondly,
the number of camera parameters is comparatively
high and the determination in the part of a
calibration is possible only under the assumption of
additional boundary conditions. A precise
calculation of each individual camera parameter is
not required in practice, if consistency of all
parameters of the whole system can be achieved.
One possible strategy, for example, is not to
introduce all parameters simultaneously into the
equation system, but gradually, respectively
alternately.
The calibration is done by recording an
optimized calibration body from several directions.
Twenty-eight-coded circuit marks are printed on the
calibration chart. Three of them are positioned on a
raised stamp. The hierarchical search for the circle
marks starts in a lower resolution. After finding the
brand position of the marks, the precise re-
measurement is performing with original resolution.
(0.02 pixels accuracy possible). The search is
performed separately in each color channel, because
in a trilinear line camera, the color channels do not
overlap. Thus a much larger number of observations
can be generated. From those measurements we
determine the parameters of interior and exterior
orientation of the cameras and some parameters of
the movement of the camera head by linearization
(numerical differentials) and compensation
calculation iteratively. Good initial values are
necessary for determining the system parameters,
which can be extracted from the CAD data (Calow
and Ilchev, 2010).
5 CORRELATION METHOD
The three lines of trilinear color line scan cameras
record an object point in time one after the other,
resulting in a misalignment between the three color
channels of the raw images. This offset is visible as
colored edges on light-dark transitions. The size of
the offset depends on the ratio of speed to the line
frequency. Given a known trajectory, the scan offset
is calculable from the calibration data, and can be
directly corrected by re-sampling of the three color
channels. Thus re-sampling ensures that
corresponding points between the left and right
camera are almost in a row (rectification), so that the
search for corresponding points in only one line (one
dimension) must be done. In order to perform
rectification efficiently, the necessary sample points
are calculated using the offline calibration data, and
are then pre-stored in tables. For noise reduction and
a simultaneous reduction of the search effort for the
correlation, only gray-scale images from the average
of all three color channels are used. Due to very
good experience in terms of accuracy, contrast and
illumination invariance, the normalized cross-
correlation coefficient (5.1) was used as similarity
criterion (Calow and Ilchev, 2010).
()
()
[]
()
()
∑∑
∑
==
=
−⋅−
−⋅−
=
N
i
i
N
i
i
N
i
ii
bbaa
bbaa
k
1
2
1
2
1
(5.1)
N – Number of pixels of the image block to be
compared
a
i
, b
i
- Gray values of one and the other camera
image
ܽ
, ܾ – Mean values of one and the other camera
image
For each pixel position of the maximum cross-
correlation quotient the observed disparity on this
position will be saved. The data is stored in a ring
buffer, so that it can be accessed not only on the
maximum correlation, but also on the correlation
values of the previous and successor disparity.
Correlation maximum from his predecessors and
successors can help to achieve sub-pixel accuracy by
fitting a parabola, if the surface gradients (relative to
the receiving direction) are small (Mecke, 1999).
6 EXAMPLES
Some objects scanned with the measurement setup
are shown below. The examples have enough texture
so that the correlation of the stereo image provides a
unique result. Initial investigations of the
A STEREO LINE SENSOR SYSTEM TO HIGH SPEED CAPTURING OF SURFACES IN COLOR AND 3D SHAPE
811
reproducibility, in a series of 20 measurements of a
plane object, showed a standard deviation of less
than 10 microns at a resolution of the optical system
of 65 microns per pixel.
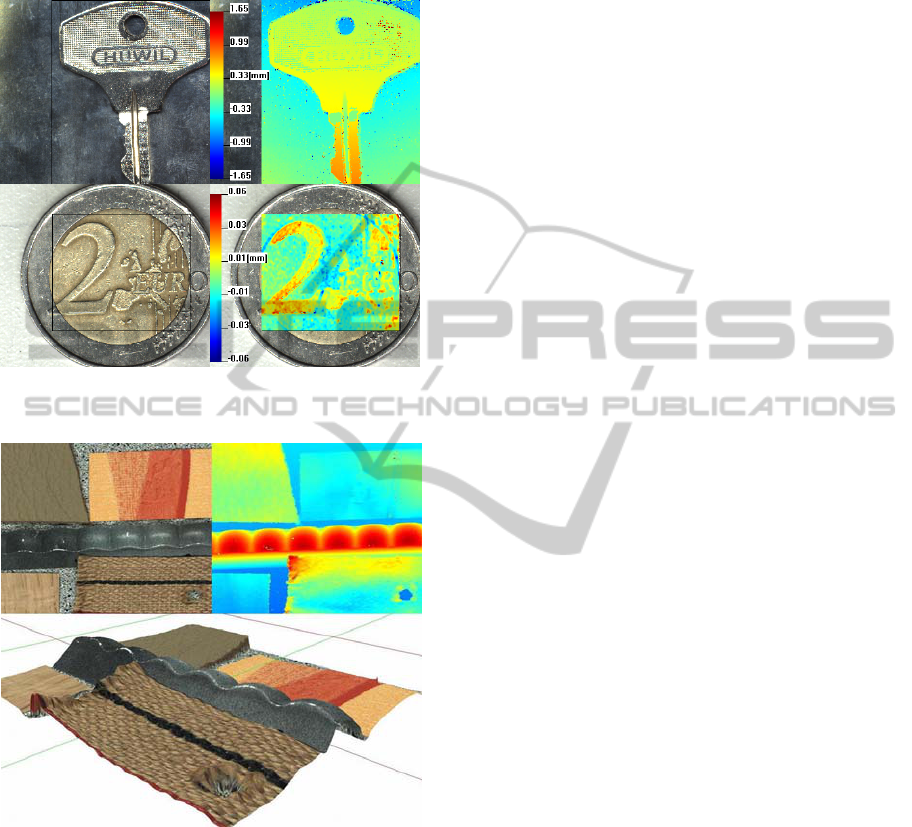
Figure 3: Examples of height differences, which can be
resolved by the system.
Figure 4: These examples show some materials (leather,
synthetic material, wood, textiles, etc.) that can be
measured with the method. In the last image is shown the
merged result of texture and height data.
REFERENCES
Nalpantidis, L., Sirakoulis, G. C., Gasteratos, A., 2007.
Review of Stereo Algorithms for 3D Vision.
International Symposium on Measurement and
Control in Robotics. ISMCR.
Calow, R., Ilchev, T., 2010. Schnelles Zeilensensorsystem
zur gleichzeitigen Erfassung von Farbe und 3D-Form.
In Forum Bildverarbeitung, Hrsg. Karlsruhe: KIT
Scientific Publishing. P. 181–192.
Mecke, R., 1999. Grauwertbasierte Bewegungsschatzung
in monokularen Bildsequenzen unter besonderer
Beruecksichtigung bildspezischer Stoerungen.
Dissertation, Shaker Verlag GmbH.
IVAPP 2012 - International Conference on Information Visualization Theory and Applications
812
