
VIS4AUI: VISUAL ANALYSIS OF BANKING ACTIVITY
NETWORKS
∗
Walter Didimo, Giuseppe Liotta and Fabrizio Montecchiani
D.I.E.I., Universit
´
a degli Studi di Perugia, Via Duranti 93, Perugia, Italy
Keywords:
Information Visualization, Network Analysis, Graph Drawing, Clustering, Social Network Analysis, Multi-
touch User Interfaces.
Abstract:
We present the system VIS4AUI, aimed at supporting the analyst to discover financial crimes related to money
laundering. An anti-money laundering archive collects financial information with regard to ongoing bank re-
lationships and high value transactions. VIS4AUI is able to import and analyze the Italian anti-money laun-
dering archive (AUI) in order to visualize the banking activity networks arising from it. In the demonstration,
the user will be given an evidence of a possible suspicious person or company; starting from such a seed
entity, the task will be that of exploring and analyzing her network of transactions through the tools provided
by the system. In order to immerse the user in a fully interactive experience, VIS4AUI is a touch-optimized
application, only requiring a touchscreen as interface.
1 INTRODUCTION
Money laundering is a well-known kind of financial
crime based on relevant volumes of transactions to
conceal the identity, the source, or the destination of
illegally gained money. These transactions are con-
ceived to give the illegally gained capitals a licit sem-
blance, making their origin difficult to identify. To
face this problem, most governments have created
special investigation agencies, called Financial Intel-
ligence Units (FIUs), whose main objectives are to
defend the integrity of worldwide financial markets
and to prevent them from organized crimes that could
undermine the homeland security.
VIS4AUI is a system started from a proof of
concept implementation described in (Didimo et al.,
2011), and successively engineered by the academic
spin-off Vis4
2
, thanks to a close collaboration with
the FIU of the Republic of San Marino (AIF - Agenzia
di Informazione Finanziaria)
3
. VIS4AUI can import
and analyze the anti-money laundering archive col-
lected by Italian banks, named AUI (Archivio Unico
Informatico). The AUI archive holds financial data
with regard to ongoing bank relationships and trans-
actions involving amounts exceeding EUR 15,000.00.
∗
Thanks to the programming team of Vis4 for the great
job done in the last year.
2
http://www.vis4you.com/
3
http://www.aif.sm
These data can be modelled as social networks whose
nodes represent persons and companies and whose
links represent their relationships, see Figure 1. It
is widely accepted that the exploration of such net-
works to discover criminal patterns strongly bene-
fits from a strict integration of social network anal-
ysis (SNA) and visualization tools (Didimo and Li-
otta, 2007; Tang et al., 2010; Westphal, 2009; Xu and
Chen, 2005).
2 THE SYSTEM VIS4AUI
In order to collect the system requirements we coop-
erated with analysts of the Republic of San Marino
AIF. One important issue is that the system is not re-
quired to discover criminal patterns by itself, but it is
mainly intended by the analyst as a strong support for
the investigation activity. For this reason, the system
must provide strong interaction, conceived for semi-
automatic solutions.
The development of advanced methodologies and
software systems for the analysis of criminal net-
works has received increasing attention after the
September 11 terrorist attacks, see, e.g., (Chang et
al., 2008; Tang et al., 2010; Klerks and Smeets, 2001;
Goldberg and Senator, 1995; Chen et al., 2005; Stasko
et al., 2008). A survey on these systems is presented
by Xu and Chen (Xu and Chen, 2005).
799
Didimo W., Liotta G. and Montecchiani F..
VIS4AUI: VISUAL ANALYSIS OF BANKING ACTIVITY NETWORKS.
DOI: 10.5220/0003933407990802
In Proceedings of the International Conference on Computer Graphics Theory and Applications (IVAPP-2012), pages 799-802
ISBN: 978-989-8565-02-0
Copyright
c
2012 SCITEPRESS (Science and Technology Publications, Lda.)
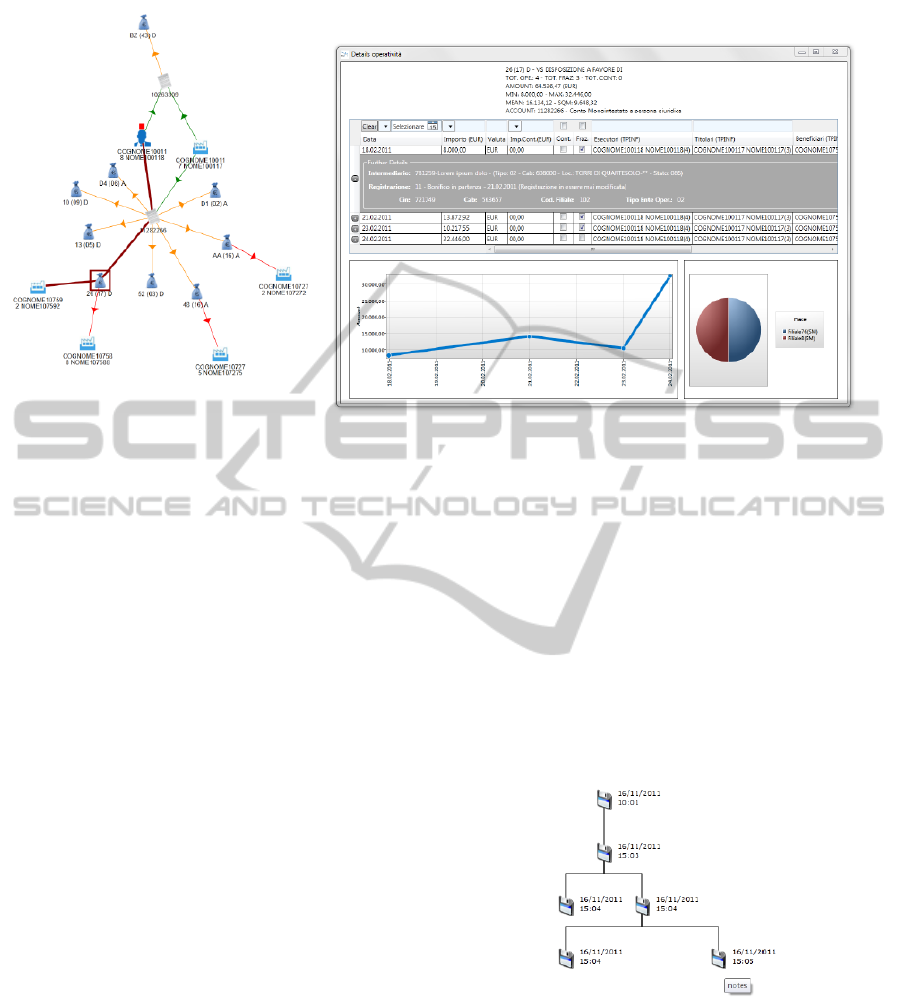
Figure 1: A bank activity network drawn by VIS4AUI. The near window shows some details about a subset of transactions
involved in the network.
In the remainder of this section we summarize the
main features of VIS4AUI; see (Didimo et al., 2011)
for further details on the algorithmic aspects of the
system.
2.1 Exploring and Analyzing the
Network
The financial networks to be analyzed are automati-
cally drawn by the system using a customized force-
directed algorithm, which is able to handle position
constraints and clusters. We recall that force-directed
algorithms have been introduced by Eades (Eades,
1984) and received a lot of attention both in the graph
visualization literature and in the implementation of
industrial software, see, e.g., (Fruchterman and Rein-
gold, 1991; Chen et al., 2005). The basic idea of a
force-directed algorithm is to model the network as a
physical system: Different kinds of forces are exerted
on each node, and the final placement of all nodes
in the visualization will correspond to an equilibrium
status of the physical system.
In VIS4AUI, the visual exploration of the finan-
cial networks is supported by a combination of a
bottom-up and of a top-down interaction paradigm.
With the former one the analyst can start from a sem-
inal node and iteratively enhance the network with
new elements by adding neighbours of the displayed
nodes. With the latter one the analyst can use hier-
archical clustering to recursively aggregate elements
on the whole network currently displayed. Each clus-
ter can be collapsed or expanded independently at any
time, so that the analyst can simplify the visual infor-
mation at her convenience. These two kinds of inter-
action paradigms can be alternated while maintaining
consistency.
Moreover, VIS4AUI makes it possible to mix au-
tomatic and manual clustering, and is equipped with
several tools for social network analysis other than
clustering, like different types of indices to measure
the centrality of each actor in the network.
Finally, the intelligence process is also supported
by a powerful saving system, which allows the user to
revert to any previous save and to create a new branch
of saves on the time-line (see Figure 2).
Figure 2: A tree of saves related to an investigation.
2.2 Interface and Interaction
Here we describe the interface and interaction of
VIS4AUI in more details. The user interface of
VIS4AUI is touch-optimized, hence every interac-
tion described below can be performed using either
a mouse or a touchscreen.
The analyst can start a new investigation from a
desired seed entity (e.g., a person or a company),
IVAPP 2012 - International Conference on Information Visualization Theory and Applications
800
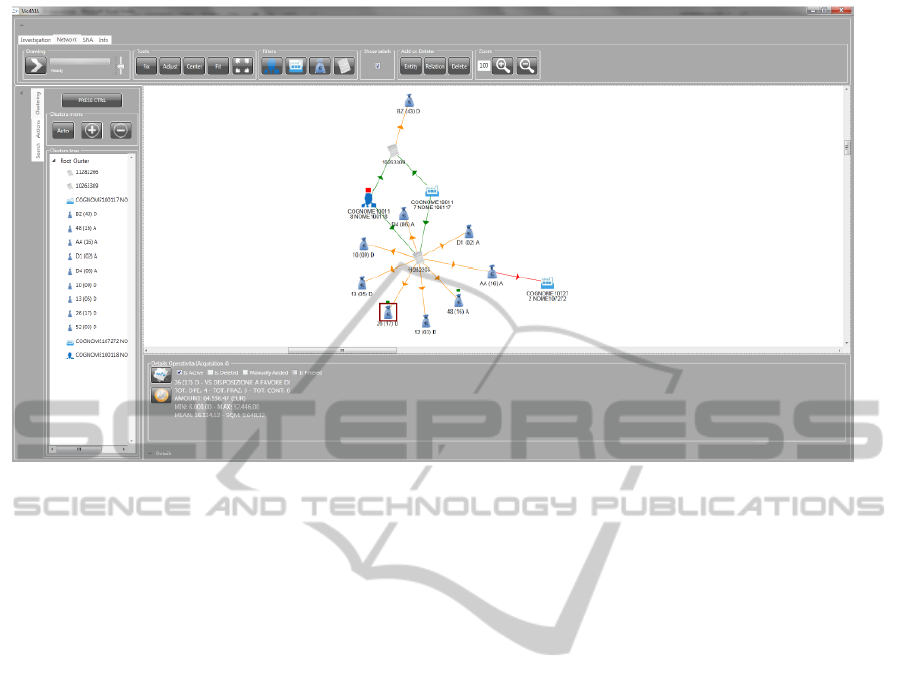
Figure 3: The main window of VIS4AUI.
searching in the database accessed by VIS4AUI. At
the beginning only the seed entity and its adjacent
nodes are displayed. The analyst can then explore
and elaborate on the network with different interac-
tive tools:
Bottom-up Exploration. The set of nodes and
edges can be incrementally enhanced by exploring
some of the displayed entities. By double clicking or
double tapping a node, all of its neighbours and their
connections are added to the current network, if not
already shown. A new layout is automatically com-
puted according to the status of the previous network,
which depends on the presence of cluster regions or
other types of geometric constraints. If the previous
drawing contained a hierarchy of cluster regions, ev-
ery node that enters in the new network is automati-
cally assigned to a suitable cluster region according to
a criterion aimed at keeping the coherence of the clus-
tering. A small green box over a node indicates that
such a node has not been explored yet; this avoids the
analyst to repeat the same exploration action twice.
Top-down Exploration. The analyst can ask the
system to automatically compute a cluster hierarchy
on the current network. This action will group nodes
into clusters and sub-clusters according to some spe-
cific algorithm. Our current clustering algorithm ex-
ploits the concept of k-core, which has been proven to
be effective for discovering relevant groups in social
networks, see, e.g., (Batagelj et al., 1999; Dorogovt-
sev et al., 2005; Goltsev et al., 2006; Seidman, 1983).
However, different types of clustering algorithms can
be easily plugged in the system. Once a cluster hi-
erarchy has been computed, the system decides the
initial dimensions of each cluster region based on the
number of nodes inside it. In the layout, the boundary
of each cluster region is displayed as a rectangle. To
help the analyst in capturing the structure of the clus-
ter hierarchy, the corresponding cluster inclusion tree
is also displayed on the left-hand side of the interface.
VIS4AUI offers various interaction facilities with the
clusters and their regions. The analyst can drag nodes
inside or outside a cluster region, so modifying its
associated cluster. She can move a cluster inside or
outside another cluster, so modifying the cluster hi-
erarchy. She can create new clusters or delete some
of the existing ones. She can collapse or expand a
cluster region, so to hide/show its interior. The draw-
ing algorithm will react at each user’s change in order
to rearrange the layout. The analyst can also resize
each cluster region at her convenience with the same
kind of interaction used to resize a window in a classi-
cal operating system graphical user interface, that is,
dragging the boundary of the cluster. Resizing clus-
ters acts as a focus+context technique with multiple
foci.
Node Centrality. VIS4AUI implements a wide
range of indices for measuring the centrality of a
node, like betweenness, closeness and degree. The
value of a specific type of index is conveyed in the
layout by displaying a small disk near to its associated
node, the color of the disk reflect the value in a scale
from white to black. The analysts can quickly switch
from the visualization of a type of index to another
and all indices are normalized so that they can be eas-
VIS4AUI: VISUAL ANALYSIS OF BANKING ACTIVITY NETWORKS
801

Figure 4: A clustered network with one collapsed cluster.
ily compared. We remark that centrality indices make
sense only for nodes representing the actors of the net-
work, like persons, companies, and banks. Hence, in
order to compute the centrality of these actors, we run
the algorithm on a different suitable network consist-
ing only of actors. Namely, we add an edge between
two actors if the length of the shortest path between
them is at most d (for a pre-set constant d), and then
we remove all nodes that are not actors.
3 DEMO PROPOSAL
The database of the system will be loaded with an
anonymized anti-money laundering archive. In the
demonstration, the user will be given an evidence of a
possible suspicious person or company. An evidence
can be for example a set of suspicious transactions
made by a person or by a company. Starting from this
seed entity, the task will be that of exploring and ana-
lyzing the related network using the tools provided in
the system. User’s impressions and comments will be
recorded by means of an interview.
Figure 5: A user interacting with VIS4AUI by a touch-
screen.
REFERENCES
Batagelj, V., Mrvar, A., and Zaver
ˇ
snik, M. (1999). Par-
titioning approach to visualization of large networks.
In GD 1999, volume 1731 of LNCS, pages 90–97.
Chang et al., R. (2008). Scalable and interactive visual anal-
ysis of financal wire transactions for fraud detection.
Information Visualization, 7(1):63–76.
Chen, H., Atabakhsh, H., Tseng, C., Marshall, B., Kaza,
S., Eggers, S., Gowda, H., Shah, A., Petersen, T., and
Violette, C. (2005). Visualization in law enforcement.
In CHI, pages 1268–1271. ACM.
Didimo, W. and Liotta, G. (2007). Mining Graph Data,
chapter Graph Visualization and Data Mining, pages
35–64. Wiley.
Didimo, W., Liotta, G., Montecchiani, F., and Palladino, P.
(2011). An advanced network visualization system for
financial crime detection. In PacificVis, pages 203–
210. IEEE.
Dorogovtsev, S. N., Goltsev, A. V., and Mendes, J. F. F.
(2005). k-core organization of complex networks.
CoRR, abs/cond-mat/0509102.
Eades, P. (1984). A heuristic for graph drawing. In Con-
gressus Numerantium, volume 42, pages 149–160.
Fruchterman, T. M. J. and Reingold, E. M. (1991). Graph
drawing by force-directed placement. Softw., Pract.
Exper., 21(11):1129–1164.
Goldberg, H. G. and Senator, T. E. (1995). Restructuring
databases for knowledge discovery by consolidation
and link formation. In Proceedings of the First In-
ternational Conference on Knowledge Discovery and
Data Mining, pages 136–141. AAAI Press.
Goltsev, A. V., Dorogovtsev, S. N., and Mendes, J. F. F.
(2006). k-core (bootstrap) percolation on complex
networks: Critical phenomena and nonlocal effects.
CoRR, abs/cond-mat/0602611.
Klerks, P. and Smeets, E. (2001). The network paradigm ap-
plied to criminal organizations: Theoretical nitpicking
or a relevant doctrine for investigators? Recent devel-
opments in the netherlands. Connections, 24:53–65.
Seidman, S. B. (1983). Network structure and minimum
degree. Social Networks, 5:269–287.
Stasko, J., G
¨
org, C., and Liu, Z. (2008). Jigsaw: support-
ing investigative analysis through interactive visual-
ization. Information Visualization, 7:118–132.
Tang, L., Barbier, G., Liu, H., and Zhang, J. (2010). A so-
cial network analysis approach to detecting suspicious
online financial activities. In Advances in Social Com-
puting, LNCS, pages 390–397.
Westphal, C. (2009). Data Mining for Intelligence, Fraud,
& Criminal Detection. CRC Press.
Xu, J. and Chen, H. (2005). Criminal network analysis and
visualization. Comm. of the ACM, 48(6):101–107.
IVAPP 2012 - International Conference on Information Visualization Theory and Applications
802
