VIRTUAL MACHINES FOR VIRTUAL WORLDS
Amirali Sanatinia, Iain A. Oliver, Alan H. D. Miller and Colin Allison
School of Computer Science, University of St Andrews, North Haugh, St Andrews, U.K.
Keywords:
Multimedia, Performance Measurement, Virtual Worlds, OpenSim, Virtualization.
Abstract:
Multi User Virtual Worlds provide a simulated immersive 3D environment that is similar to the real world.
Popular examples include Second Life and OpenSim. The multi-user nature of these simulations means that
there are significant computational demands on the processes that render the different avatar-centric views
of the world for each participant, which change with every movement or interaction each participant makes.
Maintaining quality of experience can be difficult when the density of avatars within the same area suddenly
grows beyond a relatively small number. As such virtual worlds have a dynamic resource-on-demand need
that could conceivably be met by Cloud technologies. In this paper we make a start to assessing the feasibility
of using the Cloud for virtual worlds by measuring the performance of virtual worlds in virtual machines of the
type used for Clouds. A suitable benchmark is researched and formulated and the construction of a test-bed
for carrying out load experiments is described. The system is then used to evaluate the performance of virtual
worlds running in virtual machines. The results are presented and analysed before presenting the design of a
system that we have built for managing virtual worlds in the Cloud.
1 INTRODUCTION
Virtual worlds are 3D environments which enable
users to interact through the proxy of avatars. There
are no predefined rules in virtual worlds and users can
introduce their own goals and rules of play. They
can create objects, shape their surrounding environ-
ment and program the interactive behaviour of ob-
jects. Virtual worlds have applications beyond pro-
viding a platform similar to 3D games for arbitrary
online social activities. They can be used for educa-
tional purposes - for example Getchell et al. (Getchell
et al., 2009) describe their use to investigate a Byzan-
tine Spartan Basilica based upon real excavations. In
another work (Sturgeon et al., 2009) virtual worlds
have been used to provide a virtual laboratory for
conducting 802.11 wireless (WiFi) experiments. In-
deed, our primary motivation for seeking to use vir-
tual worlds is educational. This is due in part be-
cause of the great potential they offer for creating ex-
ploratory learning environments but also because of
our experience of student enthusiasm and engagement
with virtual world based activities. Second Life (Lin-
den Labs, b) and OpenSim (MW et al., ) are two of
the most commonly used virtual worlds for educa-
tion. Although very similar in their systems design
and concepts it has become clear that OpenSim is
much more suitable for educational use (Allison et al.,
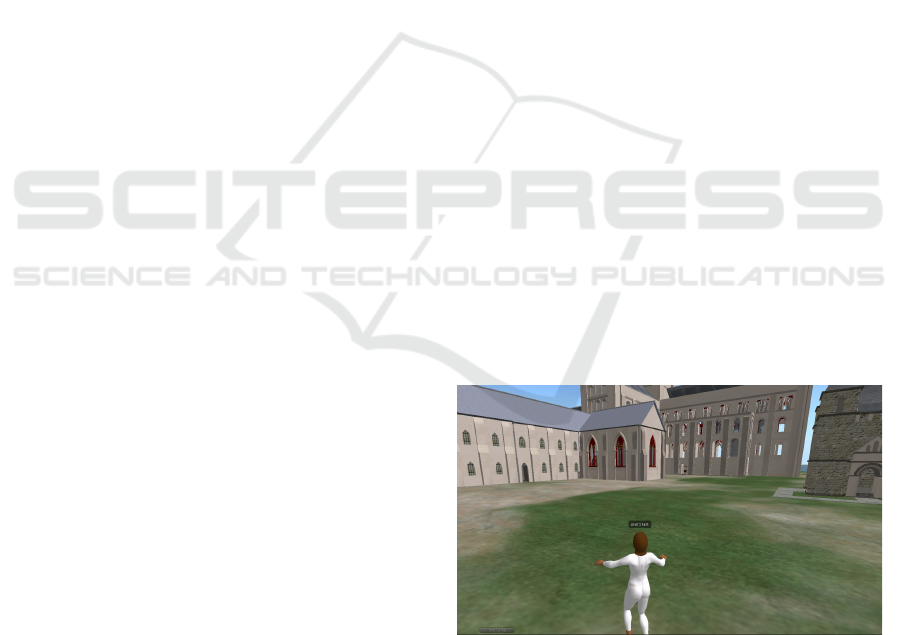
Figure 1: Snapshots of Cathedral. A dense mega-island
consist of six island with large number of prims and objects.
2010; Allison et al., 2011), and accordingly we use
OpenSim for the test-bed and experiments described
in this paper. It should be noted that the open source
Second Life client is compatible with the OpenSim
server, which is also open source.
A recurring problem with virtual worlds such as
OpenSim and Second Life is that they do not scale dy-
namically with the amount of activity within an area.
For example, if there are ten students studying the
WiFi protocols through various interactive multime-
dia resources in the same region then the quality of ex-
perience is very good. If another forty students arrive
in the same region the responsiveness and fidelity of
the virtual world decreases very noticeably and by the
108
Sanatinia A., A. Oliver I., H. D. Miller A. and Allison C..
VIRTUAL MACHINES FOR VIRTUAL WORLDS.
DOI: 10.5220/0003932701080113
In Proceedings of the 2nd International Conference on Cloud Computing and Services Science (CLOSER-2012), pages 108-113
ISBN: 978-989-8565-05-1
Copyright
c
2012 SCITEPRESS (Science and Technology Publications, Lda.)

time a hundred avatars are present the environment is
unusable. Statically provisioning for a hundred users
is both very expensive and wasteful of resources when
the average load is more likely to be fewer than five
users. Can Cloud technologies be used to address this
dynamic scaling requirement? As a starting point we
investigate the use of virtual machines, of the types
used in Clouds, to host virtual world servers, and as-
sess their performance. In order to do this we have
researched and formulated a suitable benchmark and
have built a test-bed that allows for experiments with
varying loads and types of activities.
Related work includes (Barker and Shenoy, 2010;
Barham et al., 2003; Gupta et al., 2006; Kinicki and
Claypool, 2008)
Section 2 describes the overall approach, the for-
mulation of the benchmark and the methodology
adopted; section 3 describes the test-bed; section 4
presents an analysis of the experiments run on non-
virtualized hardware; section 5 runs the same tests on
virtual machines.
2 METHODOLOGY
We know from direct observation and from related
work that the higher the number of avatars in an area
the higher the load on the server and the poorer the
Quality of Experience (QoE) for each user. We there-
fore make the general assumption that the QoE for a
user is related to the server performance which in turn
is related to the load on the server. Accordingly, in or-
der to create a test-bed for experimentation we need
to: i) find a suitable metric which represents the load
on the server proportionate to the number of users;
and ii) have a flexible load generator that corresponds
to human-controlled avatar behaviour.
2.1 Virtual World Server Load
In order to discover a suitable metric we start by car-
rying out experiments with real users. Virtual worlds
are typically organised into administrative domains
called “islands”. In OpenSim islands can be grouped
together into “mega-islands”. Our initial experiments
made use of a mega-island called Cathedral (which
hosts a reconstruction of a large 14th century cathe-
dral) and human-controlled avatars.
Data was collected from both the clients and the
server. On the client side we used a modified ver-
sion of the Second Life client using libOpenMeta-
verse (Baba et al., ). LibOpenMetaverse is a collec-
tion of .Net libraries written and developed in C#. The
monitor collects data from the server every 3 seconds
and logs all the statistics returning from the server. On
the server side we collect CPU, memory and network
usage. A screen-shot of an avatar on the Cathedral
mega-island is shown in Figure 1.
In order to capture typical avatar behaviour two
sets of observations were made with 8 users and 33
users respectively. Each test had 3 runs and each run
lasted for 10 minutes. In this experiment the users’
avatars spend 80 to 90 percent of their time standing
and doing nothing as Varvello et al. (Varvello et al.,
2008) describe. The remainder of the time was spent
walking around.
FPS is the simulator frame rate. Higher numbers
indicate better performance and smoother experience.
This number should be around 55 (Linden Labs, a).
FT is the time it takes for the simulator to run each
frame. The OpenSim server returns frame time per
second to the client. To calculate FT this value is di-
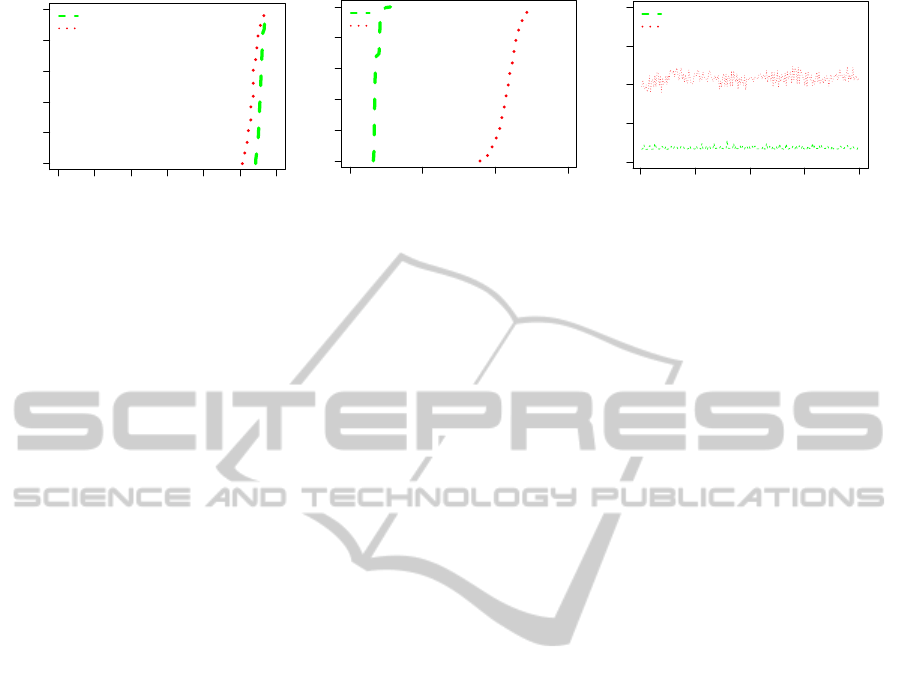
vided by FPS. The FPS and FT for 8 and 33 humans
is shown in Figure 2. The green line shows the values
for 8 humans and the red line shows the values for 33
humans.
The ECDF of the mean Frames Per Second is
shown in Figure 2(a). The frame rate changes a little
between these different numbers of users. The min-
imum frame rate with 8 humans is 53 and with 33
humans is 50. The maximum rate with both 8 and
33 humans is 58. This indicates that the number of
frames per second is limited by the server and that at
these levels of load, in this setup, it is usually able
to render close to the maximum allowed number of
frames.
The ECDF of the Frame Time is shown in Fig-
ure 2(b). The minimum frame times are 1.6 and 8.9
and maximum frame times are 2.7 and 12.3 with 8
and 33 users. These numbers indicate that frame time
does not change with low number of users signifi-
cantly, but with increases in the number of users be-
sides the minimum and maximum values, the range
of change also increases. This pattern is consistent
with the frame rate being limited and suggests that
frame time is a better measure of user-related system
load than FPS and concomitantly on the server per-
formance.
A time series plot of frame time for experiments
with 8 and 33 users are shown in Figure 2(c). This
figure includes 200 samples from the sessions with
human-controlled avatars. The x-axis show the num-
ber of samples since the first one and the y-axis shows
the FPS. The green line shows the values for the
run with 8 human controlled avatars and the red line
shows the values for a run with 33 human controlled
avatars.
This data strongly suggests that the Frame Time
VIRTUALMACHINESFORVIRTUALWORLDS
109
0 10 20 30 40 50 60
0.0 0.2 0.4 0.6 0.8 1.0
FPS
cumulative distribution
8 Humans
33 Humans
(a) Frame Per Second
0 5 10 15
0.0 0.2 0.4 0.6 0.8 1.0
frame time (ms)
cumulative distribution
8 Humans
33 Humans
(b) Frame Time
0 50 100 150 200
0 5 10 15 20
Sample
frame time
8 Humans
33 Humans
(c) Frame Time
Figure 2: CDF and Time series plots comparing sessions with human. Sessions with 8 users and 33 users.
better reflect the load escalation caused by increases
in avatars than the FPS metric. Accordingly we chose
a frame time metric as a better representation of the
server load generated by numbers of users.
2.2 Creating Automated Loads
In order to create automated loads we must find a
means of approximating to the load generated by
numbers of real users controlling avatars. We devised
six different types of bots. These bots are modified
Second Life clients which use libOpenMetaverse to
connect to and interact with the OpenSim server. The
bots behave as follows:
Walk-2. 20 second walk followed by 80 second walk
in random direction
Walk-Rest 1. 20 second walk in random direction
followed by 80 seconds of standing still
In addition, the bots have inventories and are clothed
to make the experiment environment closer to a hu-
man controlled experience.
In this section the behaviour of the different types
of bots are compared to human-controlled avatars.
The frame time is used to compare the bots. The effect
on the load of the server of the different types of bots
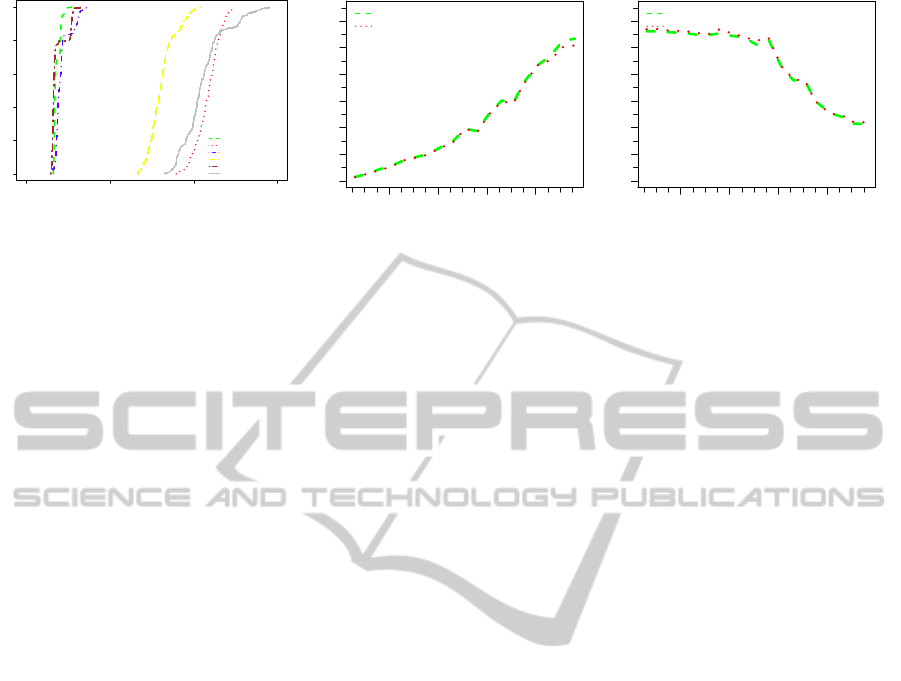
was investigated. The CDF of the frame time for dif-
ferent bots and humans are shown in Figure 3(a). The
x-axis shows the frame time and the y-axis shows the
CDF value. The green and red lines show the human
values, the other colours represent different bot types.
The ECDF of selected bots Walk-2 (20 second
walk followed by 80 second walk) and Walk-Rest-
1 (20 second walk in random direction followed by
80 seconds of standing still) and humans with 8 and
33 agents is shown in Figure 3(a). This figure is in-
tended to give a better view of the relationship of the
bots. With 8 users the differences are subtle but as the
number of bots increase, it is clear that Walk-2 is the
closest match to human in terms of its effect and load
on simulator.
In summary, the load on the server created by Bots
closely matches that of human controlled avatars. The
closes match is achieved with the Walk-2 configura-
tion. This is used in the test-bed to simulate human-
controlled-avatar load.
3 EXPERIMENTAL SETUP
This section describes the experimental setup used
and data capture system employed. The server ma-
chine had 10GB RAM, and an Intel Xeon 4-core
X3430 quad processor running at 2.4 GHz. The OS
was Ubuntu version 11.04. Version 0.7.1 of the Open-
Sim server was used with a MySQL database in grid
mode. The server was started using a script before
the bots were connected. The server is latter stopped
using a script after the bots are disconnected.
The in-world measures of load were gathered us-
ing a customised client built using the libOpenMeta-
verse library. A monitor was run on a separate work-
station than the simulator to eliminate overhead on
server. This workstation OS was openSUSE 11.3 us-
ing Mono to run .Net components. The monitor work-
station collected data from the OpenSim server ev-
ery 3 seconds. (The statistics gathered by the monitor
client are generated by the server and sent out to all
clients.)
The bots were distributed over a number of client
workstations, so that the load on any one would not
effect behaviour of the bots or their load on the server.
Through tests it was established that a maximum of 25
bots could be run on a single workstation. The maxi-
mum number of bots used in the experiments was 100,
which required 4 workstations. The workstations had
4GB RAM and core-2 quad Q6600 processors run-
ning at 2.4 GHz.
The test-bed system uses the bot which was deter-
mined to most closely approximate the same load on
the server as a human-controlled avatar (Walk-2). In
CLOSER2012-2ndInternationalConferenceonCloudComputingandServicesScience
110
0 5 10 15
0.0 0.2 0.4 0.6 0.8 1.0
frame time
cumulative distribution
8 Humans
33 Humans
Walk−Rest1(8 Agents)
Walk−Rest1(33 Agents)
Walk2(8 Agents)
Walk2(33 Agents)
(a) CDF plots for comparing selected bots with hu-
mans. Sessions with 8 users and 33 agents.
20 40 60 80
0 10 20 30 40 50 60
No of Agents
FrameTime (ms)
20 40 60 80
0 20 40 60
mean
median
(b) Frame Time
20 40 60 80
0 10 20 30 40 50 60
No of Agents
FPS
20 40 60 80
0 20 40 60
mean
median
(c) Frame Per Second
Figure 3: Summary values against the number of bots with the Walk 2 bot (20 second walk followed by 80 second walk).
the experiments the number of bots was increased by
5 for each iteration. Each run was repeated 3 times.
The bots were connected to the server with a 20 sec-
ond gap between starting each bot. All of the bots for
a run are connected to the server and then the system
is allowed to run for 700 seconds, this collects more
than 200 values from the monitor. The monitor is then
disconnected and the bots are shutdown followed by
the server.
4 ANALYSES OF SERVER LOAD
In these experiments each run was repeated three
times. This experiment allowed the maximum num-
ber of users that can simultaneously log in to simu-
lator and use the virtual world smoothly to be deter-
mined. The results of these experiments are shown
in figure 3. They show frames per second and frame
time. The green lines show the mean values and the
red points show the median values. The x-axis shows
the number of avatars in world.
The frame time against the number of avatars is
shown in figure 3(b). The y-axis shows the frame
time in milliseconds. With 55 avatars the frame time
is 19 ms and with 60 it is 25. The frame time contin-
ues to increase with the number of avatars. A frame
time over 22 milliseconds indicates that the simulator
is overloaded (Linden Labs, a) and the user’s experi-
ence is likely to suffer.
The number of frame per second against the num-
ber of avatars is shown in figure 3(c). The y-axis
shows the FPS. The FPS is quite stable until more
than 60 avatars are in world at the same time and then
reduces. This is consistent with the system being able
to handle the load when the frame time is less than 22
milliseconds.
As it can be seen in these figures, the number of
users has a significant impact on performance. When
the number of users reaches 55 there is a significant
drop in the frame rate. The rates drop from 53 with 55
users to 43 with 60 users and to 20 with 90. Through
a human logging on it was confirmed that the respon-
siveness of the system degrades significantly as the
frame rate drops below 50 fps.
5 VIRTUALIZING THE VIRTUAL
In this section the use of the test-bed for evaluating the
performance of a virtual world in different virtualiza-
tion is described. There virtualization systems used in
this study were Xen (in privileged mode: dom0; and
unprivileged mode: domU), KVM and Virtual Box.
XEN is a paravirtualization system where the op-
erating system is modified to be aware that it is being
run in virtualized environment so that it makes calls
to a hypervisor when it needs to perform privileged
instructions. This allows multiple operating systems
to run at the same time without emulation.
A XEN based virtual machine on the same hard-
ware as the non-virtualized experiments were per-
formed was created. This involved installing a XEN
4.0 hypervisor and patched kernel to operate as a
privileged domain. A virtual machine was then cre-
ated using the same version of the OS and software.
The tests were performed in the same pattern with
the number of bots increasing from 0 to 100 in steps
of 5 and each run repeated three times. The exper-
iments were performed in both an unprivileged do-
main (domU) and in the privileged domain (dom0)
with no other domains running.
The experiments were also performed using a
KVM virtual machine. The KVM virtualization
system uses the hardware virtualization system on
X86 CPUs to allow virtualization without emulation.
KVM is based on the QEMU emulator though it does
not use its emulation capabilities. A KVM virtual
environment was created using the same setup with
the same contents as the XEN and non-XEN environ-
VIRTUALMACHINESFORVIRTUALWORLDS
111
0
0.2
0.4
0.6
0.8
1
0 20 40 60 80 100
Fraction
Frame Time
10 Avatars Metal
10 Avatars XEN dom0
10 Avatars XEN domU
10 Avatars KVM
10 Avatars Virtual Box
(a) 10 bots
0
0.2
0.4
0.6
0.8
1
0 20 40 60 80 100
Fraction
Frame Time
30 Avatars Metal
30 Avatars XEN dom0
30 Avatars XEN domU
30 Avatars KVM
(b) 30 bots
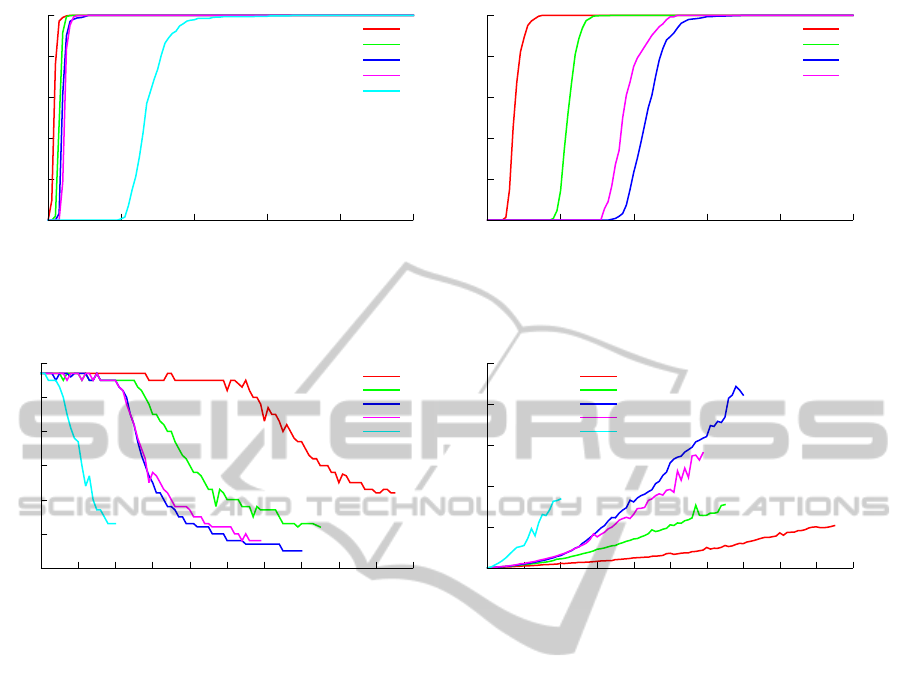
Figure 4: Comprehensive tests using bot Walk 2 (20 second walk followed by 80 second walk). Impact of number of agents
on the metrics. (FPS and frame time).
0
10
20
30
40
50
60
0 10 20 30 40 50 60 70 80 90 100
FPS
Avatars
Metal
XEN dom0
XEN domU
KVM
Virtual Box
(a) Frames Per Second
0
50
100
150
200
250
0 10 20 30 40 50 60 70 80 90 100
Frame Time
Avatars
Metal
XEN dom0
XEN domU
KVM
Virtual Box
(b) Frame Time
Figure 5: Comprehensive tests using bot Walk 2 (20 second walk followed by 80 second walk). Impact of number of agents
on the metrics. (FPS and frame time).
ments.
Virtual Box is a virtualization environment which
is designed primarily for virtualizing GUI system on a
desktop computer. It has good graphical support and
integrating with the host desktop environment.
The cumulative distribution frequency of the
frame time for different numbers of bots is the shown
in figure 4. The x-axis shows the frame time in mil-
liseconds and the y-axis shows the fraction of the
samples where the “from time” was shorter than that
time. The red line shows the frame time for the Open-
Sim server running in the non virtualized environ-
ment. The green line shows the frame time for a priv-
ileged XEN domain. The dark blue shows the val-
ues for the unprivileged XEN domain. The pink line
shows the values for the KVM virtual environment
and the light blue shows the values for the Virtual Box
virtual environment.
The values for 10 bots in addition to the monitor
bot are shown in Figure 4(a). There is a difference be-
tween the different environments with this number of
bots. The presence of the XEN hypervisor seems to
make a small difference with the privileged domain
being slower than the non-virtualized environment.
The unprivileged XEN domain and the KVM domain
have similar performance. The performance of the
Virtual Box environment is not sufficient to produce
the preset number of frames per-second.
The values for 30 bots in addition to the moni-
tor bot are shown in Figure 4(b). There are no Vir-
tual Box values for this number of bots as 20 was
the largest number of bots which were able to con-
nect. The difference between the performance is
again larger, though the KVM environment is now
performing better than the unprivileged XEN domain.
The median frame time and number of frames
per second for the different virtualized environments
against the number of bots are shown in Figure 5. The
x-axis shows the number of bots. The red line shows
non virtualized values. The green line shows the XEN
dom0 values. The blue line shows the XEN domU
values. The pink line shows the KVM median values.
The light blue line shows the Virtual Box values.
The number of frame per second for the different
virtualization environments are shown in Figure 5(a).
The y-axis shows the FPS. The non-virtualized sys-
tem is able to maintain its frame rate up until there
are 50 avatars in the environment. The XEN dom0
CLOSER2012-2ndInternationalConferenceonCloudComputingandServicesScience
112

setup is able to maintain a frame rate of 55 up until 25
avatars. The XEN domU and KVM setups are able
to maintain a frame rate of 55 until 20 avatars. The
Virtual Box setup is only able to maintain a rate of 53
frames with 5 avatars. The frame time for different
virtualized setups is shown in Figure 5(b). The y-axis
shows the time taken to do each from in milliseconds.
The non-virtualized setup has the least steep curve,
followed by the XEN dom0 setup, then the KVM
setup, followed by the XEN domU setup and last the
Virtual Box setup. The KVM and XEN domU setups
should be usable with 20 avatars and may be usable
with more.
These measurements establish that virtual worlds
can run well in a Cloud environment, but the num-
ber of concurrent users that can be supported is half
that can be supported on the same hardware in a non-
virtualized environment.
6 CONCLUSIONS
This paper has looked at evaluation of virtual worlds.
The effect of the load on an OpenSim server caused
by human control of avatars has been observed and
bots have been created to produce the same level of
load on the server. Different metrics have been in-
vestigated, including frame rate and frame time. As
the number of users increases frame rate drops, while
frame time grows. The frame rate is limited to a max-
imum value so does not vary until the load on the
server is high.
The test frame work was run with OpenSim run-
ning in virtualized environments using the same ver-
sion of Linux as the non virtualized version. The XEN
and KVM virtualized environments produce similar
results. They are able to produce a frame rate of 55
FPS with 20 or less avatars.
Further experiments are needed to find the best
settings for virtualizing virtual worlds and studying
their impact on performance. Part of the Cloud com-
puting promise is that it enables users to dynamically
grow their resources in accordance with demand. This
is enabled in part by the use of virtual machines. Now
that we have a measure of the “hit” taken by virtu-
alizing a virtual world server we can move on to the
next stage of developing policies for the management
of virtual worlds in the Cloud.
REFERENCES
Allison, C., Miller, A., Sturgeon, T., Perera, I., and McCaf-
fery, J. (2011). The third dimension in open learn-
ing. In 41st ASEE/IEEE Frontiers in Education, IEEE
Press, pages T2E–1 –T2E–6.
Allison, C., Sturgeon, T., Miller, A., Perera, G., and Nicoll,
J. (2010). Educationally enhanced virtual worlds. In
40th IEEE Frontiers in Education Conference, 2010.
FIE ’10. Washington: IEEE Pres.
Baba, otakup0pe, jhurliman, Malthus, J., mcortez,
McLean, D., Coder, L., Zaius, A., jradford, Lancej,
frob, and Khalifa, L. libopenmetaverse. http://
www.openmetaverse.org/projects/libopenmetaverse.
[Online; accessed 28-March-2011].
Barham, P., Dragovic, B., Fraser, K., Hand, S., Harris, T.,
Ho, A., Neugebauer, R., Pratt, I., and Warfield, A.
(2003). Xen and the art of virtualization. SIGOPS
Oper. Syst. Rev., 37:164–177.
Barker, S. K. and Shenoy, P. (2010). Empirical evalua-
tion of latency-sensitive application performance in
the cloud. In Proceedings of the first annual ACM
SIGMM conference on Multimedia systems, MMSys
’10, pages 35–46, New York, NY, USA. ACM.
Getchell, K., Miller, A., Allison, C., and Sweetman, R.
(2009). Exploring the second life of a byzantine basil-
ica. In Petrovic, O. and Brand, A., editors, Serious
Games on the Move, pages 165–180. Springer Vienna.
Gupta, D., Cherkasova, L., Gardner, R., and Vahdat,
A. (2006). Enforcing performance isolation across
virtual machines in xen. In Proceedings of the
ACM/IFIP/USENIX 2006 International Conference
on Middleware, Middleware ’06, pages 342–362, New
York, NY, USA. Springer-Verlag New York, Inc.
Kinicki, J. and Claypool, M. (2008). Traffic analysis of
avatars in second life. In Proceedings of the 18th In-
ternational Workshop on Network and Operating Sys-
tems Support for Digital Audio and Video, NOSSDAV
’08, pages 69–74, New York, NY, USA. ACM.
Linden Labs. Second Life Statistics Bar Guide http://
wiki.secondlife.com/wiki/Statistics Bar Guide.
Linden Labs. Second Life http://secondlife.com/.
MW, Frisby, A., MingChen, lbsa71, Dague, S., Tedd,
justincc, Teravus, Berntsson, J., Krinke, C., Scofield,
D., dahlia, mikem, Thielker, M., Horwitz, H., Brown,
I., Lopes, C., nlin, and Valadares, A. R. S. OpenSimu-
lator. http://opensimulator.org. [Online; accessed 29-
September-2010].
Sturgeon, T., Allison, C., and Miller, A. (2009). 802.11
wireless experiments in a virtual world. SIGCSE Bull.,
41:85–89.
Varvello, M., Picconi, F., Diot, C., and Biersack, E. (2008).
Is there life in second life? In Proceedings of the 2008
ACM CoNEXT Conference, CoNEXT ’08, pages 1:1–
1:12, New York, NY, USA. ACM.
VIRTUALMACHINESFORVIRTUALWORLDS
113
