
ATTITUDES OF INTERACTIVE WHITEBOARD USERS
Biró Piroska
Institute of Informatics, Department of Information Technology, Debrecen University,
Kassai streat 26, Debrecen, Hungary
Keywords: Interactive Whiteboard (IWB), Interactive Learning Environment, Teachers’ Attitude.
Abstract: Thanks to the applications more and more IWBs are available for the institutions in Hungary. The most
active and enthusiastic teachers who are ready for the latest challenges start to use the technical devices at
once, they learn to use it and apply it in their everyday education. The aim of the research is to get a picture
of active IWB users' opinions. 50 randomly selected teachers were asked whose schools have got several
IWBs available. So, the results below reflect experienced teachers' opinion, since they have been using IWB
from 1 to 5 years.
1 INTRODUCTION
The presence of the new ICT devices resulted in the
renewal of content and methodology in education.
The appearance and fast development of Information
Technology in our everyday life and consequently in
schools and in education has contributed a lot to the
fact that teaching does not focus only on one subject
but involves all the segments of education.
In the process of modernising education
emphasis has shifted from traditional content based,
theoretical teaching to providing practical
knowledge which students can use in their everyday
life and developing competences.
ICT devices in education have provided the
chance for the innovation of digital competences by
the EU. First the use of computers spread in school,
mainly in IT lessons, but nowadays we can find a
wide variety of ICT devices in other classrooms, too.
This way students do not only use this equipment
in the IT lessons but it was given an important role
in other subjects for example: mathematics, history,
geography, English etc.
In the teaching of the so called digital generation
this is an appropriate device, since the students use it
with confidence, throughout a number of hours; so
via the different digital contents their learning
process can be assisted.
The use of IWB is getting more and more
widespread in Hungary in both primary and
secondary schools. It has even appeared in nursery
schools as well. Teachers have started to embed this
device into their everyday teaching process and use
it successfully, and they are exploring the
possibilities of IWB, they hold interesting,
interactive, visually impressive and colourful
lessons.
International researches prove that the use of
IWB has positive effect on education and elevates it
into another dimension providing several other
possibilities in the field of visualising and arising
students’ interests (Syh-Jong, J. 2010; Glover et al.,
2007; Hall&Higgins, 2005; Hennessy et al, 2007;
Higgins et al., 2007; Schmid, 2008; Ruth K., 2010,
Gillen et al., 2008; Jewit et al., 2007; Kennevell &
Beauchamp 2007; Somekh et al., 2007, etc.).
Nine case studies have been prepared for the
EUN Interactive White Board Working Group in
order to look at experience, policy and innovation in
the use of IWBs in Europe (Karl L. et al, 2010). The
group has concluded the following key common
findings, which are learner and teacher benefits:
1. positive impacts on student engagement,
involvement, content retention, and motivation;
2. greater flexibility in responding to different
learning styles (including team learning) as well as
varying ability levels;
3. “renewal” and innovation capacity for
teachers as they re-visit their own teaching styles,
methodologies, and content;
4. curricular enrichment through wider and
easier access to learning materials and objects;
5. the contribution of IWBs to improved digital
competence amongst learners and teachers;
348
Piroska B..
ATTITUDES OF INTERACTIVE WHITEBOARD USERS.
DOI: 10.5220/0003922703480355
In Proceedings of the 4th International Conference on Computer Supported Education (CSEDU-2012), pages 348-355
ISBN: 978-989-8565-06-8
Copyright
c
2012 SCITEPRESS (Science and Technology Publications, Lda.)
6. impacts on learning management, in
particular regarding an increase in time required for
lesson preparation, how learning materials are stored
and shared;
7. the concomitant risks of excessive or
inappropriate use of a new technology or of
reverting to more traditional teaching styles; in other
words, the central importance of sound pedagogy.
The results of almost every international research
focusing on the use of IWB highlight the most
important benefits which are motivation, arising and
keeping up interest.
2 RESEARCH AND EVALUATION
2.1 Research Questions and Methods
The aim of the following research is to get a picture
of the present situation relying on the opinions of the
experienced teachers who use the IWB actively.
For example: how they have experienced the
positive benefits of IWB during its use, what the
students reaction to it was, in addition what kind of
difficulties they had to face when they introduced
and started to use IWB and which are the ICT
devices needed.
Quantitative test: questionnaires about active users,
the teachers’ attitude about using IWB at secondary
and primary schools.
Statistical analysis: data processing with using
SPSS and Microsoft Excel.
2.2 Analysis of Data
2.2.1 The Sample
50 randomly chosen teachers were asked form 10
primary and secondary schools in Debrecen. All of
the teachers in the sample are IWB users, they teach
with ICT devices every day. The youngest is 24
years old and the oldest one is 57. The average age
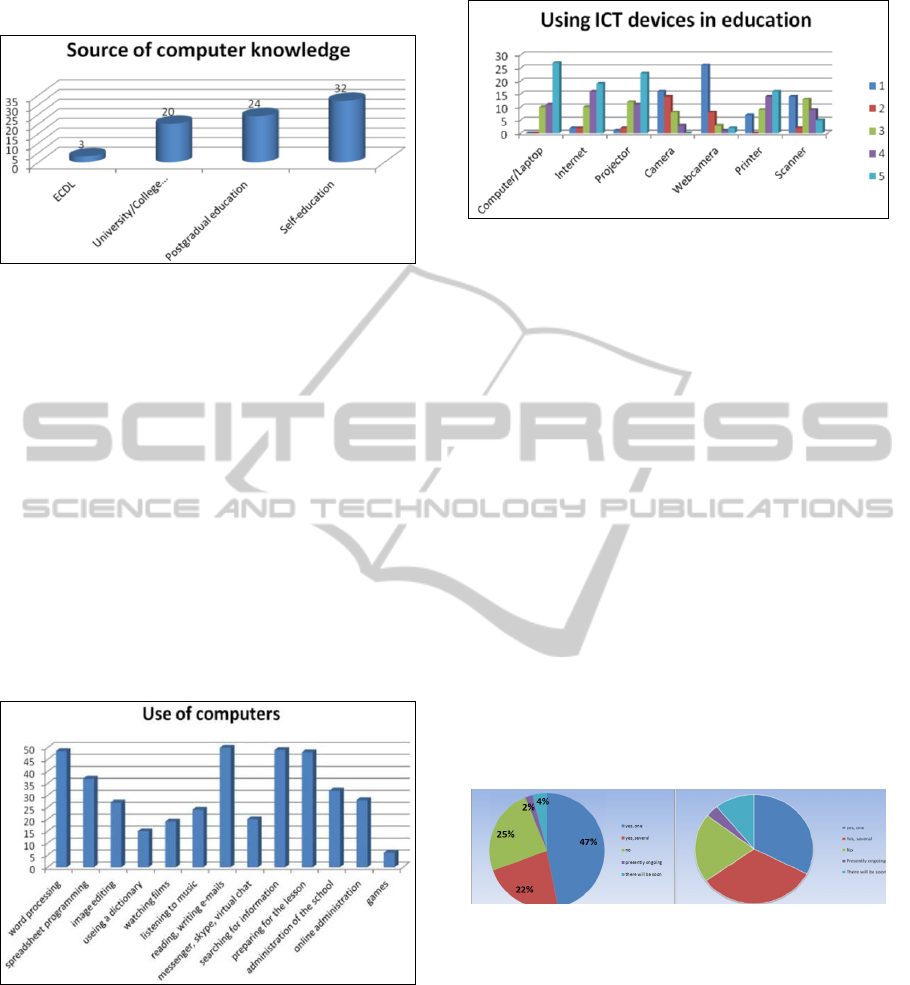
of the teachers in the sample is 43. Having a look at
the gender distribution, Figure 1 suggests that 87%
Figure 1: Ratio of gender.
of the teachers are women and 13% are men. It is
not surprising for me, because there are more female
teachers, in Hungary and in Europe, too.
According to the length of time devoted to
teaching, we can say that the average period of
experience among the teachers in the sample is 19
years. This number shows that the teachers have a
great experience. These teachers have a wider
perspective of the methods they can use to integrate
the ICT devices to their everyday teaching.
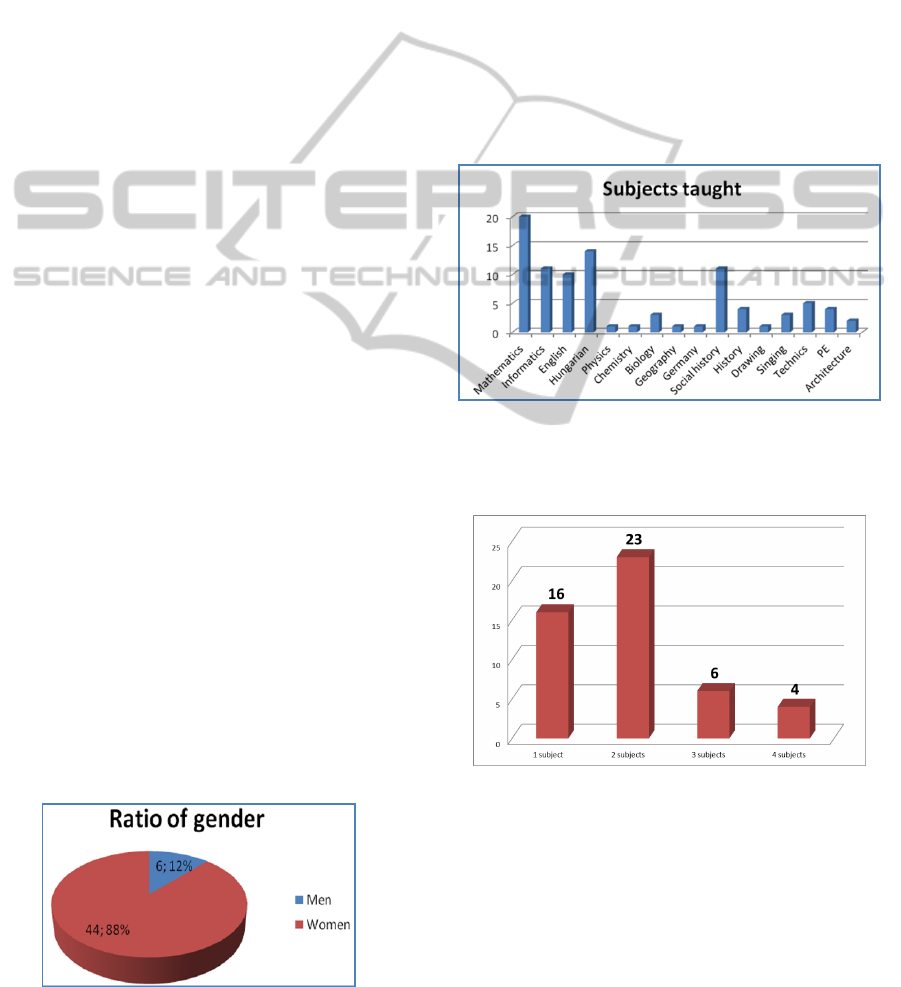
2.2.2 The Teachers and Their Subjects
Taught
Figure 2 shows that the teachers asked teach mainly
Mathematics, Literature, IT, English and Social
History.
Figure 2: Subjects taught.
These results refer to the fact that basically math
teachers use IWB in the institutions enquired.
Figure 3: Number of subjects taught.
Figure 3 reflects the number of subjects taught. Two
thirds of the teachers in the sample teach at least two
subjects.
2.2.3 Using Computer
All of the teachers asked can use the computer and
they have it at home, too. The average time of using
computer is 3 hours and they use the internet 2 hours
ATTITUDESOFINTERACTIVEWHITEBOARDUSERS
349
per day.
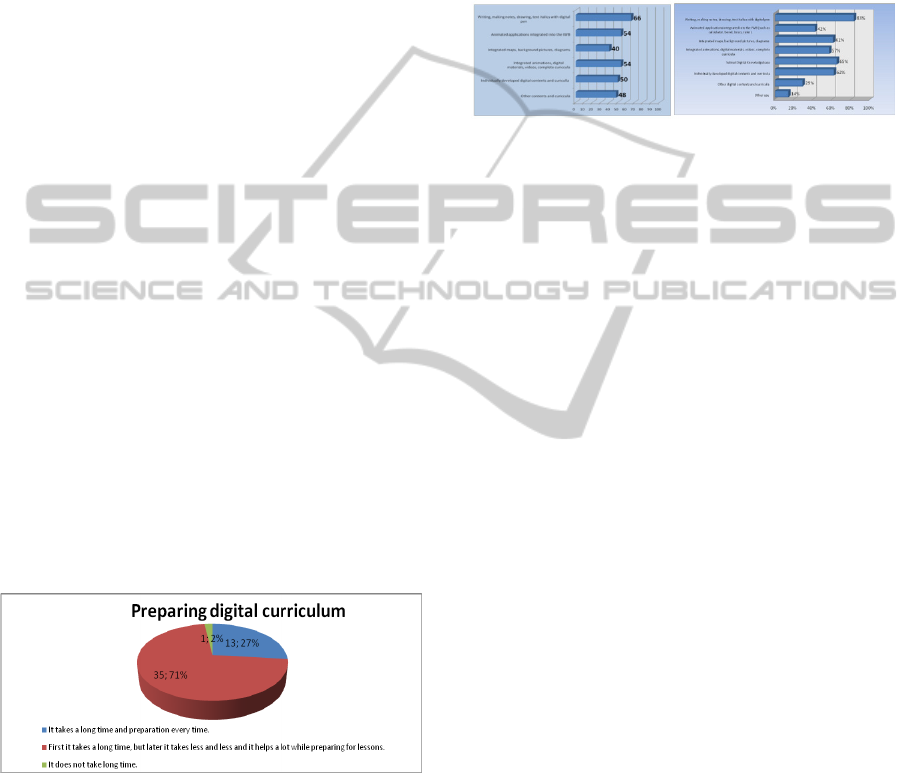
Figure 4: Source of computer knowledge.
The teachers were also asked about the sources of
their computer knowledge. The alternative answers
were the following: ECDL – European Computer
Driving Lessons, University/College, Postgradual
education, Self-education. Figure 4 shows that most
of them chose Self-education. Furthermore, it is
observable that the teachers are open to new
technology and most of them try to develop and
upgrade their knowledge by self-education. Self-
education is essential for teachers, since it is the base
of their continuous development and indispensable
for keeping pace with digital generation. If there are
ICT devices available it is important to use them.
Students tend to claim its use at the lessons. If there
is an IWB in the classroom, they ask their teachers
why they do not use it.
Figure 5: Use of computers.
In Figure 5 shows what teachers in the sample use
computers for. Four outstanding values can be
observed, these are word processing, reading,
writing e-mails, searching for information and
preparing for the lessons. These results are in
connection with each other and they are the base of
preparing for lessons.
Figure 6 shows the frequency of the usage of the
different ICT devices among the teachers from the
Figure 6: Using ICT devices.
sample. 5 point Likert scale was used to give the
answers, where the value 1 meant never using ICT
devices in teaching and number 5 meant that they
often use them. As we can see the most popular
devices are the computer.
2.2.4 Using Interactive Whiteboard
On average there are 6 IWBs in the institutions in
the sample, but this number ranges from 1 to 10.
100% of the teachers asked use IWB 1 hour per day.
48 teachers (96%) confirmed that the IWB has
positive effects on students' achievement while only
one teacher disagreed and another did not give an
answer.
The teachers were asked if they had taken part in
any IWB trainings. They could choose from the
following alternative answers: yes once, yes several,
no, recently going and there will be soon.
The results of the question above (which we can
see in 7a and denotes Biro P. 2011) are compared to
those given by Tar Zs. 2009.
Figure 7: a) Biro P., 2011 b) Tar Zs., 2009.
Participation in IWB training.
Figure 7a shows that 69% of the teachers asked
have already taken part in an IWB training course,
which help them a lot in their work every day, since
these courses teach them how to use different
methodological techniques that they can use in their
lessons. Moreover, these courses make it possible
for communities to evolve and professionals in these
groups can share their material and experience and
they can find solutions to their problems. It is
important for teachers using IWB to take part in
such a course because these occasions may help
teachers to avoid problems at the beginning.
CSEDU2012-4thInternationalConferenceonComputerSupportedEducation
350
According to Tar Zs.’s survey (Figure 7b) 32%
of teachers participated in in-service training
organized in their own school only once, while
another 32% participated on more occasions. In 3%
of schools, training was in progress, while in 9% of
schools IWB in-service teacher training was to be
organized soon. 17% of users reported that there had
been no training, and in 38 institutions vendors (who
delivered the IWBs) had not carried out training on
IWB usage. (Tar Zs., 2009)
There are different types of IWBs in the
institutions, what is more certain schools have
several types of IWBs, which makes teachers’ work
more difficult. Using IWB independent software
might be a solution to this problem. In the
institutions involved in the sample there are Mimio,
Polyvision and Smart boards.
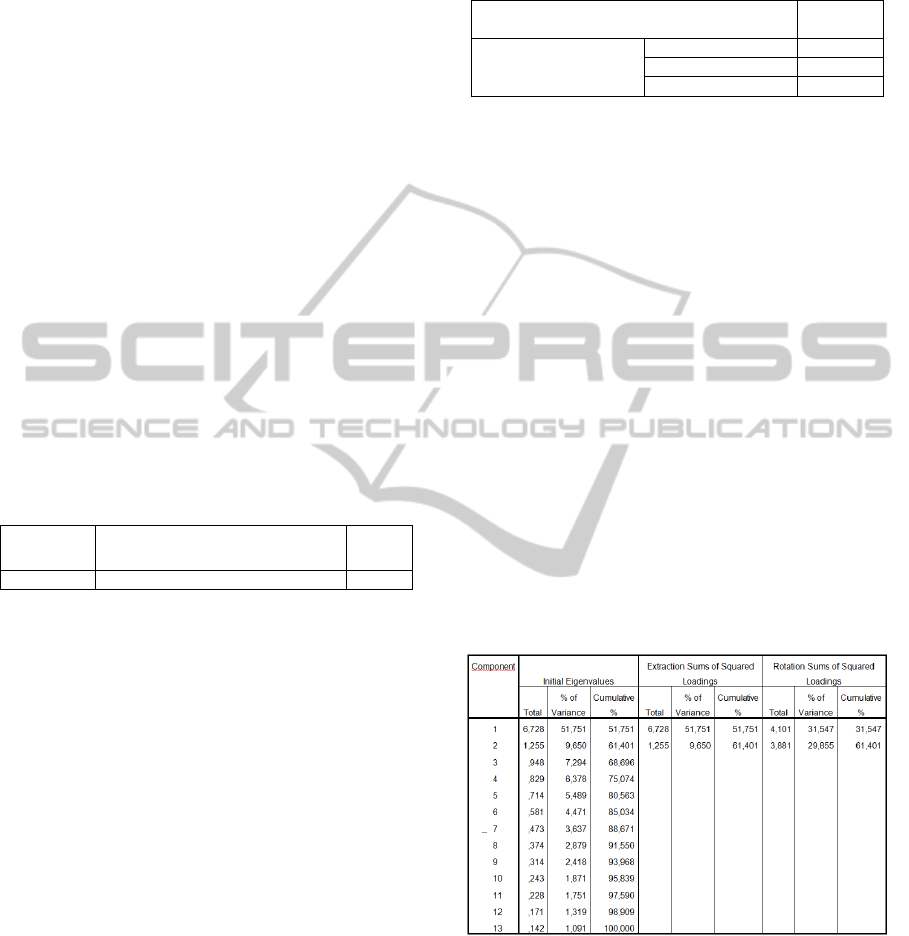
2.2.5 Digital Curriculum
Teachers spend 1,5 hours preparing digital material.
The majority of them spend a lot of time preparing
material first, but later they need less time because
they can reuse their previously made material. So it
is worth spending time with. There was only one
teacher who said that preparing material does not
take a long time. However, he has been using the
IWB for 4 years, which also supports the idea that as
time goes by preparing material takes less and less
time. Teachers who chose the first answer are
mainly teachers having used ICT devices for only
one year and they use the computer less so it takes
more time and energy for them to prepare the
appropriate material. In Figure 8 we can see the
teachers’ attitudes to the time of preparation.
Figure 8: Preparing digital curriculum.
45 of the teachers asked use digital material, 1 does
not use any and 4 of them gave no answers.
Compared to Tar Zs.’s survey (2009), we can see
in Figure 9, which was part of a European case study
(Karl L. et al, 2010), it can be concluded that the
results are similar among the teachers asked. There
was a slight fluctuation in the questions “Writing,
making notes, drawing, text italics with digital pens”
(66% - 83%) and “Other digital contents curricula”
(46%-29%). The most popular digital curriculum is
SDT (Sulinet Digital Knowledgebase). In the above
mentioned survey (Tar Zs., 2009) 65% of the
teachers marked that they use it, this percentage
seems to be increasing since 72% claimed to use it
while teaching whereas Realika is less popular: 32%
teachers use it. This difference may be caused by the
fact that Realika contains only material for science
subjects.
Figure 9: a) Biro P., 2011 b) Tar Zs., 2009.
Applications on IWBs
None of the teachers marked that they use voting
systems which suggests that they do not have one.
The electronic register is not at all widespread either,
since it is used in only one of the institutions. As
more and more parents use the computer on a daily
basis, presumably this application will also be
popular, so that parents can check their children’s
achievement at school. It also makes teachers
administrative work much easier.
2.3 Factor Analysis
The statements below were evaluated on a 5 point
Likert Scale by teachers using the IWB, where 1
means that they do not agree with the statement and
5 means that they totally agree with it.
The reliability is analysed by the Split-half method
and the so called Cronbach’s alpha coefficient. To
examine validity a Rotated Varimax Principal
Component factor analysis was applied.
1. The motivation of the students increased.
2. The achievement of the student increased.
3. Students’ interactivity in the lesson increased.
4. Using IWB helped improve their ICT skills.
5. Using IWB helped improve their visual skills.
6. Making more progress in the material.
7. Students understood the material more easily.
8. Weaker students could more easily catch up.
9. Students were easier to involve in work in the
lessons.
10. Lessons were more organized.
11. The material was more professional.
12. It was easier to revise.
13. Students thought more in the lessons.
ATTITUDESOFINTERACTIVEWHITEBOARDUSERS
351
2.3.1 Reliability Analysis (Polit and
Hungler, 1995)
The reliability of our measure scales were
characterised by measuring precision. We meant by
this that the scale can measure that process
punctually and correctly. There are several methods
to define reliability. In this case an attempt was
made to determine the internal consistency. Internal
consistency is meant by the characteristic of our
scale to measure only a given case (teachers’
attitudes to IWB), and every segment measures the
same thing. The Split-half method was used to
calculate the Cronbach’s alpha coefficient, which
defines the internal consistency. To achieve a
punctual estimation we used the alpha coefficient
suggested by Cronbach (1990), which is the most
accepted measure number of the internal
consistency.
This method examines all the possible
combination of every component automatically, and
on the basis of this it determines a value between 0
and 1. The closer this value gets to 1, the more
reliable the scale is. As Cronbach-alpha=,918 we can
say the our scale is reliable. (Table 1)
Table 1: Reliability statistics.
Cronbach's
Alpha
Cronbach's Alpha Based on
Standardized Items
N of
Items
,918 ,921 13
2.3.2 Validity Analyses (Sajtos L., Mitev A.,
2007)
The factor analysis examines the correlation
between several variables. In the investigation 15
variables were used two of which were excluded
since their MSA value in the main diagonal of the
anti-image correlation matrix was below 0,5.
Principal Component Analysis
Using the Principal component analysis the number
of variables were put into two groups.
The SPSS uses a correlation matrix to determine
the principal components. One of the characteristics
of the method is that it explains all the components,
the observed variance of the variables with the order
of the eigenvalue. Factor number 1 contributes to the
Total Variance with a bigger extent, while the
remaining factors with a decreasing extent.
KMO and Bartlett’s Test
The applicability of the data was examined by with
Kaiser-Meyer-Olkin (KMO) criterion which is one
of the most important measures to decide whether
the variables are suitable for factor analysis. The
KMO value is the mean of the MSA values in the
anti-image matrix.
Table 2: KMO and Bartlett's Test.
Kaiser-Meyer-Olkin Measure of Sampling
Adequacy.
,865
Bartlett's Test of
Sphericity
Approx. Chi-Square 355,040
df 78
Sig. ,000
The KMO>0,8 (=0,865) which means that the
variables are suitable for factor analysis. (Table 2)
The Bartlett-test examines the correlations of the
variable with population (null hypothesis – H0), it
tests that the components outside the principal
diagonal within the correlation matrix deviate from 0
only randomly. Obviously in this case we would like
to reject the H0 so that the variables can correlate. In
the above table we can read that the Null Hypothesis
of the Bartlett test can be rejected, since the level of
significance is lower than 0,05, in our case Sig=0,00,
so the variables can be submitted to the factor
analysis, because there is correlation between them.
Variance Ratio Test
The number of factors can be determined on the
basis of the percentage of the cumulative variance,
that is so many factors were defined that we can
reach a minimal total variance level. In the social
sciences a 60% of variance is acceptable. The
variance described by the factors can be seen in the
table below. (Total Variance Explained – Table 3)
Table 3: Total Variance Explained.
Scree-test
The Scree Plot below (Figure 10) helps determine
the number of factor dimensions. The Scree Plot
figure shows the delineated eigenvalues in the order
of factors, where axis y contains the eigenvalues and
the axis x the number of factors. According to the
Scree-test the number of factors needs to be
maximised where the rise of curve suddenly changes
and continues as a line. On the basis on the Scree
Plot we can see that the choice of the two factor
CSEDU2012-4thInternationalConferenceonComputerSupportedEducation
352

groups is the most accurate.
Maximum-likelihood Method
The fitting of the model was investigated with
Maximum-likelihood method which calculates a
Good-of-fit Test fitting index for a given factor
Figure 10: Scree Plot.
number.
After defining the 2 factors the significance level
was Sig=0.165 (Table 4), which means that the
model fits the observed data very well.
Table 4: Goodness-of-fit Test.
Chi-Square df Sig.
62,944 53 ,165
All of the above mentioned methods indicated that
the selection of the 13 variables must be put into two
groups.
2.3.3 Interpretations of Factors
The Rotated Component Matrix divided the
variables into two groups as shown in the Table 5.
Table 5: Rotated Component Matrix.
Component
1 2
The motivation of the students increased.
,851 ,075
Using IWB helped improve their ICT skills.
,768 ,222
Students’ interactivity in the lesson increased.
,737 ,328
Weaker students could more easily catch up.
,674 ,506
Students understood the material more easily.
,624 ,450
Using IWB helped improve their visual skills.
,619 ,297
The achievement of the student increased.
,618 ,307
The material was more professional.
,284 ,851
Lessons were more organized.
,107 ,774
Making more progress in the material.
,222 ,686
Students thought more in the lessons.
,477 ,670
It was easier to revise.
,322 ,667
Students were easier to involve in work in the
lessons.
,405 ,625
Analysis of Factors
On the basis of rotated factor matrix the factors – i.e.
the functional attributes – got the following names.
Factor 1: Interactivity and improvement of students’
achievement
In this group it is obvious that the emphasis is put on
students’ interactivity. It is easier for the teacher to
involve students to participate in the lesson. Students
are more active in a lesson using ICT devices, what
is more they also improve students’ ICT skills. The
most important benefit of the IWB is the better
achievement of the students. Owing to the
motivation students are more interested and curious
about the material, which might seem to be easier
for weaker students and this way they can easily
catch up with the others.
Factor 2: Lesson planning and demonstration
Planning and organizing lessons change, the teacher
uses interactive material, thus it is easier to handle
the material which is more professional and fits to
modern expectations.
The material of the lesson is easier to understand and
recall or revise. A great advantage of demonstration
is that students can remember material better if they
are visual type and another benefit of the IWB is that
we can gain a lot of time and can cover more
material with it at the same time, so there is more
time of practicing the problematic parts.
2.4 Opinions about IWB
Teachers using the IWB are very positive above it,
they gave much fewer negative opinions. The
positive opinions were categorized into there groups.
2.4.1 Positive Opinions
Motivation
the material can be made more interesting and
colourful, visualization makes it easier to
understand and revise;
the most modern device which is used now.
Teachers Work (methods and preparation)
it is possible to revise material easily and
quickly;
helping homework assignments;
it makes lessons more variable;
we can save the material for future use, it can
easily be organized, students are more
motivated;
it is very good for revision;
it makes explaining complicated material and
showing examples easier.
ATTITUDESOFINTERACTIVEWHITEBOARDUSERS
353
Benefits for Students
students take part in the lesson more often, they
gain more knowledge, the lessons are more
organized;
group work becomes more active;
it is easier for students to understand the
material;
makes weaker students take part too;
the children are of visual type, they remember
new information better if they see it;
it is an efficient device for improving
competences;
it is possible to involve students with different
abilities in the lesson with the help of correctly
chosen and varied tasks;
they can also acquire knowledge through
experience; they get immediate feedback after
finishing the task.
2.4.2 Negative Opinions
colleagues being less susceptible to technology
or having little knowledge of ICT are less ready
to use it. At the beginning it requires lot of time
and energy to prepare material, but later you
can reuse it;
it slows down the pace of the lesson;
it is forced on schools, its installation and
maintenance is very expensive;
only one student works at a time, it takes up a lot
of time, students do not concentrate on the task;
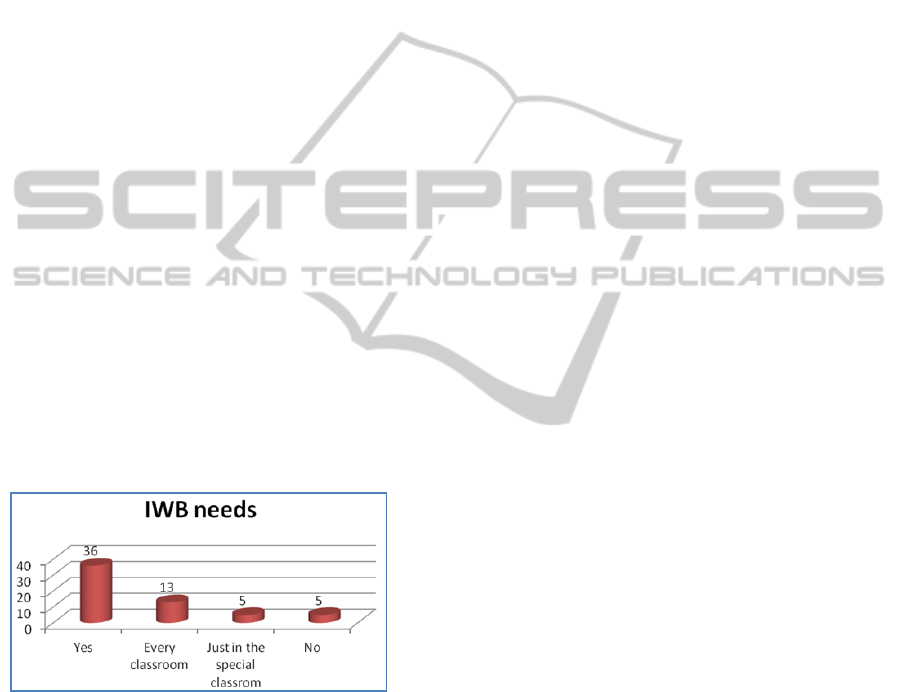
Figure 11: IWB needs.
In Figure 11 we can see that 72% of the teachers
would like to have more IWBs in their schools. The
opinions below show that the IWB will be a basic
and indispensable part of a future classroom.
2.4.3 Future School
The teachers’ expectations of the futures schools are
the following:
there will be a computer which is suitable for
group work, traditional and interactive
whiteboards, projectors, internet access in every
classroom, and other equipment: printer,
scanner;
digital curriculum and teaching aids (IWB,
laptop, voting systems) and single desks which
can be fitted together for group work;
looking at the Hungarian educational policy I do
not dare to “dream of improvements”;
IWB, laptop, projector, Tablet PCs, digital
camera, printer, scanner, TV, DVD player,
voting systems;
spacious, air conditioned classrooms where
there is enough room for traditional equipment
too, small groups of 16 students, computer for
each student;
I think students will have their own laptops an
they will solve their tasks with the help of them,
at least 50% of the teaching process will involve
these devices;
2.4.4 Teachers’ other Remarks
it is a useful device which is very good for
raising interest and catching attention, but it is
important to state that it is remarkably helpful in
certain lessons, for particular topics but its use
should not be forced when it is superfluous;
it is indispensable for teachers to use it to keep
the competitiveness of their school;
students learn how to use it very quickly and they
also like using it, and they praise a teacher who
can use it: “We didn’t think that you can use it“;
there are only a few IWBs in the school, so it is a
problem that sometimes we have to change
classrooms. I am not prepared enough and I do
not understand English;
we need more digital material related to the
curriculum and trainings on how to use the IWB;
it is an up-to-date facility;
it would be more effective if every student had a
mouse and they could be assessed individually;
there should be one in each classroom, there
should be more trainings for teachers;
3 CONCLUSIONS
The above research which is based on the opinion of
the teachers using IWB shows that the IWB has a
positive effect on student achievement, their
motivation increased, the lessons became more
organized and the material is more interesting.
It is important to keep up the situation and
provide something new to our students using the
facilities of the IWB so that it will not only be a
CSEDU2012-4thInternationalConferenceonComputerSupportedEducation
354

“short-term” first impression, but keep the students
interested in the long run and increase their
achievement.
To sum up the opinions we can conclude that the
IWB has a positive effect on every day education;
both teachers and students are enthusiastic about
using the new devices.
REFERENCES
Chris Betcher, Mal Lee (2009). The interactive whiteboard
revolution: teaching with IWBs. ACER Press
Dave Miller, Derek Glover and Douglas Averis, (2004)
Motivation: The contribution of Interactive
whiteboards to teaching and learning in mathematics,
<http://www.iprase.tn.it/attivit%E0/studio_e_ricerca/r
ed5_08/download/03_Interactive_whiteboard_and_ma
thematics.pdf>, Retrieved 2.06.10.
EU, 2006. Key competences for Lifelong Learning http://
europa.eu/legislation_summaries/education_training_y
outh/lifelong_learning/c11090_en.htm, Retrieved
12.08.11.
Euline Cutrim Schmid, (2008). Potential pedagogical
benefits and drawbacks of multimedia use in the
English language classroom equipped with interactive
whiteboard technology, Computers & Education, 51
(4), 1553-1568
Gillen, J., Littleton, K., Twiner, A., Kleine Staarman, J., &
Mercer, N. (2008). Using the interactive whiteboard to
resource continuity and support multimodal teaching
in a primary science classroom. Journal of Computer
Assisted Learning, 24, 348–358.
Glover, D., Miller, D., Averis, D., Door, V. (2007). The
evolution of an effective pedagogy for teachers using
the interactive whiteboard and modern languages: an
empirical analysis from the secondary sectors.
Learning, Media and Technology. 32 (1), 5-20.
Hall&Higgins, (2005). Primary school students'
perceptions of interactive whiteboards. Journal of
Computer Assisted Learning. (21), 102-117.
Hannah Slay, Ingrid Siebörger, Cheryl Hodgkinson-
Williams (2008). Interactive whiteboards: Real beauty
or just “lipstick”? Computers & Education 51 (1321-
1341)
Heather J. S., Higgins S., Kate Wall, Jen Miller (2005).
Interactive whiteboards: boon or bandwagon? A
critical review of the literature. Journal of Computer
Assisted Learning 20, 91-10.
Hennessy, S., Deaney, R., Ruthven, K., & Winterbottom,
M. (2007). Pedagogical strategies for using the
interactive whiteboard to foster learner participation in
school science. Learning, Media and Technology. (32)
283-301.
Higgins, S., Beaucamp, G., Miller, D. (2007). Reviewing
the literature on interactive whiteboards. Learning,
Media and Technology. 32(3), 213-225.
Jewitt, C., Moss, G., & Cardini, A. (2007). Pace,
interactivity, and multimodality in teacher design of
texts for interactive whiteboards in the secondary
school. Learning, Media and Technology, 32(3), 303–
317.
Karl Lehner et al., (2010). Interactive White Board -
National Case Studies, insight.eun.org, http://moe.eun.
org/c/document_library/get_file?uuid=2db0f7d1-089c-
4a3a-b157-db3d65a393b2&groupId=10620 Retrieved
2.06.11.
Kennewell, S., & Beauchamp, G. (2007). The features of
interactive whiteboards and their influence on
learning. Learning, Media and Technology, 32(3),
227–241.
Ketskeméty László, Izsó Lajos, Könyves Tóth Előd:
Bevezetés az IBM SPSS Satistics programrendszerbe,
Artéria Stúdió Kft., 2011
Kirsti Ala-Mutka, Yves Punieand Christine Redecker,
2008. Digital Competence for Lifelong Learning,
ftp://ftp.jrc.es/pub/EURdoc/EURdoc/JRC48708.TN.pd
f, Retrieved 12.08.11.
Polit, D. F., Hungler, B. P. (1995). Nursing research.
Principles and practice (5th Ed.). New York: J. B.
Lippincott.
Ruth K., Neil M., Paul W., Judith K. S, (2010). Can the
interactive whiteboard support young children’s
collaborative communication and thinking in
classroom science activities? Computer – Supported
Collaborative Learning (2010) 5, 359-383
Sajtos László, Mitev Ariel, SPSS kutatási és adatelemzési
kézikönyv, Alinea kiadó, 2007
Somekh, B., Haldane, M., Jones, K., Lewin, C., Steadman,
S., & Scrimshaw, P. (2007). Evaluation of the primary
schools whiteboard expansion project: Report to the
Department for Education and Skills.
Syh-Jong, J. (2010). Integrating the whiteboard and peer
coaching to develop the TACK of secondary science
teachers. Computers & Education 55 (1744-1751)
Tar Zs., (2009), Case Study: Hungary – Interactive
Whiteboard, http://moe.eun.org/c/document_library
/get_file?uuid=c4d1dbdb-a98f-47d2-a9f1-
9172fb9d987f&groupId=10620 Retrieved 2.06.11.
Virányi Ilona, Dr. Zrínyi Miklós, Dr. Baráthné Kerekes
Ágnes, (2001). Ápolás és informatika. Megbízhatóság
és validitás két attitűd skála hazai adaptációja kapcsán,
http://www.eski.hu/new3/kiadv/nover/2001/200105/V
ZB.htm, Retrieved 2.06.11.
ATTITUDESOFINTERACTIVEWHITEBOARDUSERS
355
