
TOWARDS HIGHER EDUCATION QUALITY ASSESSMENT
Framework for Students Satisfaction Evaluation
Olga Cherednichenko and Olga Yangolenko
National Technical University “Kharkiv Polytechnic Institute”, 21 Frunze str., 61002, Kharkiv, Ukraine
Department of Computer-Assisted Management Systems
Keywords: Higher Education, Quality, Computer-aided Assessment, Servqual, Rasch Model.
Abstract: This paper presents the framework of higher education quality assessment. The estimates of education
quality can be used by the chiefs of higher education establishments (HEE) to take management decisions.
The suggested approach is based on SERVQUAL method, supposing that education quality is the quality of
provided service. Within the elaborated framework students fill in the questionnaire, their answers reflect
the gap between perceived and expected education quality. The survey results are processed with the help of
Rasch model. This approach was tested at the Information and management faculty of National Technical
University “Kharkiv Polytechnic Institute”.
1 INTRODUCTION
Nowadays quality criterion becomes a basis for
decision-making in the system of higher education.
Therefore various researches are dedicated to
different aspects of education quality assessment.
Education quality is foremost associated with
knowledge assessment. Since students’ knowledge is
the most obvious and important result of educational
process, a huge amount of researches is dedicated to
knowledge and skills assessment (Koenig, 2011).
Higher education quality can be assessed at a state
level (Maslak, et al., 2005), which provides the
comparison of this characteristic between countries
worldwide. Education quality of higher education
establishments (HEE) is also a subject of
investigations (Kachalov, 2001; European Training
Foundation, 2004). Quality of resources,
courseware, educational curricula and syllabus are
intently studied as well. In many countries licensing
and accreditation are the tools of guaranteeing
quality in HEE. Certification of conformity to ISO
standards is widely used for HEE as well.
To implement all of the suggested techniques of
higher education quality assessment the information
technologies (IT) seem to be a powerful tool. IT
usage provides efficient ways for retreiving,
processing and storing big volumes of information.
The rest of this paper is organized in the
following way. Section 2 summarizes existing trends
in quality assessment. Section 3 substantiates the
necessity of students satisfaction assessment.
Section 4 describes the elaborated approach of
problem solving. Section 5 illustates the obtained
results. Section 6 presents conclusions and prospect
on future work.
2 MODELS AND APPROACHES
REVIEW FOR EDUCATION
QUALITY ASSESSMENT
The classification of education quality assessment
models is based on the approaches of understanding
what the education is and how it should be
evaluated. Education can correlate with the
following aspects: result of learning, educational
process and HEE, i.e. organization that provides
educational service.
Education as a result of learning process
provides students with knowledge, abilities, skills,
and competences. As a rule, psychometric theory is
used for assessing students’ achievements (Barker,
2002). The tools that can be applied for this purpose
include Classical Test Theory (CTT) (Steyer, et.al.,
2001) and Item Response Theory (IRT) (Reeve,
2009). The result of the obtained knowledge
application is reflected in the statistics that deals
with employment assistance. To assess these results
108
Cherednichenko O. and Yangolenko O..
TOWARDS HIGHER EDUCATION QUALITY ASSESSMENT - Framework for Students Satisfaction Evaluation.
DOI: 10.5220/0003916101080112
In Proceedings of the 4th International Conference on Computer Supported Education (CSEDU-2012), pages 108-112
ISBN: 978-989-8565-07-5
Copyright
c
2012 SCITEPRESS (Science and Technology Publications, Lda.)

statistical methods are used.
Considering education as a process leads to its
representation as a service. In this case education
quality is a quality of service provided. Such
methods as GAP analysis, CSI (Customer
Satisfaction Index) calculation, benchmarking
(Predvoditeleva and Balaeva, 2005), and
SERVQUAL technique (Parasurman, et al., 1985)
can be applied to assess it. Within a process-oriented
approach the quality of resources ensuring and
organization of educational process is also
considered. In this case Total Quality Management,
benchmarking (Okes and Westcott, 2000) and Six
Sigma (Lowenthal, 2002) are used.
Higher education quality connecting to HEE can
be assessed with the help of internal and external
models (Borisova, 2007). Considering HEE as an
organization makes it possible to use ISO standards
for education quality management (Okes and
Westcott, 2000).
In the present research we consider higher
education quality management on the basis of
consumers’ satisfaction.
Since quality management is one of university’s
management problems and activities, education
quality assessment is usually integrated into HEE
management information systems (IS).
There are the following HEE information
systems according to their functionality: IS of
administrative and financial management, IS of
educational process management and support, IS of
scientific researches management, and IS of
information resources management (Amrita, 2011;
UMC, 2011). Quality management system is
incorporated into all IS mentioned above. We can
say that there is a tendency of integration of all the
mentioned IS into a single information space.
This research represents the elaborated IS for
higher education consumers’ satisfaction assessment.
3 EVALUATION PROBLEM
STATEMENT
The main activity of higher education quality
management is monitoring. Monitoring is defined as
“a continuous function that uses systematic
collection of data on specified indicators to provide
management and the main stakeholders of
indications of extent of progress and achievements
of objectives” (OECD, 2002).
Since monitoring deals with large amounts of
data and supposes frequent data collection activities,
it seems to be reasonable to automate this procedure.
We suppose that education quality assessment
must be done from the point of view of stakeholders,
for example, the state, the enterprises and the
students. In the present research education quality is
assessed based on students’ opinion. The data that
indicates education quality can be collected from
dean offices, personnel and practice departments,
enterprises and CV banks, as well as from surveys.
Students are the main consumers of educational
services who have entered HEE to get knowledge
and practical skills in some domain. The result of
their education will be clear after their graduating
from HEE and working at the enterprises for some
time. The quality of educational process is expressed
through the quality of the obtained knowledge and
the quality of the process itself. Knowledge can be
estimated by testing (for example, using CTT or
IRT) or as the results of alumni’s jobs. The quality
of processes in HEE can be assessed by students’
survey. So the quality of education service can be
measured via processing data from surveys.
The appropriate survey tool has to be chosen for
students’ satisfaction evaluation. The survey results
should be processed with the help of some
mathematical model. So there is a task of model
selection. To define a degree of confidence in the
obtained estimates of education quality the
reliability of measurement should be calculated.
To implement monitoring and evaluation
procedures IS should be developed.
4 FRAMEWORK FOR STUDENTS
SATISFACTION EVALUATION
In this research it is suggested to use a poll based on
some questionnaire as a survey method (Figure 1).
Unlike the interviews it can be automated and
requires less time for results processing.
To measure students’ satisfaction it is suggested
to use SURVQUAL technique (Parasurman, et al.,
1985). Its main idea is to measure the gap between
consumers’ expectation and perception of service
quality. The following dimensions play the role of
quality criteria: reliability, tangibility, responsibility,
security and empathy. As it is shown by Oliveira
O.J. and Ferreira E.C. (2009) SERVQUAL method
can be successfully used for measuring higher
education quality. They suggested two
questionnaires with 19 statements to assess expected
and perceived quality.
In the present research these two questionnaires
were transformed into a single one. Each its question
is formulated in such a way that the answer on it
TOWARDSHIGHEREDUCATIONQUALITYASSESSMENT-FrameworkforStudentsSatisfactionEvaluation
109
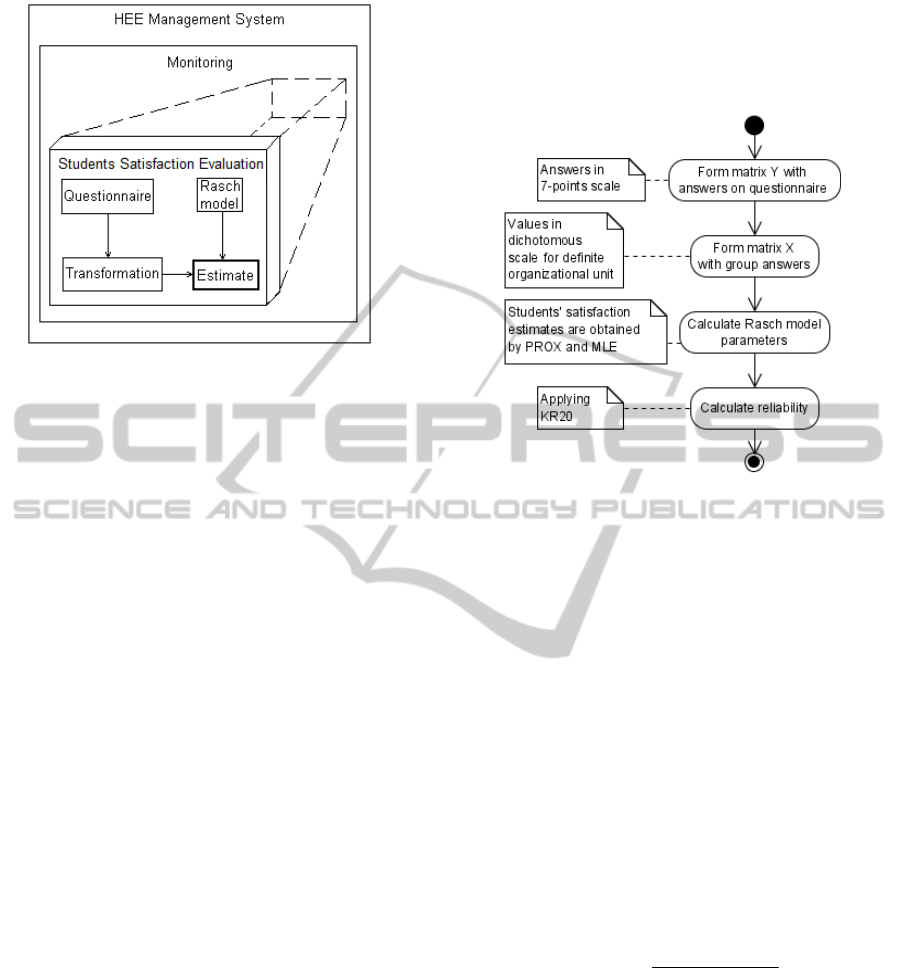
Figure 1: Estimates of students’ satisfaction.
measures the gap between perceived and expected
education quality. For example, instead of the
original statements “Excellent HEE must have
modern equipment, such as laboratories” and “Your
HEE has modern equipment, such as laboratories”
we now have a single question “How much does the
equipment of your HEE differ from your
expectations about it?”. In such a way a student has
to define how much the quality of education that
he/she has finally obtained differs from the quality
that he/she expected to get entering the HEE.
Students are supposed to answer the questions using
7-points scale. The scores range from 1, which
means a strong negative difference, through 4, which
denotes the absence of any gap, to 7, which means a
strong positive difference.
After considering different approaches for
survey’s results processing we have chosen the IRT
(Reeve, 2009). This theory allows to obtain on the
basis of statistics the estimate of one-dimensional
latent variable in the interval scale. Students’
satisfaction can be considered as a latent variable,
therefore IRT will be applied for questionnaires
processing. From the variety of IRT models we have
chosen Rasch model as it is the basic one and the
most widespread one (Wright and Stone, 1999). The
goal of evaluation is to determine whether the HEE
satisfied the students’ expectations or not. Therefore
we suggest to convert 7-points scale into
dichotomous. The perceived quality can either
exceed (coincide) the expected one (expressed by
positive gap) or the expectations can be not justified
(expressed by negative gap), which corresponds to
two possible states. This seems to be similar to
Rasch model dichotomous items.
The poll is anonymous. Filling the questionnaire
a student must mention only his/her organizational
unit, i.e. faculty, department or specialty. After
survey is finished, the matrix Y with students’
answers is formed (Figure 2). Its elements
}{
ij
y
represent the answer of student i to question j.
Figure 2: Process of students’ satisfaction evaluation.
The initial matrix Y has to be transformed into
calculation matrix X which elements
}{
ij
x represent
the values of i organizational unit for question j.
Matrix X is used to group the answers of students
that refer to a particular organizational unit. Matrix
X must contain only zeros and units. If the specified
majority of students of organizational unit i put 4
and more points for question j, then
1=
ij
x . This
means that the majority of students defined a
positive gap or its absence between perceived and
expected education quality. If majority of students
put from 1 to 3 points, then
0=
ij
x , which expresses
the negative gap between perceived and expected
quality.
The estimate of organizational unit is calculated
with the help of Rasch model (Reeve, 2009):
,
)exp(1
)exp(
),|1(
ji
ji
jiij
xP
βθ
βθ
βθ
−+
−
==
(1)
where
ij
x is a value of gap of organizational unit
i for question j;
i
θ
is a students’ satisfaction value;
j
β
is difficulty of question j.
The difference
)(
ji
β
θ
−
is considered as a
single variable, that is why Rasch model is often
called one-parametric model (Reeve, 2009). Both
parameters of Rasch model are measured in logits.
Initial estimates of students’ satisfaction and
questions’ difficulties are calculated by PROX
algorithm for Rasch model’s parameters estimation
CSEDU2012-4thInternationalConferenceonComputerSupportedEducation
110
(Wright and Stone, 1999). The final estimates are
obtained by adjusting initial ones with the help of
maximum likelihood estimation (MLE) procedure.
The estimates of students’ satisfaction can be
used for education quality assessment in quality
monitoring and management system only after
evaluation of their reliability. After analyzing
different approaches for reliability estimation we
have chosen the method of internal consistency
based on calculation of Cronbach’s coefficient. Its
modification for dichotomous data is KR20
reliability coefficient (Wright and Stone, 1999) that
has to be calculated within the given framework.
5 CASE-STUDY
To implement the suggested approach the
Information System of Education Quality
Assessment has been elaborated.
We suggest examining the following case-
studies. The first one has been implemented on the
example of three departments of Information and
management faculty of National Technical
University “Kharkiv Polytechnic Institute”. The
following departments have been considered:
Department of computer-assisted management
systems (CAMS), Department of strategic
management (SM), and Department of system
analysis and management (SA&M).
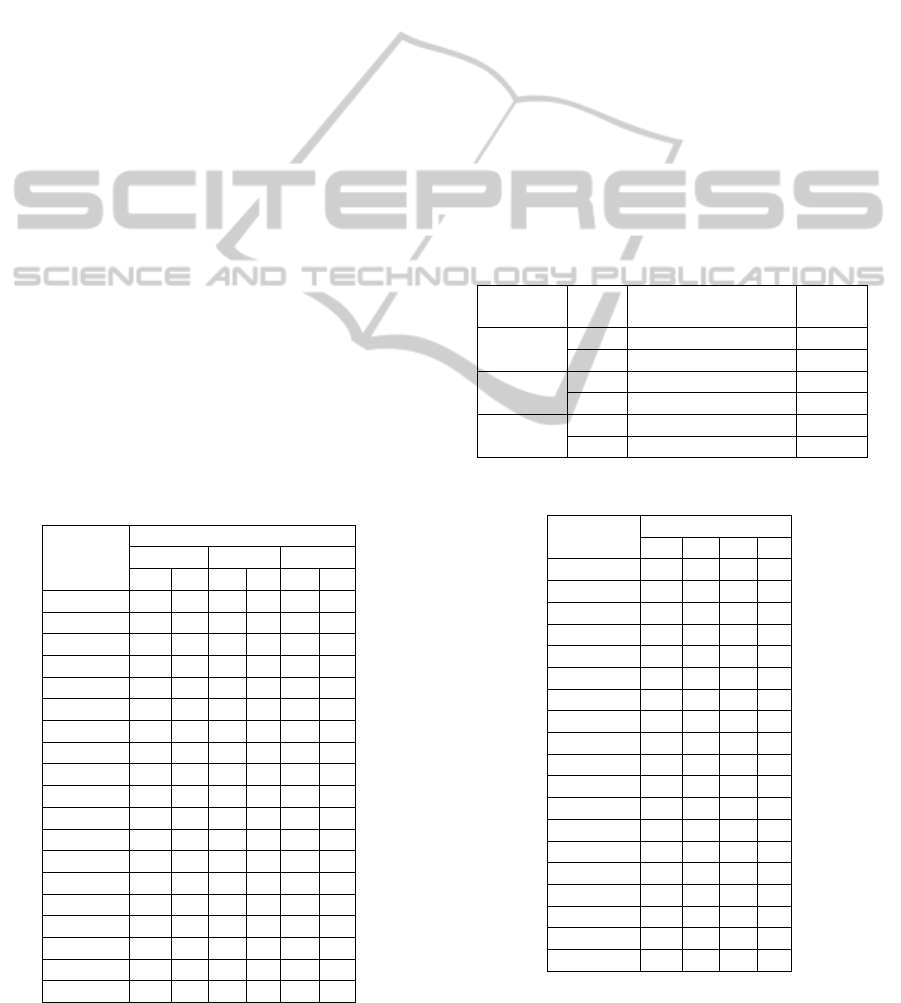
Table 1: Calculation matrix X (1
st
case-study).
Question
Departments
CAMS SM SA&M
M B M B M B
1 1 1 1 0 1 1
2 0 1 1 1 1 1
3 1 1 1 1 1 1
4 1 0 0 0 1 1
5 1 1 1 0 1 0
6 1 1 1 1 1 1
7 1 1 1 1 1 1
8 1 1 0 1 1 1
9 1 1 1 1 1 1
10 1 1 1 1 0 0
11 1 1 1 1 1 1
12 1 1 1 1 1 1
13 1 1 1 1 1 1
14 1 1 1 1 1 1
15 1 1 1 1 1 1
16 1 0 1 1 1 0
17 1 1 1 1 1 1
18 1 1 1 1 1 1
19 1 1 1 1 1 1
120 students took part in the survey. They were
the representatives of both qualification levels:
bachelors (B) and masters (M). Their answers have
been processed and transformed into the calculation
matrix (Table 1). The final estimates of students’
satisfaction are obtained with the help of PROX and
MLE procedures (Table 2).
The second case-study refers to students’
satisfaction assessment of four specialties of CAMS
department: Information driving systems and
technologies (Specialty 1), Software of computer
systems (Specialty 2), Management of organizations
(Specialty 3), and Management of foreign activities
(Specialty 4). There have been 110 respondents.
Their answers are transformed into calculation
matrix (Table 3). The students’ satisfaction estimates
are shown in Table 4.
To confirm results acceptability KR20 reliability
coefficient was calculated. For the fist case-study it
is equal to 0,87 and for the second one to 0,82.
Table 2: Students’ satisfaction estimates (1
st
case-study).
Department Level
Students’ satisfaction
estimate, logits
Standard
error
CAMS
M 3,67 1,81
B 1,42 0,87
SM
M 3,67 1,81
B 0,77 0,78
SA&M
M 2,35 1,1
B 2,35 1,1
Table 3: Calculation matrix X (2
nd
case-study).
Question
Specialties
1 2 3 4
1 1 1 0 1
2 0 1 1 1
3 1 1 1 1
4 1 0 0 1
5 1 1 1 0
6 0 0 1 1
7 1 1 1 1
8 1 1 0 1
9 1 0 1 1
10 1 1 1 0
11 1 1 1 1
12 1 1 1 0
13 0 1 1 1
14 1 1 0 1
15 1 1 1 0
16 1 1 0 0
17 1 1 0 0
18 1 1 0 1
19 0 1 1 1
TOWARDSHIGHEREDUCATIONQUALITYASSESSMENT-FrameworkforStudentsSatisfactionEvaluation
111
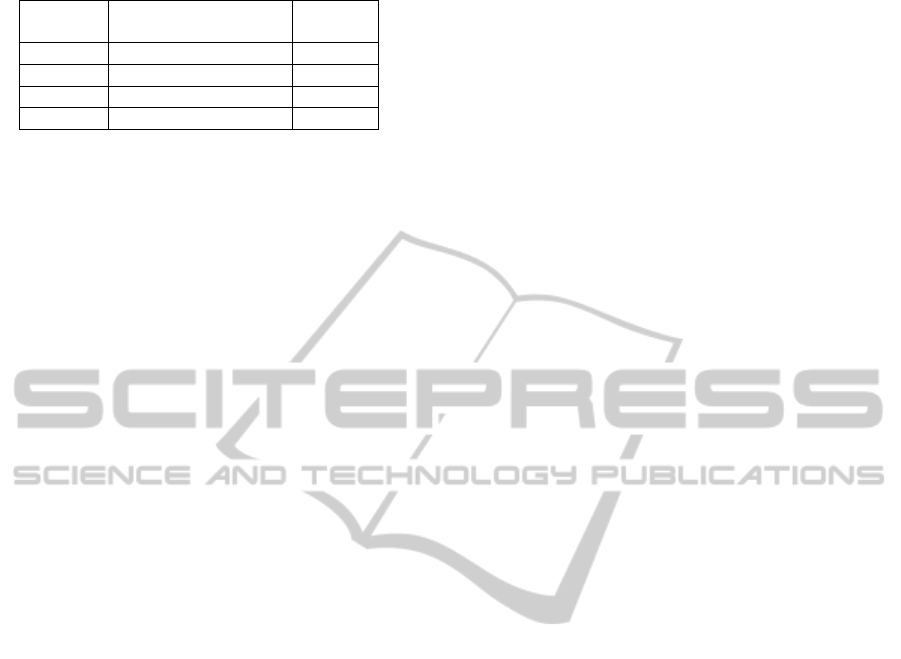
Table 4: Students’ satisfaction estimates (2
nd
case-study).
Specialty
Students’ satisfaction
estimate, logits
Standard
error
1 1,16 0,59
2 1,54 0,66
3 0,26 0,53
4 0,53 0,26
6 CONCLUSIONS AND FUTURE
WORK
The given work presents an approach of students’
satisfaction evaluation which is a part of education
quality assessment in HEE. The suggested
framework is based on survey method. One of the
quality management postulates states that if we need
to assess service quality we should ask the
consumers about it. Therefore the presented
approach uses the transformed questionnaire to ask
students about their opinion concerning university’s
education quality. To be confident in obtained
results the number of respondents should be big
enough. The obtained estimates of students’
satisfaction rely on statistical data processing which
provides all advantages of statistical methods.
The elaborated Information System of Education
Quality Assessment can be applied in several ways.
The estimates obtained can be used as the
parameters of monitoring of students’ satisfaction in
quality management system of HEE. These
estimates can be used for building a strategy of HEE
development.
The comprehensive estimate of education quality
must take into account opinions of different
stakeholders. Education quality assessment from
students’ point of view must be a part of this
comprehensive estimate.
The suggested approach provides surveys
conduction and students’ satisfaction estimates
calculation. This IS can work as independent
software or it can be integrated into the monitoring
information system.
Future researches are supposed to be conducted
in the direction of formalization the processes of
higher education quality assessment from the point
of view of different stakeholders.
REFERENCES
Amrita University Management System. Retrieved
October 14, 2011 from http:// www.amritatech.com/
modulesinamritavidya.htm.
Barker C., Pistrang N. and Elliott R. (2002). Research
Methods in Clinical Psychology. An Introduction for
Students and Practitioners (2
nd
ed.). Atrium: Wiley.
Borisova I. I. (2007). Systems of Education Quality
Assessment: The Search of Effective Model. Retrieved
November 10, 2011 from http://www.quality.edu.ru/
quality/sk/param/738.
European Training Foundation (2004). Management in
Vocational Education and Training. Module III –
Quality Management. Luxemburg: Publication Office
of European Union.
Kachalov V. A. (2001). ISO 9000 Standards and
Problems of Quality Management in HEE (Notes of
Quality Manager). Moscow: IzdAT.
Koenig J. A. (2011). Assessing 21
st
Century Skills:
Summary of a Workshop. Washington, D.C.: The
National Academies Press.
Lowenthal J. N. (2002). Six Sigma Project Management:
A Pocket Guide. Milwaukee: ASQ Quality Press.
Maslak A. A., Karabatsos G., Anisimova T. S., Osipov S.
A. (2005). Measuring and Comparing Higher
Education Quality between Countries Worldwide.
Journal of Applied Measurement, 6(4), 432-442.
OECD (Organisation for Economic Co-operation and
Development) (2002). Glossary of Key Terms in
Evaluation and Results-Based Management. Paris:
OECD/DAC.
Okes D. and Westcott R.T. (2000). The Certified Quality
Manager Handbook (2
nd
ed.). Milwaukee: ASQ
Quality Press.
Oliveira O.J. and Ferreira E.C. (2009). Adaptation and
Application of the SERVQUAL Scale in Higher
Education. POMS 20
th
Annual Conference, Orlando,
Florida USA.
Parasurman A., Zeithaml V., Berry L. (1985). A
Conceptual Model of Service Quality and Its
Implications for Future Research. Journal of
Marketing, 49, 41-50.
Predvoditeleva M.D. and Balayeva O.N. (2005).
Approaches for Service Quality Management: a Focus
on the Consumer. Management in Russia and Abroad,
2, 90-100.
Reeve B. (2009). An Introduction to Modern Measurement
Theory. Retrieved November 1, 2011 from
http://moaweb.nl/bibliotheek/materiaal-
bijeenkomsten-1/ 2009/pretesten-van-vragenlijsten-23-
juni.html.
Steyer R., Smelser N. J., Jena D. (2001). Classical
(Psychometric) Test Theory. Elsevier Science.
University Management System – UMS. Retrieved
October 13, 2011 from http://www.techxact.com/
university-management-system-ums.html.
Wright B. and Stone M. (1999). Measurement Essentials
(2
nd
ed.). Wilmington: Wide Range Inc.
CSEDU2012-4thInternationalConferenceonComputerSupportedEducation
112
