
A SOFTWARE PLATFORM TO ANALYZE MR IMAGES
BASED ON 3D FRACTAL DIMENSION
Application in Neurodegenerative Diseases
J. Jiménez
1
, A. M. López
1
, F. J. Esteban
2
, P. Villoslada
3
, J. Navas
4
and J. Ruiz de Miras
1
1
Department of Computer Science, University of Jaén, Campus Las Lagunillas s/n, 23071 Jaén, Spain
2
Department of Experimental Biology, University of Jaén, Jaén, Spain
3
Department of Neurology, Hospital Clinic-IDIBAPS, Barcelona, Spain
4
Department of Mathematics, University of Jaén, Jaén, Spain
Keywords: Medical Imaging, Image-based Diagnosis, 3D Fractal Dimension, Multiple Sclerosis, Alzheimer.
Abstract: Previous studies carried out by our group have demonstrated that 3D fractal dimension algorithms detect
changes in apparently normal magnetic resonance (MR) images of the brain in patients suffering early
stages of Multiple Sclerosis. In addition, 3D fractal dimension has also been demonstrated to be useful for
detecting brain abnormalities in other cerebral diseases, as in Alzheimer’s disease and in children born after
intrauterine growth restriction. Thus, 3D fractal dimension detection has been proposed as a valuable and
powerful diagnostic tool. To our knowledge, no user-friendly software is available to obtain the 3D fractal
dimension of volumetric MR images. In this paper, we present an optimized Web platform that allows
computing the 3D fractal dimension value for uploaded MR images in an interactive user-friendly way.
Moreover, and because the computational cost of the involved algorithms is very high for interactive use,
we have focused our efforts on the optimization of the appropriate algorithms using the parallel computing
power of current GPUs and multi-core CPUs.
1 FRACTAL DIMENSION
A geometry object self-similar at different scales is a
fractal. Fractals are described by fractal geometry,
which was first proposed by Benoit Mandelbrot
(Mandelbrot, 1983). In contrast to Euclidean
geometry, where the dimension value is 1 for a line,
2 for a plane and 3 for a volume, fractal dimension
(FD) is a non-integer number that characterizes an
irregular shape. Thus, FD is 1 for a straight line, but
it has a value between 1 and 2 for an irregular line;
however, the Euclidean dimension is 1 for both a
straight line and an irregular one. With this simple
example, we may figure out how the FD describes a
natural object in a better way than Euclidean
dimension does. Fractal theory has also been
proposed as an unifying theory for different results
in biomedical research that previously were
apparently not related among them (West et al.,
1987).
One accepted procedure to obtain the FD of an
object, in a metric space, is the box-counting
method. It is based on cover the object with grids of
boxes with different sizes, and, for each size, to
estimate how many boxes are filled by the object.
(Hou et al., 1990).
2 FRACTAL DIMENSION IN
NEUROLOGICAL DISEASES
The characterization and quantification of the brain
morphology using FD analyses, in health and
disease, is getting increased attention and interest
from the biomedical community. Most recent studies
focus on 2D analyses from individual MR or SPECT
images (Zhang et al., 2008), where the two-
dimensional FD (2DFD) no longer fulfils the
complexity of the structure. To obtain the 2DFD,
general and wide-use image analysis programs are
available, such as ImageJ (http://rsb.info.nih.gov/ij/),
and even others more specific for FD calculation
such as HarFA – Harmonic and Fractal Image
Analysis
(http://www.fch.vutbr.cz/lectures/imagesci/).
554
Jiménez J., M. López A., J. Esteban F., Villoslada P., Navas J. and Ruiz de Miras J..
A SOFTWARE PLATFORM TO ANALYZE MR IMAGES BASED ON 3D FRACTAL DIMENSION - Application in Neurodegenerative Diseases.
DOI: 10.5220/0003892505540559
In Proceedings of the International Conference on Bio-inspired Systems and Signal Processing (MIAD-2012), pages 554-559
ISBN: 978-989-8425-89-8
Copyright
c
2012 SCITEPRESS (Science and Technology Publications, Lda.)

The cortex of the human brain is highly
convoluted, and structural changes in this complex
region has been related to developmental disorders
(for example, epilepsy or cerebral palsy), and also
associated with neurodegenerative diseases such as
Multiple Sclerosis or Alzheimer’s disease. Even
thought some of these alterations are easily detected
in MR and computerized tomography (CT) images,
many of them consists of subtle structural changes
difficult to detect and quantify. As previously
suggested (Fernández and Jelinek, 2001), FD is a
good quantitative descriptor of not only the
convolutions of the cerebral cortex but also the
white matter. Thus, the structural brain
abnormalities taking place in several diseases can be
revealed by changes in its FD (Thompson et al.,
1996; Kiselev et al., 2003; Liu et al., 2003).
Moreover, and as stated before, FD approaches are
particularly useful to detect those subtle changes that
cannot be conventionally identified in MR images
(Free et al., 1996), and to characterize disorders
without an apparent structural abnormality of the
brain matter, such as schizophrenia and obsessive-
compulsive disorders (Ha et al., 2005). Until now,
most studies has been focused to obtain the 2DFD of
MR images of specific coronal sections, and some
authors even did a step ahead developing pseudo-3D
extrapolations. Thus, no so much efforts have been
made in the three-dimensional FD (3DFD) structural
characterization, an approach that may include
relevant information otherwise lost in the study. In
this sense, FD changes of the aged white matter have
been detected both in MR images both at the
pseudo-3D level and in 3D (Zhang et al., 2006;
2007).
Multiple Sclerosis is a neurodegenerative disease
mainly characterized by the appearance of white
matter lesions. The different manifestations of the
disease can be associated with its progression and,
because the onset of symptoms and the development
of visible damages in the MR images are related, an
early detection of the structural alterations of the
brain are crucial for clinical making decision
including an appropriate treatment. The most critical
to detect are the early stages of Multiple Sclerosis, in
which the white matter appears as apparently normal
in the MR images, even thought some of the
underlying cellular and molecular processes are
taking place (inflammatory cellular infiltration,
axonal degeneration and even gliosis).
Magnetization transfer imaging has been proposed
as a promising method for detecting changes in
apparently normal white matter in Multiple
Sclerosis. However, this method not only shows
some contradictory results in terms of their
sensitivity, but it is also expensive and difficult to be
included in the daily clinical diagnostic procedures
in most hospitals (Filippi et al., 1999). Our research
group has recently demonstrated that changes in
both the white matter (Esteban et al., 2007) and grey
matter (Esteban et al., 2009) are well-characterized
by the FD (2D and 3D respectively) using MR
images which are apparently normal in early stages
of Multiple Sclerosis. This approach has been
proposed as an useful tool for an early diagnostic of
the disease and, therefore, clinical decision making.
In addition, we have also detected changes in the
3DFD of the brain in one year-old children who had
intrauterine growth restriction (IUGR), when
compared with premature infants without IUGR and
full-term controls (Esteban et al., 2010).
3 COMPUTER GRAPHICS,
VOLUME MODELLING AND
ALGORITHM OPTIMIZATION
WITH GPU
Volume modelling is an important area of Computer
Graphics. Volume modelling gives solutions based
on the description of the volume occupied by the
represented objects, instead of the traditional
representation based on the surface. An important
effort to provide biomedical applications is being
developed in this area, mainly in 3D modelling and
visualization of scientific data obtained from
techniques such as CT, MR imaging or microscopy
(Muraki and Kita, 2006).
Just as the pixel is the basic element in a 2D
image, the voxel is the basic unit for representing 3D
volumes. Thus, volume modelling focuses on
providing techniques related to the construction,
processing and display of real structures by using
voxels. As commented above, the most generally
accepted approach for calculating the 2DFD is the
so-called box-counting method. Following the same
principles, calculating the 3DFD implies the
construction of the volumetric representation (using
voxels) of the objects that are being studied.
The typical way to obtain volumetric
representations from a set of medical MR or CT
images is to construct a 3D matrix by stacking Z
images of X x Y pixels each. From this 3D matrix,
there are a wide variety of algorithms to display,
processing or reconstruction of the region of interest
in each case study (Muraki and Kita, 2006; Lorensen
and Cline, 1987).
A SOFTWARE PLATFORM TO ANALYZE MR IMAGES BASED ON 3D FRACTAL DIMENSION - Application in
Neurodegenerative Diseases
555
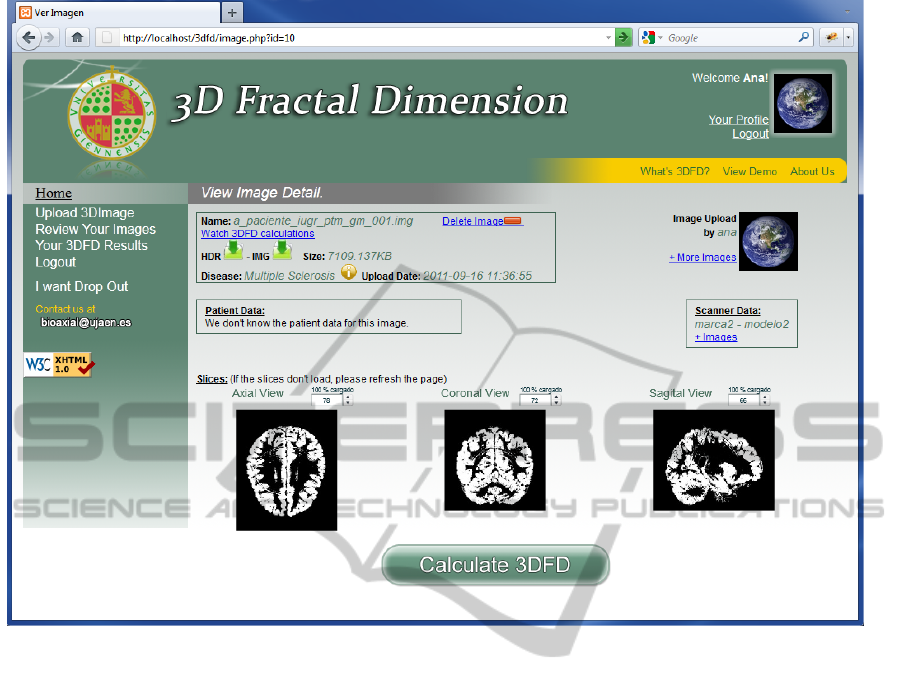
Figure 1: 3DFD web application. Brain data uploaded to the server.
There are alternative representations for a 3D
volume that maintain their topologic essence and are
more compact, such as the so-called skeletons. This
representation may allows an accurate classification
of the represented volume (Cornea et al., 2007).
The computational cost of the algorithms that
process 3D volumes is usually very high, especially
when acceptable levels of precision are required.
Thus, the searching for efficient solutions is crucial
to provide interactivity to user-friendly applications.
The ability to program the Graphics Processing
Units (GPUs) of any current mid-range PC has
revolutionized many fields where high
computational cost algorithms are required (Owens
et al., 2007). The evolution of these GPUs and their
low cost, especially compared with traditional
parallel computers, place them as one of the most
interesting solutions when the programmer wants to
optimize data-parallel algorithms.
Many volume modelling algorithms are based on
performing independent operations on each voxel.
For these cases, applying GPU-based optimizations
is very suitable. Iso-surface extraction algorithms,
segmentation of medical images, or interactive
visualization of volumes are examples of such
algorithms (Stone et al., 2008; Fan et al., 2008).
GPU programming is based on the classic
graphic display pipeline. However, using the GPU to
code algorithms that are not related with graphics
may be quite complicated, since it requires
knowledge of the architecture and the operation of
the graphic processor. For this reason, several GPU
programming paradigms, that do not require any
knowledge of graphics, have recently emerged.
NVIDIA CUDA (Luebke, 2008) and OpenCL
(Khronos group, 2010) stand out among these new
paradigms. These programming models exploit the
inherent GPU parallelism by writing simple
programs (threads) running into hundreds of
thousands of parallel invocations on the GPU. There
are many examples of successful use of GPU
optimization in the biomedical area (with
improvements in time between x10 and x100), such
as CT reconstruction or interactive MR imaging
visualization (Xu and Mueller, 2007; Zhao et al.,
2009).
BIOSIGNALS 2012 - International Conference on Bio-inspired Systems and Signal Processing
556
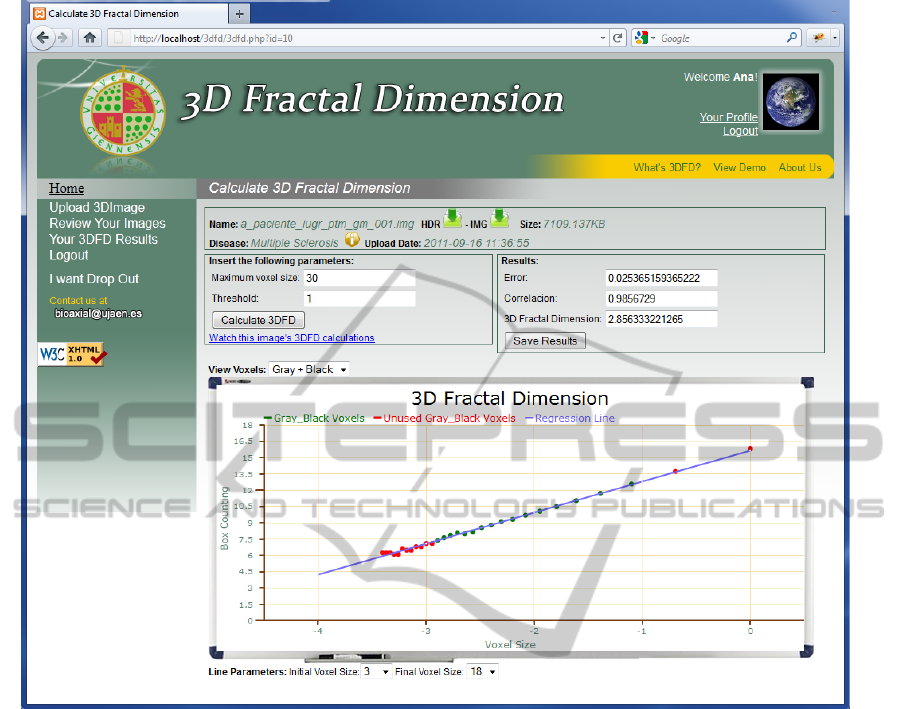
Figure 2: 3DFD web application. Box-counting and 3DFD calculation.
4 A SOFTWARE PLATFORM TO
CALCULATE THE 3DFD OF
MR IMAGES
A general software to compute the 3DFD of MR
images has been developed by our research group in
previous studies, which has become a very useful
and high social-interest tool (Ruiz de Miras et al.,
2011). The different exiting hardware and software
platforms to obtain the MR images, the wide profile
of potential users of the software, and the need for
constant maintaining and updating in this kind of
programs, imply that the software has to be made
available to the scientific community in the most
flexible and user-friendly way. Thus, we have
decided to integrate our software into a Web
platform, a project with the aim of providing a
universal access through a simple Web browser. A
Web platform instantly gives the user the latest
version of the software and, when correctly related
to a database, a large number of medical images,
uploaded by different users, can be collected,
classified and analyzed, which otherwise cannot be
accessed to and managed.
Figure 1 and Figure 2 shows sample snapshots of
our developed web platform. In the first one, the
main data of an uploaded 3D image, including the
set of slices, is showed. The interactive computation
of the 3DFD for the uploaded 3D image is showed
in Figure 2. The obtained results are represented in
the scattered graphic for slope analysis, allowing us
to discard the initial and final points out of linearity.
The final value of 3DFD is the slope of the resulting
regression line, which can be directly stored by
pushing the "Save Results" button. The value of the
box-counting and image segmentation input
parameters (maximum voxel size and threshold,
respectively) can also be tuned, thus obtaining
different 3DFD values which can also be also stored
A SOFTWARE PLATFORM TO ANALYZE MR IMAGES BASED ON 3D FRACTAL DIMENSION - Application in
Neurodegenerative Diseases
557
in the database.
The computational cost of the different
algorithms needed to calculate the 3DFD is very
high, which is a handicap when interactivity and
fast feedback to the user are essential, as in data
analysis Web platforms. The algorithms required in
the engine are those related to volume visualization,
box-counting calculation for different voxel
resolutions and the computation of the curve-
skeleton of the represented 3D image. Because all
these algorithms can be reduced to individual
operations on each voxel of the volume, and taking
into account that these operations can be run in
parallel using the recent hardware and software
platforms based on GPU programming, we have
adapted and improved them to be run on these
massively parallel platforms. Thus, the degree of
interactivity needed to integrate the 3DFD
calculation, in a really useful and user friendly Web
platform, has been achieved.
The most time-consuming algorithm is the
curve-skeleton calculation; in our case we selected
and implemented the thinning approach as the most
appropriate (Palágyi and Kuba, 1999). A 3D curve-
skeleton is a very compact representation of a three
dimensional object, and its 3DFD provides very
good and reliable results.
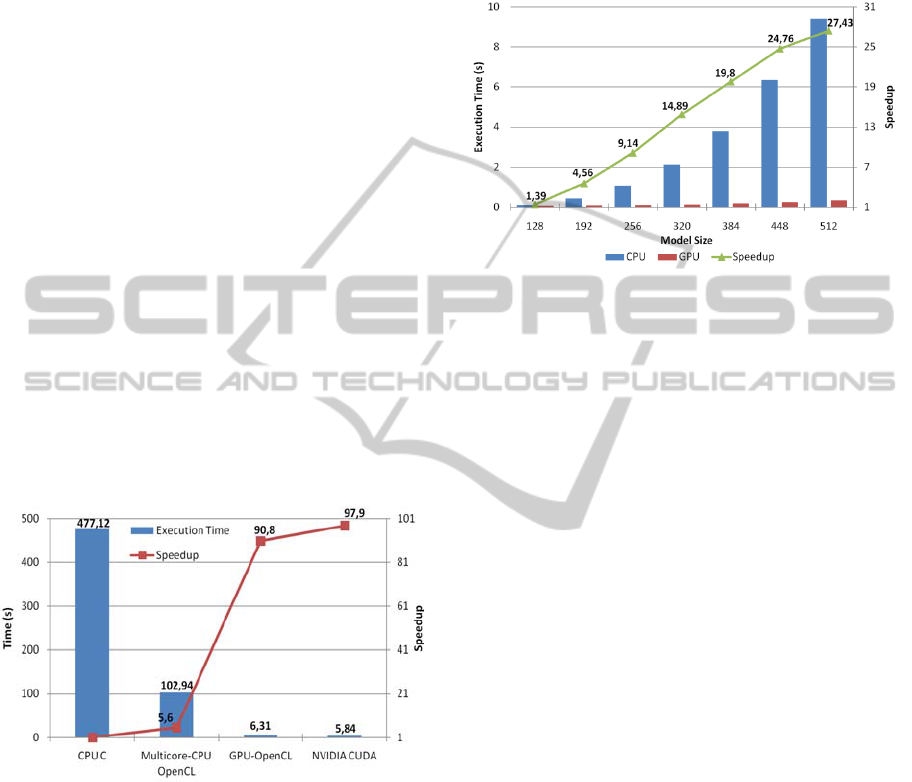
Figure 3: Curve-skeleton generation time and speedup for
executions over 512 x 512 x 512 voxelized models. GPU
executions on the NVIDIA GTX 580. CPU execution on
Intel i7-920, an eight-threaded CPU.
A standard calculation of a 3D skeleton takes
around 8 minutes to be obtained, which is a very
time-consuming process. After the 3D thinning
algorithm multi-threaded implementation, for GPU
and multi-core CPUs, we obtained a substantial
execution-time improvement, when compared to the
traditional mono-threaded version. We used two
parallel programming models: CUDA and OpenCL.
Figure 3 shows the running time of each parallel
version, where the speedup achievement using the
optimized parallel algorithms for the GPU is showed
to be improved 97,9x against the CPU single-
process version, and more than 19x over the CPU
multithreaded version, being this two interesting
results.
Figure 4: Box-Counting optimization. C-CPU algorithm
(mono-threaded) vs. CUDA-GPU algorithm (multi-
threaded). Execution time and speedup.
We have also designed and implemented a
parallel optimized version of the box-counting
algorithm. This algorithm run faster in CPU than the
curve-skeleton calculation, taking just a few
seconds, which may be considered a good execution
time. However, the execution time may be tediously
longer when performing the box-counting
calculation on a set of n case studies. In addition, the
segmentation threshold (which is an input parameter,
as seen in Figure 2) may need to be tuned and, thus,
several runs have to be executed using different m
threshold values. Thus, the execution time has to be
multiplied by n and m in the simplest case. Figure 4
shows the CUDA implementation runtime of the
box-counting algorithm. The obtained results
detected an average 27-fold improvement for the
best case, thus decreasing the execution time from
around 28 seconds to only one second when using
the highest model of resolution (512 x 512 x 512
pixels).
5 CONCLUSIONS
We have developed effective and efficient
algorithms to obtain the FD from 3D images,
obtaining a complete brain characterization. These
algorithms have been drastically optimized and
implemented in a user-friendly Web platform that
currently is in the last stage of testing by our
research group and selected medical staff. This
advanced platform will be available soon to the
scientific community and we hope it may be a useful
BIOSIGNALS 2012 - International Conference on Bio-inspired Systems and Signal Processing
558

tool for early diagnosis of several neurodegenerative
diseases.
ACKNOWLEDGEMENTS
This work has been partially supported by the
University of Jaén, the Caja Rural de Jaén, the
Andalusian Government and the European Union
(via ERDF funds) through the research projects
UJA2009/13/04 and PI10-TIC-5807.
REFERENCES
Mandelbrot B. B., 1983. The Fractal Geometry of Nature.
W. H. Freeman and company
West B. J., Goldberger A. L., 1987. Physiology in fractal
dimensions. Am. Sci. 75, 354-365.
Hou X., Gilmore R., Mindlin G. B., Solari H. G., 1990. An
efficient algorithm for fast O(N/log N) box counting.
Phys-Lett-A. 151, 43-46.
Zhang L., Butler A. J., Sun C. K., Sahgal V., Wittenberg
G. F., Yue G. H., 2008. Fractal dimension assessment
of brain white matter structural complexity post stroke
in relation to upper-extremity motor function. Brain
Research 1228, 229-240.
Fernández, E., Jelinek, H. F., 2001. Use of fractal theory
in neuroscience: Methods, advantages, and potential
problems. Methods 24, 309-321.
Thompson, P. M., Schwartz, C., Lin, R. T., et al., 1996.
Three-dimensional statistical analysis of sulcal
variability in the human brain. J Neurosci 16, 4261-
4274.
Kiselev, V. G., Hahn, K. R., Auer, D. P., 2003. Is the brain
cortex a fractal? Neuroimage 20, 1765-1774.
Liu, J. Z., Zhang, L. D., Yue, G. H., 2003. Fractal
dimension in human cerebellum measured by
magnetic resonance imaging. Biophys J 85, 4041-
4046.
Free S L, Sisodiya S. M., Cook M. J., Fish D R, Shorvon
S.D., 1996. Three-dimensional fractal analysis of the
white matter surface from magnetic resonance images
of the human brain. Cerebral Cortex 6, 830-836.
Ha T. H., Yoon U., Lee K. J., Shin Y. W., Lee J. M., Kim
I. Y., Ha K. S., Kim S. I,. Kwon J. S., 2005. Fractal
dimension of cerebral cortical surface in schizophrenia
and obsessive-compulsive disorder. Neurosci Lett
384,172-6.
Zhang L., Liu J. Z., Dean D., Sahgal V., Yue G. H., 2006.
A three-dimensional fractal analysis method for
quantifying white matter structure in human brain.
Journal of Neuroscience Methods 150, 242-253.
Zhang L., Dean D., Liu J. Z., Sahgal V., Wang X., Yue G.
H., 2007. Quantifying degeneration of white matter in
normal aging using fractal dimension. Neurobiology of
Aging 28, 1543-1555.
Filippi M, Iannucci G, Tortorella C., 1999. Comparison of
MS clinical phenotypes using conventional and
magnetization transfer MRI. Neurology 52, 588–594.
Esteban F. J., Sepulcre J., Vélez de Mendizábal N., Goñi
J., Navas J., Ruiz de Miras J., Bejarano B., Masdeu J.
C., Villoslada P., 2007. Fractal dimension and white-
matter changes in multiple sclerosis. NeuroImage 36,
543-549.
Esteban F J, Sepulcre J, Ruiz de Miras J, Navas J, Vélez
de Mendizábal N, Goñi J, Quesada J M, Bejarano B,
Villoslada P., 2009. Fractal dimension analysis of grey
matter in multiple sclerosis.
Journal of the
Neurological Sciences 282, 67-71.
Esteban F. J., Padilla N., Sanz-Cortés M., Ruiz de Miras
J., Bargalló N., Villoslada P., Gratacós E., 2010.
Fractal-dimension analysis detects cerebral changes in
preterm infants with and without intrauterine growth
restriction. NeuroImage 53, 1225-1232.
Muraki S., Kita Y., 2006. A survey of medical
applications of 3D image analysis and computer
graphics. Systems and Computers in Japan 37, 13-46.
Lorensen W. E., Cline, H. E., 1987. Marching Cubes: A
high resolution 3D surface construction algorithm.
ACM Computer Graphics 21, 163-169.
Cornea N D, Silver D, Min P., 2007. Curve-skeleton
properties, applications and algorithms. IEEE
Transactions on Visualization and Computer Graphics
13, 530-548.
Owens J. D., Luebke D., Govindaraju N., Harris M.,
Kruger J., Lefohn A. E., Purcell T. J., 2007. A Survey
of General-Purpose Computation on Graphics
Hardware. Computer Graphics Forum 26, 80-113.
Stone S. S., Haldar J. P., Tsao S. C., Hwua W., Sutton B.
P., Liang Z. P., Purcell T. J., 2008. Accelerating
advanced MRI reconstructions on GPUs. Journal of
Parallel and Distributed Computing 68, 1307-1318.
Fan Z, Mei X., 2008. Real-time Medical Image Volume
Rendering Based on GPU Accelerated Method..
International Symposium on Computational
Intelligence and Design, 30-33.
Luebke D., 2008. CUDA: Scalable Parallel Programming
For High-Performance Scientific Computing. 5th
IEEE International Symposium, 836 – 838.
Khronos OpenCL Working Group, 2010. The OpenCL
Specification, version 1.1.
Xu F., Mueller K., 2007. Real-Time 3D Computed
Tomographic Reconstruction Using Commodity
Graphics Hardware. Physics in Medicine and Biology
52, 3405-3417.
Zhao Y., Cui X., Cheng Y., 2009. High-Performance and
Real-Time Volume Rendering in CUDA. In BMEI '09.
2nd International Conference on Biomedical
Engineering and Informatics.
Ruiz de Miras J., Navas J., Villoslada P. and Esteban F. J.,
2011. UJA-3DFD: A Program to Compute the 3D
Fractal Dimension from MRI Data. Computers
Methods and Programs in Biomedicine, 104, 452 -
460.
Palágyi K., Kuba A., 1999. A Parallel 3D 12-Subiteration
Thinning Algorithm. Graphical Models and Image
Processing 61, 199-221.
A SOFTWARE PLATFORM TO ANALYZE MR IMAGES BASED ON 3D FRACTAL DIMENSION - Application in
Neurodegenerative Diseases
559
