
VISUALIZATION OF MEASURED AND ESTIMATED
NETWORK CHARACTERISTICS OF THE INTERNET
Masahito Shiba
Faculty of Science and Technology, Ryukoku University, Otsu, Japan
Keywords:
Visualization, Network Characteristics.
Abstract:
Information provided by research on the measurement and estimation of network characteristics of the Inter-
net is vast; therefore, it is difficult to understand and analyze it. We developed a system that includes tools to
analyze and visualize both measured and estimated network characteristics of the Internet in order to obtain
useful information from these characteristics. Our tools can process large amount of data on network charac-
teristics that were preliminarily measured and estimated. The tools use geographic information for analysis
and visualization; users can add codes and extend the functions of analysis and visualization. Moreover, users
can easily analyze and visualize the network characteristics of the Internet for various purposes. This paper
describes the visualization of network characteristics of the Internet by the tools.
1 INTRODUCTION
There are numerous studies on the measurement of
the network characteristics of the Internet. Because
it is difficult to measure the characteristics of all net-
work links and nodes on the Internet, these studies
measure the network characteristics of some of the
links and estimate the network characteristics of oth-
ers by using the measured characteristics. Most of the
studies concentrate on performing measurement and
estimation correctly; therefore, techniques for analyz-
ing the measured and estimated data and effectively
utilizing them are not adequately studied. Because
the measured and estimated data on the network char-
acteristics of the Internet is vast, it is difficult to un-
derstand and analyze this data.
We developed a system that includes tools to an-
alyze and visualize the network characteristics of the
Internet in order to reveal useful information. This
system has the following features:
• It analyzes and visualizes large amount of data of
the network characteristics that are preliminarily
measured and estimated.
• It can process network characteristics by using lo-
cations of nodes.
• Users can easily extend the functionality of anal-
ysis and visualization.
Most tools for visualizing network informationare
used to monitor networks, detect abnormalities, and
collect statistical information. With such tools, it is
important to analyze packet transmission in real time.
However, because the Internet has a large number of
nodes, it is difficult to process the measured data in
real time. Therefore, it is important to analyze the
data using various methods for investigating the net-
work characteristics of the Internet.
In a network that has nodes spread over a wide
area such as the Internet, distances between nodes
have considerable impact on network characteristics.
Our system uses geographic information for analyz-
ing and visualizing network characteristics.
The system supports various uses by allowing
users to freely set visualization styles. Moreover,
users can add codes for visualizing data and extend
system functionality so that they can easily analyze
and visualize network characteristics for various pur-
poses.
2 NETWORK
CHARACTERISTICS
2.1 Visualization
Various studies on visualization of network informa-
tion proposed several systems; these systems have the
following features as the key functions of visualiza-
tion:
772
Shiba M..
VISUALIZATION OF MEASURED AND ESTIMATED NETWORK CHARACTERISTICS OF THE INTERNET.
DOI: 10.5220/0003865807720775
In Proceedings of the International Conference on Computer Graphics Theory and Applications (IVAPP-2012), pages 772-775
ISBN: 978-989-8565-02-0
Copyright
c
2012 SCITEPRESS (Science and Technology Publications, Lda.)

• Monitoring network packets and displaying their
information in real time.
• Providing statistical graphs of network traffic
among nodes.
These features are important and useful for man-
aging networks. However, these features are not well
suited for analyzing the characteristics of a network
having nodes spread across a wide area such as the
Internet. Our proposed system has the following fea-
tures:
• It supports networks having many nodes physi-
cally spread across a wide area.
• It is browser-based and applicable in various en-
vironments.
• Its functions are sufficiently flexible, and thus can
be used for various purposes.
Because there are many nodes on the Internet,
the number of network links among these nodes that
need to be managed and analyzed is extremely large.
Our system can manage data from a large number
of links and can provide graphs of the data pertain-
ing to specific nodes according to user demands. In
a widespread network such as the Internet, the loca-
tions of nodes are important information. Our system
has a function for displaying nodes on a map, thus al-
lowing users to visually understand geographical re-
lationships among the nodes.
Although some existing systems can display net-
work informationon a map (Wawrzoniak et al., 2004),
their functions do not sufficiently support the analysis
of network characteristics. On the other hand, net-
work managers, network researchers, and internet ap-
plication developers require different information on
network characteristics. Assuming them as users, the
proposed system has various functions for analyzing
network characteristics. The functions of this system
include displaying information and providing graphs
in various forms; therefore, the system can flexibly
support demands of different users as well as can be
applied in various desktop and mobile environments.
2.2 S3
We used the network characteristics data collected by
S3 (a scalable sensing service) (Yalagandula et al.,
2006) that runs on PlanetLab. S3 is a system for
measuring a wide area network; it measures the In-
ternet using the nodes of PlanetLab. In the S3 sys-
tem, software components called sensor pods run on
each node and measure the characteristics of the links
among the nodes. Each sensor pod has modules that
measure various parameters such as latency, loss, and
bandwidth(Sharma et al., 2006; Ribeiro et al., 2003;
Strauss et al., 2003; Mahajan et al., 2003). The sen-
sor pods run their modules at appropriate periods and
perform the necessary measurement.
All sensor pods work in cooperation, and the in-
formation measured by them is collected by the S3
server. In addition, the S3 server estimates network
characteristics. For latency, as an example, the S3
system does not measure the latencies of all links;
it measures the latencies of only a part of the links
and estimates the latencies of other links by using the
measured latencies.
3 VISUALIZATION
Because information on the network characteristics
measured and estimated by S3 is vast, it is difficult
for users to intuitively understand it. In addition,
since the network characteristics of the Internet have
not been extensively researched, the measured or esti-
mated data are not sufficiently analyzed. Therefore, it
is difficult to directly obtain useful information from
the measured or estimated data, and the data of the
characteristics obtained from existing research are not
practically used. As a result, because no effective
method has been established to obtain valuable infor-
mation on network characteristics, it is important to
understand the data and reveal whatever valuable in-
formation can be obtained. We have developed a sys-
tem for visualizing the measured and estimated net-
work characteristics of the Internet.
3.1 Display on a World Map
Our system has a database of the network characteris-
tics preliminarily measured or estimated and tools for
visualizing them. Figure 1 shows a tool of the system
that visualizes the network characteristics on a world
map. This tool displays the locations of source and
destination nodes and the links between them using
Google Maps. This tool has the following features:
• Users can see geographical relationships among
nodes.
• Users can select a node and see measured and es-
timated data on the basis of the selected node.
• Users can use the tools in various environments.
To understand the characteristics of a network in
which nodes are spread across a wide area such as
the Internet, consideration of node locations is impor-
tant. This is because the distances between nodes can
be exceedingly long and can affect the performance
of network links; some of the links are spread across
VISUALIZATION OF MEASURED AND ESTIMATED NETWORK CHARACTERISTICS OF THE INTERNET
773
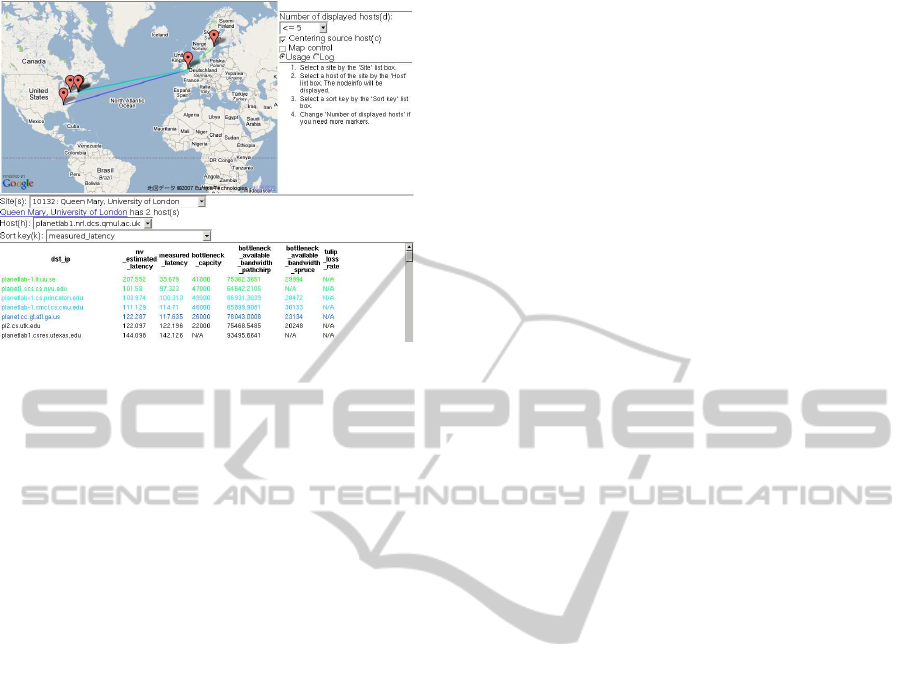
Figure 1: Nodes and links displayed on the world map.
national boundaries and seas. In addition, geograph-
ical locations of the nodes should be considered for
understanding the measured and estimated character-
istics of their links. Our tool enables users to easily
see geographical relationships among nodes by dis-
playing the nodes and their links on a world map.
Moreover, this tool can display a table that lists the
measured and estimated characteristics of all links of
a source node that is specified by a user. The user
can sort data with respect to various parameters such
as latency or bandwidth, and the tool can display the
results of the best links on the map. Owing to this
function, users can easily see the measured and esti-
mated characteristics of the links on the basis of spe-
cific nodes along with geographic information.
In addition, another advantage of the tool is that
it can be run in various environments. The tool is
written in JavaScript, and users can run it by using
their web browsers. Most of the popular environments
have web browsers that can run JavaScript; therefore,
users can use the tool in most of the environments.
Users can access the web page and the script of the
tool from a web server. In addition, the tool gets data
of the network characteristics from the web server.
Therefore, only web browsers are required to use the
tool. Because most environments have web browsers,
in most cases, users can run the tool and visualize the
network characteristics without any preparation.
3.2 Display of More Detailed
Information
We developed another tool for analyzing and visual-
izing the measured and estimated network character-
istics in detail using Squeak. This visualization tool
allows users to add codes and extend the functional-
ity of analysis and visualization. The users can easily
add their code by using the environment provided by
Squeak. Moreover, because a Squeak plugin enables
popular browsers to run Squeak programs, the tools
can be run in many environments.
Although the measured and estimated network
characteristics of the Internet are valuable for network
managersand Internet application developers, they re-
quire different parts of these large data in different
forms. The tool allows users to freely define the form
of displaying the network characteristics and provides
application flexibility for various purposes. For ex-
ample, there are certain types of graphs and tables
that can be displayed as units and users can freely
arrange them in a window of the tool. These units
are called views (Figure 2). Following types of views
are available: System information, Node information,
Histogram of all links, Filtered link graph, Node list,
Link table, Spiral graph, Closest node set graph, Grid
graph, Histogram, and Node correlation.
System Information is a view that displays infor-
mation about the tool and the visualized data such
as the number of links measured and estimated and
the number of sites and nodes used for measurement.
Node information displays detailed information about
a node such as host name, IP address, and its site.
Histogram of All Links is a view that displays a
histogram of the measured or estimated network char-
acteristics of the Internet. Because data of all links are
displayed, users can see the state and trend of the en-
tire network.
Filtered Link Graph is a view that displays the
links that satisfy a condition of the network character-
istics specified by the user. The links are displayed in
a graph and users can easily see the size of the param-
eters. For example, when Filtered link graph draws
nodes and links using latency, the nodes are arranged
as distances between the nodes in the graph and are
proportional to the latencies between the nodes. Users
can see these latencies intuitively by examining the
lengths of the lines between the nodes.
In addition to displaying information of the entire
network, the tool can display the network characteris-
tics of an individual node selected by a user in detail.
Node List is a view that displays host names of all
nodes, and users can easily select a node in this view.
Link Table is a view that displays the network
characteristics of the links whose source node se-
lected by the user in a tabular form. The user can
sort data with respect to latency and bandwidth and
can easily see the nodes that have good links with the
source node.
Spiral Graph is a view that displays the links be-
tween a specified source node and the destination
nodes that have the best links with the source node in
IVAPP 2012 - International Conference on Information Visualization Theory and Applications
774
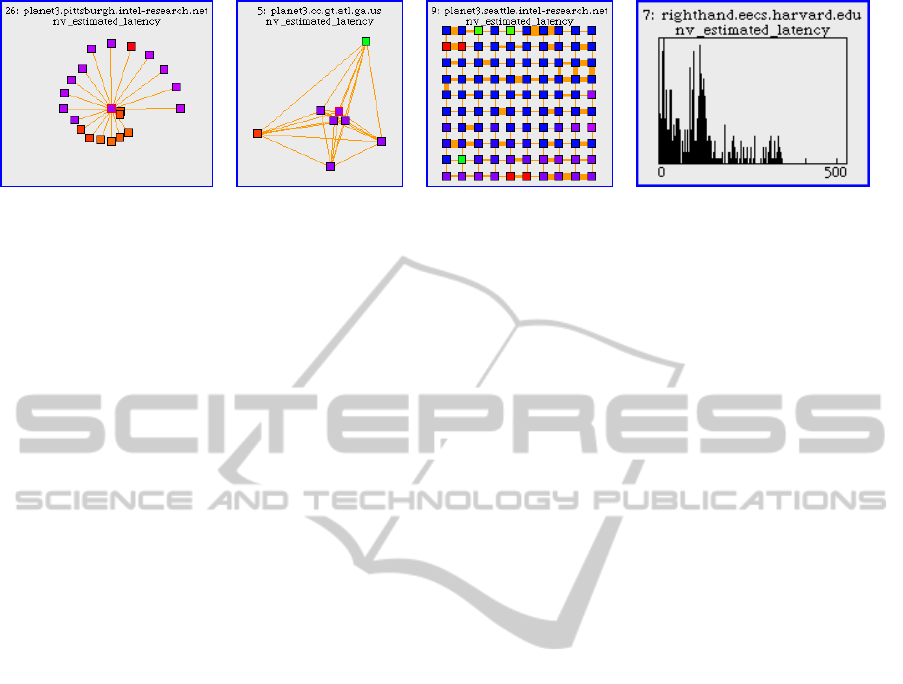
Spiral graph. Grid graph. Closest node set graph. Histogram.
Figure 2: Views.
a spiral form. Nodes are drawn as boxes and are color-
coded according node locations. Users can intuitively
see that the nodes of similar colors are closely located.
Users can select a parameter to extract good links and
set the number of links to be drawn in the graph. The
source node is arranged at the center of the graph and
the distances between the source node and each desti-
nation node are set according to the network charac-
teristics. For example, for the case in which latency
is used for the evaluation of links, a destination node
that has a small latency link with the source node is
drawn close to the source node. The destination nodes
are sorted by the network characteristics and arranged
on the graph in a spiral form.
Closest Node Set Graph is a view that displays
the graph of a specified node and some nodes that
have the best links with the specified node. The dis-
tances between each node are calculated according
to network characteristic parameters such as latency
and bandwidth, and the nodes are arranged according
to the calculated distances between them. Users can
change the parameters to calculate distances and the
number of nodes to be displayed.
Grid Graph is a view that displays the graph of
nodes that have good links in a grid form. This view
draws nodes starting with a node specified by the user
and arranges other nodes with the best link side by
side. The evaluation of links is expressed by the thick-
ness of the lines that connect the nodes. For example,
lines of small latency links are thick.
Histogram displays all the links of a specified
source node. Users can select a parameter to display,
such as latency or bandwidth. Although some views
such as spiral graph display only a part of the links
of a specified source node, histogram displays all the
links of a specified source node, and users can easily
see the state and trend of the links of the node.
Node Correlation is a view that displays correla-
tions between a specified node and other nodes. Users
can select a parameter to calculate correlations, such
as latency or bandwidth. It is believed that nodes with
strong correlations are closely located.
Users can arrange these views in the window of
the tool and visualize the network characteristics in
various ways. Because of this flexibility, the tool can
be used by users for different purposes
4 CONCLUSIONS
This paper describes the tools of system for analyz-
ing and visualizing the network characteristics of the
Internet. The tools of the system can process large
amount of data on network characteristics that were
preliminarily measured and estimated. The tools use
geographic information for analysis and visualization
and enable users to add codes and extend the function-
ality of tools of the system. Users can easily analyze
and visualize the network characteristics of the Inter-
net for various purposes.
REFERENCES
Mahajan, R., Spring, N., Wetherall, D., and Anderson, T.
(2003). User-level internet path diagnosis. SIGOPS
Oper. Syst. Rev., 37:106–119.
Ribeiro, V. J., Riedi, R. H., and Cottrell, L. (2003). path-
chirp: Efficient available bandwidth estimation for
network paths.
Sharma, P., Xu, Z., Banerjee, S., and Lee, S.-J. (2006). Es-
timating network proximity and latency. SIGCOMM
Comput. Commun. Rev., 36(3):39–50.
Strauss, J., Katabi, D., and Kaashoek, M. F. (2003). A
measurement study of available bandwidth estimation
tools. In Internet Measurment Conference, pages 39–
44. ACM.
Wawrzoniak, M., Peterson, L., and Roscoe, T. (2004).
Sophia: an information plane for networked systems.
SIGCOMM Comput. Commun. Rev., 34(1):15–20.
Yalagandula, P., Sharma, P., Banerjee, S., Basu, S., and Lee,
S.-J. (2006). S3: a scalable sensing service for mon-
itoring large networked systems. In INM ’06: Pro-
ceedings of the 2006 SIGCOMM workshop on Inter-
net network management, pages 71–76, New York,
NY, USA. ACM Press.
VISUALIZATION OF MEASURED AND ESTIMATED NETWORK CHARACTERISTICS OF THE INTERNET
775
