
AUTOMATED DETECTION OF INTERPHASE AND METAPHASE
NUCLEI IN THE FISH IMAGES
Jan Schier
1
, Bohumil Kov
´
ar
1,2
and Eduard Koc
´
arek
3
1
Institute of Information Theory and Automation of the ASCR
Pod vod
´
arenskou ve
ˇ
z
´
ı 4, Prague, Czech Republic
2
Faculty of Transportation Sciences, Department of Applied Mathematics, Czech Technical University in Prague
Na Florenci 25, Prague, Czech Republic
3
Department of Biology and Medical Genetics, 2nd Faculty of Medicine, Charles University Prague
V
´
Uvalu 84, Prague, Czech Republic
Keywords:
FISH analysis, Fluorescence microscopy, Image analysis, Image segmentation.
Abstract:
The fluorescence in-situ hybridization (FISH) belongs to the most common cytogenetic methods and is widely
applied in routine clinical genetic diagnostics. We are paying attention to FISH analysis of chromosomal ane-
uploidies – the deviations from chromosomal number. Such analysis is based on evaluation of up to several
hundreds of microscopic images. Computer support for this process includes using methods of image process-
ing and data mining. In this paper, we focus on the image processing part in more detail: first, the properties
of FISH images are reviewed, then, the processing flow is outlined. Our aim is to find the interphase and
metaphase nuclei and the hybridization signals contained in the image. A simple method using the raw and
central moments of detected objects as measures to distinguish between the two types of nuclei is proposed.
1 INTRODUCTION
Fluorescence in situ Hybridization (FISH) is a tech-
nique used to visualize the location of specific DNA
sequences within the nucleus. It belongs to the most
common of molecular cytogenetic methods and is
widely applied in routine clinical genetic diagnostics.
The FISH technique concerns application of a flu-
orescently labeled DNA or RNA probe onto a biolog-
ical sample containing the target DNA or RNA from
the patient (e.g. as tissue sections, separated cells,
isolated interphase nuclei or chromosomal metaphase
spreads). In the process of hybridization, the probe
attaches to its complementary sequences on the target
DNA or RNA molecule. Under the fluorescence mi-
croscope we observe the sequence with the attached
probe as a strikingly luminous hybridization signal (a
fluorescent dot or an area within the biological struc-
ture). Details of the principles of the fluorescence mi-
croscopy can be found e.g. in (Rittscher et al., 2008)
FISH is also a useful diagnostic tool in repro-
ductive medicine, oncology, preventive medicine, and
other medical branches – examples can be found in
(Beatty et al., 2002) or (Varella-Garcia, 2003).
We are paying attention to FISH analysis of chro-
mosomal aneuploidies – i.e., deviations from chromo-
somal number. These abnormalities are responsible
for well-known clinically significant syndromes such
as Down’s syndrome (trisomy 21) or Turner’s syn-
drome (monosomy X), Klinefeter’s syndrome (XXY
constitution) – see (Harper, 2004), (Roizen and Pat-
terson, 2003), (Anner
´
en, 2007), and (Visootsak and
Graham, 2006).
To be able to conclude examination of a single pa-
tient, a set of tens or hundreds of images have to be
evaluated. An automated data acquisition and pro-
cessing is needed to achieve acceptable accuracy and
reproducibility of results; manual processing would
be time consuming and subjective.
Our paper is focused on the task of image segmen-
tation, that is, on finding and evaluation of the objects
of interest — the interphase cell nuclei, metaphase
spreads and the hybridization signals. We first re-
view the properties of images resulting from the FISH
analysis in Section 2 and propose an image process-
ing system in Section 3. In Section 4, we discuss the
edge-based segmentation technique used for identi-
fication of cell nuclei and detection of hybridization
signals. In Section 5, we describe the experiments
and, finally, Section 6 concludes the paper.
347
Schier J., Kovár B. and Kocárek E..
AUTOMATED DETECTION OF INTERPHASE AND METAPHASE NUCLEI IN THE FISH IMAGES.
DOI: 10.5220/0003797703470350
In Proceedings of the International Conference on Bioinformatics Models, Methods and Algorithms (BIOINFORMATICS-2012), pages 347-350
ISBN: 978-989-8425-90-4
Copyright
c
2012 SCITEPRESS (Science and Technology Publications, Lda.)
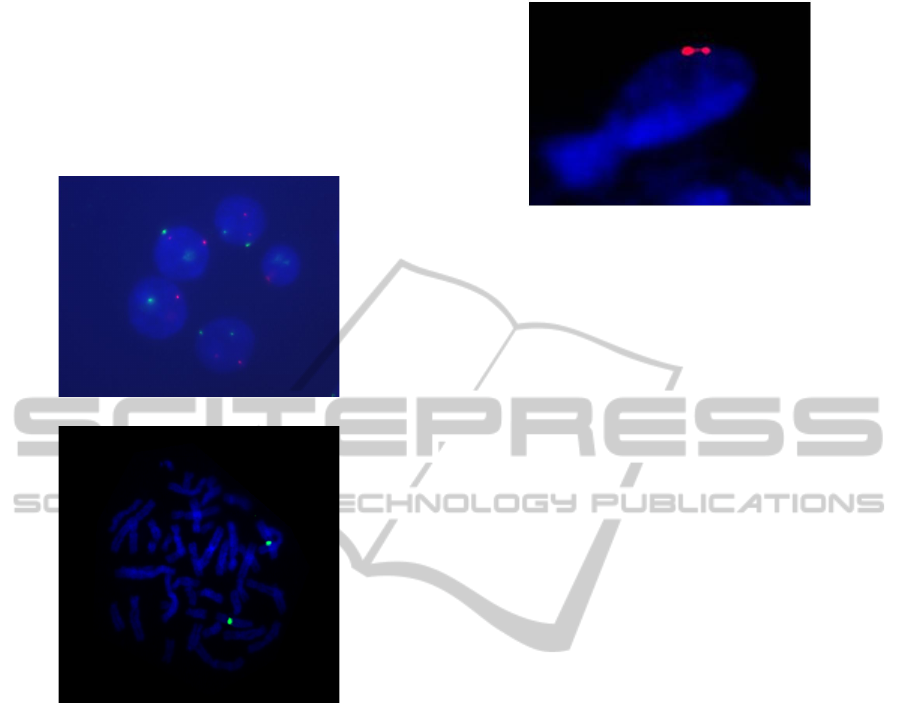
2 FISH IMAGES
Example images from the FISH analysis are shown
in Figure 1. They show the interphase nucleus (Fig-
ure 1a) and the metaphase spread of chromosomes
(Figure 1b), which correspond with two basic phases
of the so-called cell cycle.
(a) Interphase cells
(b) Metaphase spread
Note: the images are not in the same scale. The metaphase cell
image has been preprocessed to suppress the background.
Figure 1: Examples of FISH images.
The hybridization signals are — in this exam-
ple — in red and green colour. Blue objects are
the nuclear structures counterstained with the DAPI
dye. Very often, both the interphase nuclei and the
metaphase spreads are contained in the same image.
The objects of interests are characterized by the
following features: the nuclei are of roughly round
shape; the spread of chromosomes has ideally a
roughly circular envelope. The chromosomes selves
are observed as X-shaped or V-shaped bent stripes,
frequently overlapping one another in the image. The
hybridization signals must be located either within the
interphase nuclei, or on a chromosome. The signals
within a single nucleus should be clearly separated.
For detection of the chromosomal aneuploidies
(cf. the Introduction section), it is important to evalu-
ate the quality of the nuclei and hybridization signals.
The rules for evaluation should be rather stringent and
conservative, to eliminate dubious objects and objects
Figure 2: Interphase nucleus of an irregular shape as an ex-
ample of object to be rejected from processing.
in ambiguous arrangement.
Examples of objects to be rejected from process-
ing include (see Figure 2): interphase nuclei of irreg-
ular shape, nuclei touching or overlapping each other,
metaphase spreads of significantly irregular shape,
signals located in the background, etc.
For each dye, separate greyscale image is taken
using filter set matching the excitation wavelength
of the illuminating light and the wavelength of the
light emitted by this that dye (details can be found
in (Rittscher et al., 2008), Chapter 2). The resulting
image is then computed from these greyscale images.
3 IMAGE PROCESSING FLOW
The processing flow of the image processing system is
outlined in Figure 3, for blue-stained cells and green
(or green and red) signals.
While the operations used to process the cell com-
ponent and the signal components of the input image
are very similar, it is advantageous to process each
image, corresponding with a single filter set, sepa-
rately. The reason is that the cells and the signals of
each colour are in separate layers. The first operation
is segmentation, used to separate the objects of inter-
est from the background. It is followed by computa-
tion of object parameters (size, roundness, brightness,
etc.), which, in turn, are used to sort out objects that
satisfy the quality criteria. The results of cell process-
ing are used to eliminate any signals located in the
background.
4 IMAGE SEGMENTATION
4.1 Detection of Cell Nuclei
4.1.1 Otsu Thresholding Algorithm
For image binarization, we have chosen the Otsu algo-
BIOINFORMATICS 2012 - International Conference on Bioinformatics Models, Methods and Algorithms
348
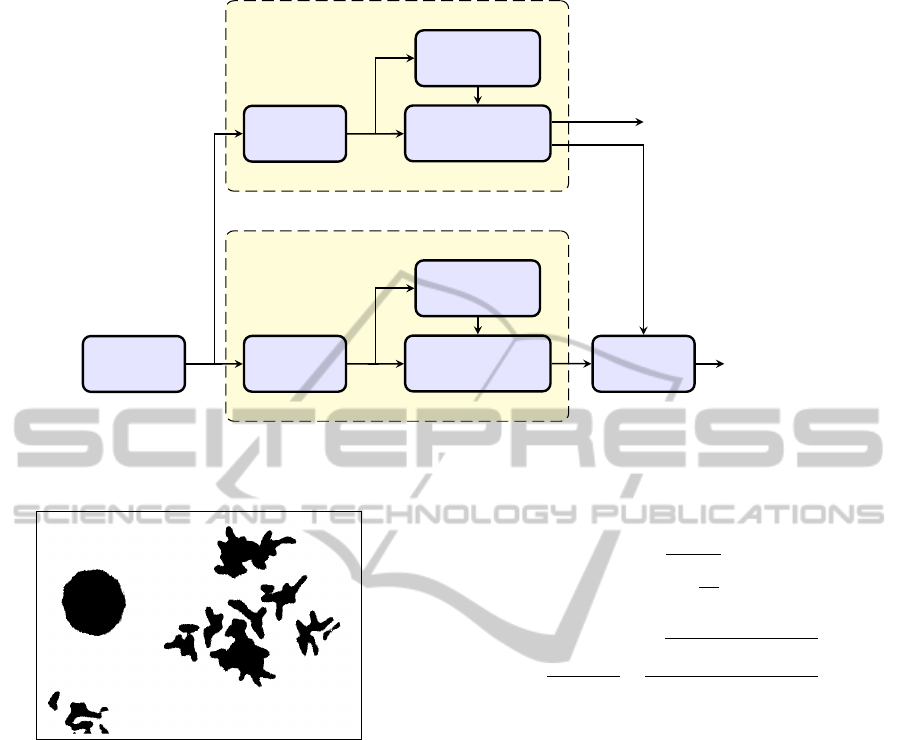
Blue channel
Processing of nuclei
Green (red) channel
Processing of signals
Object
parameters
Segment.
Object
Classification
Signal
parameters
Image Segment.
Signal
Classification
Masking
Interphase
cells
Metaphase
spread
Output
Figure 3: Processing flow of the image processing subsystem.
Figure 4: Results of the Otsu-based image binarization.
rithm, introduced in 1979 by Nobuyuki Otsu (Otsu,
1979). Using discriminant analysis, Otsu defined the
between-class variance of the thresholded image as
σ
2
ω
(t) = ω
1
(t)σ
2
1
(t) + ω
2
(t)σ
2
2
(t), (1)
where ω
i
are the probabilities of the two classes sep-
arated by a threshold t and σ
2
i
are variances of these
classes. For bi-level thresholding, Otsu verified that
the optimal threshold t
∗
is chosen so that the between-
class variance σ
2
ω
(t) is maximized; that is,
t
∗
= argmax(σ
2
ω
(t)), 1 ≤ t ≤ L, (2)
where L is the highest gray-level intensity value in the
image.
4.1.2 Parameters of Cell Nuclei
As the next step, the eccentricity e of each object is
computed, using its contour C. It is defined as the
relative difference in magnitude of the eigenvalues λ
1
and λ
2
(4) of the covariance matrix of the object con-
tour C.
e =
s
1 −
λ
2
λ
1
, (3)
λ
1,2
=
µ
0
20
+ µ
0
02
2
±
q
4µ
02
11
+ (µ
0
20
− µ
0
02
)
2
2
. (4)
In this equation µ
0
are second order central moments
defined as
µ
0
pq
= µ
pq
/µ
00
,
where µ
pq
is the central moment of order pq defined
as
µ
pq
=
∑
x
∑
y
(x − ¯x)
p
(y − ¯y)
q
C(x, y). (5)
Only the nuclei with circular or slightly elliptical
shape (e > 0.6) are accepted for further processing.
In addition, for each cell nucleus {i}, we evaluate
further characteristics, such as the area, centroid, av-
erage intensity, standard deviation of intensity, round-
ness, length of contour, etc.
4.2 Detection of Hybridization Signals
Hybridization signals are detected by the same algo-
rithm as the nuclei, but used on other layers of the in-
put image. The fact that it is not necessary to change
the segmentation algorithm to process the signals can
be considered as an advantage of this approach. Illus-
trative results are shown in the Figure 5.
AUTOMATED DETECTION OF INTERPHASE AND METAPHASE NUCLEI IN THE FISH IMAGES
349
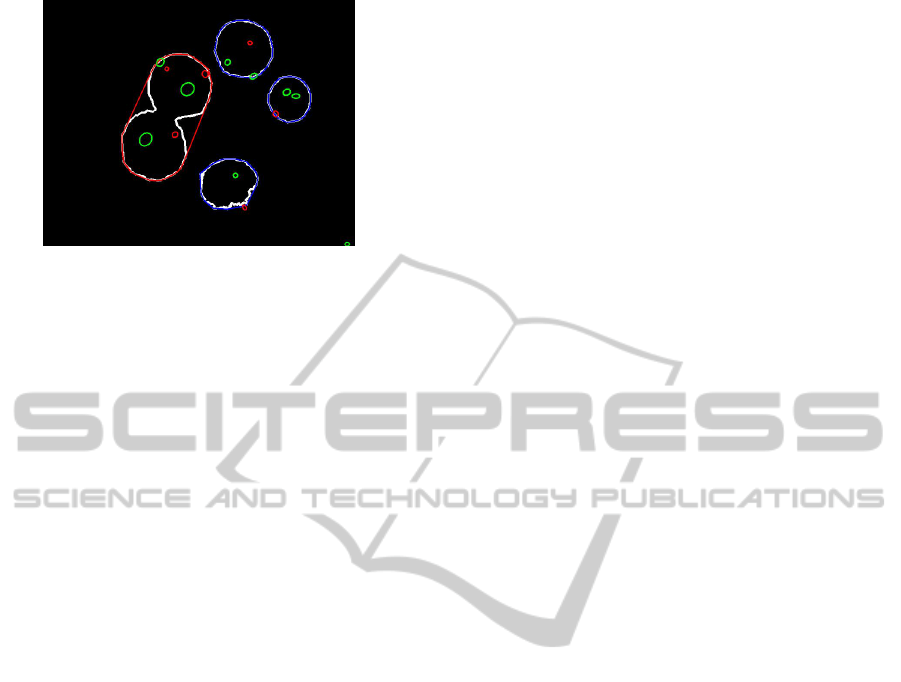
Figure 5: Detected cell nuclei with hybridization signals.
Source image is depicted in Figure 1a. Note that some of
the detected signals do not correspond to the real signals in
the sample.
5 DESCRIPTION OF TEST DATA
AND EXPERIMENTS
To test the efficiency of the proposed approach, fifty
microscopic images acquired at a resolution of 720 ×
576 pixels, containing both the interphase nuclei and
the metaphase spreads of chromosomes, were used.
The number of nuclei in each image ranges between
1 and 10. Most images contain metaphase spread
of chromosomes and at least one interphase nucleus.
This data set was divided into two equal parts, each
of them with 25 images. First data set was used
for nearest neighbor classifier training while the sec-
ond data set for the experiments. The training set
for the classifier consisted of 73 nuclei used for fea-
ture reduction. All nuclei were labeled by the fea-
tures that are described in the Section 4. The fea-
tures that perform well to separate both classes (inter-
phase and metaphase), were selected manually. We
have achieved the best results if contour eccentricity
and length and object area were used. The classifier
correctly identified nearly all (99%) interphase cells.
Incomplete cells located at the image border were au-
tomatically rejected from further evaluation. Unfor-
tunately, only 68% nuclei in the metaphase state were
identified correctly.
The algorithm is sufficiently robust to detect com-
pact spreads, such as shown in Figure 1b, but the per-
formance decreases when the spread is not compact
enough.
6 CONCLUSIONS
The paper treats automated segmentation and eval-
uation of images from the fluorescence in-situ hy-
bridization (FISH) microscopic analysis.
Two problems were discussed: segmentation of
the input image to cell nuclei, hybridization signals
and background, and recognition of interphase nuclei
and metaphase spreads. To distinguish between the
two types of nuclei, eccentricity, area, and perime-
ter are used as the main criteria. While this approach
is adequate for identification of interphase nuclei, it
does not provide acceptable results for the metaphase
spreads. This problem will be addressed in further
research.
ACKNOWLEDGEMENTS
The paper has received support from the TA01010931
project System for support of the FISH method evalu-
ation of the Technology Agency of the Czech Repub-
lic.
REFERENCES
Anner
´
en, G. (2007). Turner syndrome. The American Jour-
nal of Human Genetics, 68(3):2–9. John Wiley &
Sons, Ltd.
Beatty, B., Mai, S., and Squire, J. (2002). FISH. Oxford
University Press, Oxford.
Harper, P. S. (2004). Practical genetic counselling. Arnold,
London, 6 edition.
Otsu, N. (1979). A threshold selection method from gray-
level histograms. IEEE Transactions on Systems,
Man, and Cybernetics, 9:62–66.
Rittscher, J., Machiraju, R., and Wong, S. T. C., editors
(2008). Microscopic Image Analysis for Life Science
Applications. Artech House, Inc.
Roizen, N. and Patterson, D. (2003). Down’s syndrome.
The Lancet, 361(9365):1281–1289.
Varella-Garcia, M. (2003). Molecular cytogenetics in solid
tumors: Laboratorial tool for diagnosis, prognosis,
and therapy. The Oncologist, 8(3):45–48.
Visootsak, J. and Graham, J. (2006). Klinefelter syndrome
and other sex chromosomal aneuploidies. Orphanet
Journal of Rare Diseases, 1(42). Biomed Central.
BIOINFORMATICS 2012 - International Conference on Bioinformatics Models, Methods and Algorithms
350
