
ARTIFICIAL NEURAL NETWORKS IN THE ESTIMATION OF
MEASURES OF TEMPERATURE AND HUMIDITY INSIDE A
NEONATAL INCUBATOR
Alberto A. M. Albuquerque, Arthur P. S. Braga, Bismark C. Torrico and Otac´ılio M. Almeida
Department of Electrical Engineering, Federal University of Ceara, Fortaleza, CE, Brazil
Keywords:
Artificial Neural Network, Neonatal Incubator, Temperature and Humidity Estimation.
Abstract:
This paper seeks to estimate through Artificial Neural Networks the future behavior of temperature and hu-
midity inside an incubator. This goal is motivated by the observation that the model-based predictive control
is an interesting alternative for the generation of control signals of a neonatal incubator since: (i) it seeks
to optimize a performance criterion that considers the future behavior of this controller, and (ii) restrictions
may be imposed on future control signals. These two features can make more safe and comfortable the mi-
croclimate inside the device for the newborn: variables such as temperature and humidity can be better kept
within the limits of technical standards such as the NBR IEC 601-2-19 and its amendment No. 1, NBR IEC
60601-2-19-2000. However, one predictive model of the process to be controlled must first be obtained. The
obtained neural model has accuracy in predicting the incubator behavior one time step forward compatible
with the technical standard, and it is ready to be applied in a predictive control structure.
1 INTRODUCTION
A neonatal incubator is an important electro-medical
equipment used in a neonatal care unit to assist the
care of premature infants or newborns with some kind
of diseases (Barbosa and Oliveira, 2002). At Brazil,
in 2007, approximately 50% of deaths of newborns
under one year old occurred in the first 27 days after
birth, according to the Brazilian Ministry of Health
(Datasus Minist´erio da Saude, 2009), period during
which the incubators are one of the most important
tools to reduce the risks of mortality and diseases. The
newborn incubator provides an ideal microclimate in
order to minimize newborn’s heat and water losses,
which is vital for the survival of premature or criti-
cally ill infants, through the control of internal tem-
perature and relative humidity (Barbosa and Oliveira,
2002).
Neonatal incubators as well as other electro-
medical equipment suffer loss of calibration over
time, compromising the control system and causing
serious damage to the newborn or even resulting in
the death of this (Barbosa and Oliveira, 2002; Arone,
1993; Farges et al., 1998). The Brazilian technical
norm NBR IEC 601-2-19 and its amendment No. 1,
NBR IEC 60601-2-19 2000, provide specifications
over neonatal incubators to offer a safe environment
to newborns. These requirements are verified by per-
forming several tests which include the application of
input signals to the temperature, humidity and air flow
actuators, and recording and analyzing the tempera-
ture, humidity and air flow data in specific points in-
side the neonatal incubator (ABNT, 2000).
The optimal control of environments variables of
the the neonatal incubator, provides a ideal microcli-
mate to safety newborn development. From the view-
point of control theory, the neonatal incubator can
be seen as a TITO system, coupled, where the tem-
perature and humidity are controlled variables.This
system contains strong nonlinear characteristics, and
its modeling through the phenomenological analysis
of the process is a complex task.From models with
a truer representation of the process, more efficient
controllers can be designed (Camacho and Bordons,
2003), among controllers used in the non-linear pro-
cesses, non-linear predictive controller, is an alterna-
tive. The predictive controller is strongly dependent
on the plant model (Camacho and Bordons, 2003).
The use of identification techniques for nonlinear sys-
tems is necessary to find an efficient model that rep-
resents the system behavior.
Based on the previous, this work proposes a model
of behavior of the temperature and humidity at points
specified by the standard (ABNT, 2000).This work
276
A. M. Albuquerque A., P. S. Braga A., C. Torrico B. and M. Almeida O..
ARTIFICIAL NEURAL NETWORKS IN THE ESTIMATION OF MEASURES OF TEMPERATURE AND HUMIDITY INSIDE A NEONATAL INCUBATOR.
DOI: 10.5220/0003791502760281
In Proceedings of the International Conference on Bio-inspired Systems and Signal Processing (BIOSIGNALS-2012), pages 276-281
ISBN: 978-989-8425-89-8
Copyright
c
2012 SCITEPRESS (Science and Technology Publications, Lda.)
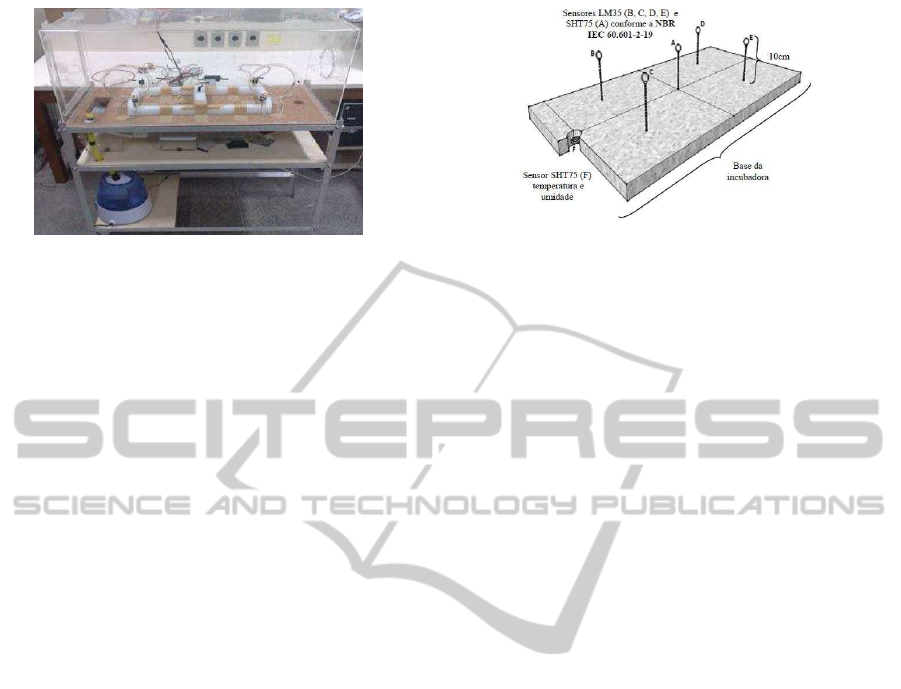
Figure 1: Prototype of the incubator.
uses artificial neural networks (Haykin, 2008) as a
technique for the identification of nonlinear systems,
to the identification of signals of temperature and hu-
midity in the positions defined by the standard, as
only a single temperature and humidity sensor in-
stalled in the exhaust air of the incubator. The model
is intended to found its future use in a predictive con-
troller, acting as the controller model and also insert-
ing the restrictions provided by the standard output.
This work is organized in the following topics: sec-
tion 2 describes the prototype of the incubator used
in the experiments. The section 3 discusses a review
about artificial neural networks, in particular the mul-
tilayer perceptron architecture. The 5th section are
shown the tests and the results obtained and the sec-
tion 6 tells about the conclusions and final comments.
2 THE INCUBATOR PROTOTYPE
The incubator prototype built in the GPAR/DEE/UFC
(Research Group in Robotics and Automation) re-
search laboratory is shown in Figure 1.
The prototype is divided into two basic parts: the
supporting structure with aluminum rods and wood
planks and the acrylic dome with porthole windows
similar to commercial models of incubators. In
the supporting structure, just below the dome, is an
acrylic duct forming an air circulation system of the
incubator, where are installed a resistive heater and a
cooler on opposite ends of the circuit. Below the air
circulation system are the boards of control systems
of heating, ventilation and relative humidity. Also be-
low the ventilation system is located a commercial hu-
midifier adapted in moisture control. The control sys-
tem of the incubator can be divided into 3 subsystems
of control: temperature control system, control sys-
tem of moisture and ventilation system. The systems
of control of temperature and humidity are connected
to an acquisition board of National Instruments
TM
(NI) to connect these two systems with Matlab
TM
Figure 2: Spatial distribution of sensors inside the incuba-
tor.
software. The ventilation system operates indepen-
dent of the acquisition card, being that this was ad-
justed to maintain a constant ventilation speed of ap-
proximately 0.35 m/s, in accordance with the stan-
dard NBR IEC 601-2-19. The interior of the dome
is thermally isolated through a cork board of 24mm
thickness. Temperature and humidity sensors were in-
stalled in the interior of the dome following the provi-
sions in standard NBR IEC 601-2-19 and in the air of
the dome. Figure 2 shows the arrangement of sensors
on the board of cork. The sensors at positions B, C,
D, E, are temperature sensors LM35 (Semicondutors,
2000), while the sensors A and F are temperature and
humidity of type SHT75 (Sensirion, 2010).
The sensors A, B, C, D and E remain inside the in-
cubator during the tests, only being removed from the
dome to the normal operation of incubator because
sensors occupy the positions where the newborn is
placed. The sensor F, which is not specified by the
standard (ABNT, 2000), remains during the tests and
the normal operation of the incubator. From measure-
ments of the sensor F, performed during calibration, it
is estimated a dynamic model of temperature and hu-
midity in the interior of the dome. Through the model
we intend to evaluate, during normal operation of the
incubator, if there was deterioration in the calibration
of the incubator. In the next section describes neu-
ral network used to perform the construction of the
model of the signals of temperature and humidity.
3 MULTILAYER PERCEPTRON
NEURAL NETWORK
In this paper, it is used a neural network MLP (Multi-
layer Perceptron) (Haykin, 2008) to estimate the sig-
nals of temperature and humidity in the interior of the
dome’s incubator. The MLP is formed by neurons
distributed on layers that have high connectivity with
layer neurons following in a feed forward configura-
tion (Figure 3). The propagation of the signals takes
ARTIFICIAL NEURAL NETWORKS IN THE ESTIMATION OF MEASURES OF TEMPERATURE AND HUMIDITY
INSIDE A NEONATAL INCUBATOR
277
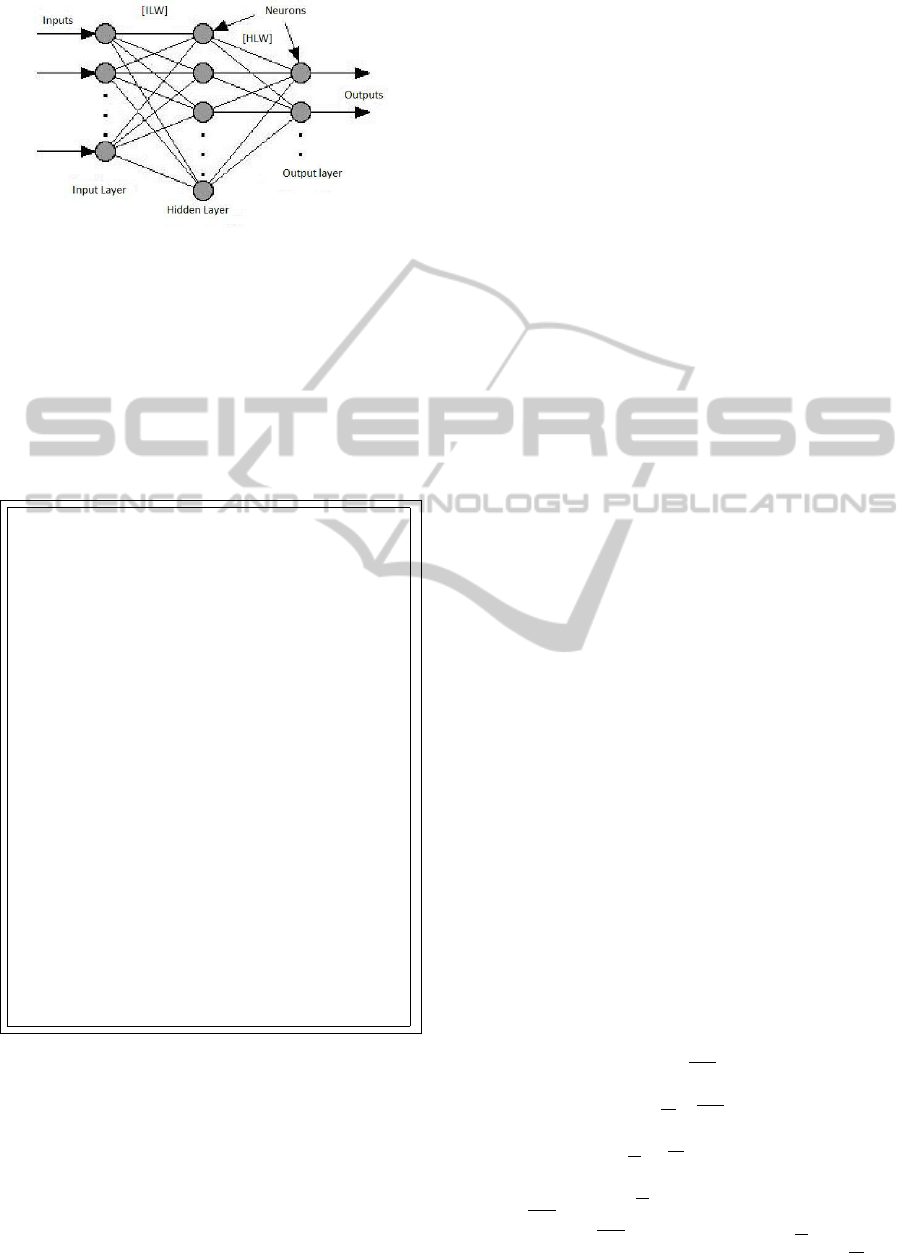
Figure 3: Multilayer perceptron network architecture,
(Haykin, 2008) adapted.
place via the input layer to output layer, surrounding
layers of neurons are connected to each other,the con-
nection between two neurons i and j is weighted by a
weight wij. Such parameters should be adjusted in
sense to minimize the error between the value to be
estimated (the training) and the MLP’s output. It is
shown below an algorithm to perform the adjustments
(the backpropagation algorithm) (Haykin, 2008):
The backpropagation algorithm.
1. Initialize the weights with small values arbi-
trary or random.
2. Randomly choose an input pattern.
3. Propagate the signal through the network.
4. Calculate δ
l
i
in the output layer.
δ
l
i
= g
′
· (h
l
i
) · [d
u
i
− y
l
i
]
where h
l
i
represents the net input to the i
t
h
unit in the I
t
h layer, and g’ is the derivative
of the activation function.
5. Compute the deltas for the preceding layers
by propagating the errors backwards;
δ
l
i
= g
′
· (h
l
i
)
∑
l
j
w
j+1
ij
· δ
l
i
6. Update the weights using ∆w = α· δ
l
i
· y
l
i
7. Go to step 2 and repeat for the next pattern
until the error in the output layer is below a
prespecified threshold or a maximum num-
ber of interactions is reached.
(Haykin, 2008)
This algorithm can be divided into two steps: the
propagation step forward and step of back propa-
gation. In propagating forward, the training stan-
dards are presented the network with no change in
the weights of the connections; the signals are calcu-
lated individually neuron by neuron, flowing of layer
in layer to produce a result in the outputlayer. This re-
sult is then compared with the desired output, and the
error is calculated. The second step is called back-
propagation: the error is calculated from the output
layer and back propagated by intervening layers until
the input layer and the weights of the connections are
modified as the error is propagated backward. Exam-
ples of training set are presented the network until it
reached a stop criterion is satisfied. Two stop criteria
normally used are (Haykin, 2008):
• The norm of the gradient vector of the error sur-
face in relation to the vector of weights has a suf-
ficiently small value.
• The minimum value for the mean quadratic error
be reaching, choosing this criterion does not guar-
antee that the algorithm reaches this value.
4 THE PREDICTIVE CONTROL
PROBLEM FORMULATION
The model-based predictive control reflects human
behavior that it is thought to lead to the best predicted
output over same limited horizon. To get this, on
internal model of the process in question should be
used. Hance a predictive control law has the follow-
ing components:
1. The control low depends on predicted behavior
and input/output.
2. The output prediction are computed using a pro-
cess model and constraints mutualities.
3. The current input is determined by optimizing
a predictive performance index subjected to in-
put/output constraints.
4. The control input is updated at every sampling in-
stant.(The receding horizon strategy)
According to (Rossiter, 2004), to solve the constraint
optimization predictive control correspond to solve
the following problem :
min
∆U
J
s.t C∆U − dk
where ∆U is the control increments.
This is known as quadratic programming(QP)
problem for witch solvers are easy to find (Rossiter,
2004). Its necessary to remember that:
d
k
=
∆U
−∆U
U − Lu
k−1
−U − Lu
k−1
Y − QDU
←
− PY
←
−Y − QDU
←
− PY
←
Where ∆U and ∆U are the control increments maxi-
mum and minimum limits respectively. Y and Y are
BIOSIGNALS 2012 - International Conference on Bio-inspired Systems and Signal Processing
278
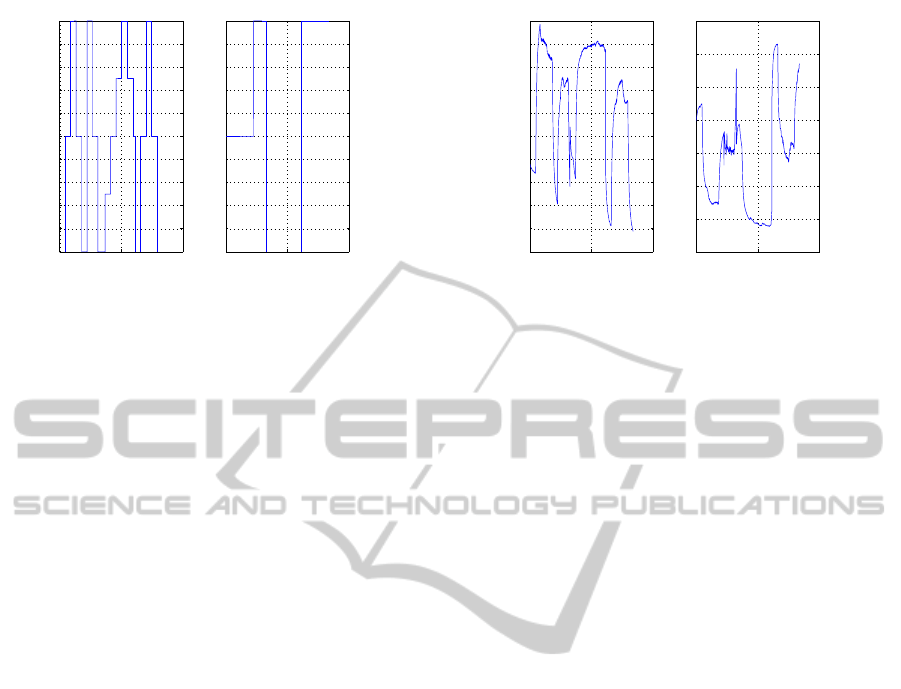
0 500 1000
0
10
20
30
40
50
60
70
80
90
100
Signal Aplied to Resistence
Time (min)
%Max Power
0 500 1000
0
10
20
30
40
50
60
70
80
90
100
Signal Aplied to Nebulizer
Time (min)
%Max Power
Figure 4: Signals applied to nebulizer and warm resistance.
set of temperatures and humidity inside neonatal incu-
bator. Whose models are inferred by proposed neural
network.
Y =
T
i
U
where T
i
with i=(A,B,C,D,E) is the standard temper-
ature value according to figure 2 and U is standard
humidity value.
5 EXPERIMENTAL RESULTS
For the MLP training, four experiments were made
and the sensors’ measures were stored.The figure 4
shown the signals applied in the warm resistance and
nebulizer.The signal applied on the resistance is the
percentage of duty cycle where the max duty repre-
sents a tension of 220V AC over the resistance and
the signal applied to nebulizer represents the percent-
age flow of water vapor emitted by the nebulizer.
The data was acquired through an acquisition
board of National Instruments
TM
and Matlab
TM
.
Each experiment in the incubator prototype (Section
3) had mean duration of 210 minutes, with the sensors
positioned in concordance the NBR IEC 60601-2-19.
The dates of these four experiments were joined and
reorganized randomly and 70% are used for training
and 30% was used for validation of neural network.
The signals of temperature and humidity in the air exit
after the application of signal in the incubator’s actu-
ators is shown in figure 5. Network training is done
off-line, ie, is performed with the data obtained in ex-
periments carried out previously. The stopping cri-
terion used for training the network, was to obtain a
minimum mean square error or the execution of a total
of 1000 epochs, whichever comes first. The value of
the target MSE(Mean Square Error) was 0.001, how-
ever this target was never reached. The MLP network
0 500 1000
18
20
22
24
26
28
30
32
34
36
38
Temperature in the air exit
Time (min)
ºC
0 500 1000
10
20
30
40
50
60
70
80
Humidity in the air exit
Time (min)
RH%
Figure 5: Signals measured of air exit temperature and hu-
midity.
uses sigmoid activation functions in hidden layer neu-
rons and linear function in output layer’s neurons. Af-
ter numerous tests with different number of neurons
in the hidden layer, the 4-8-6 MLP had the best re-
sults when compared the performance index MSE.
The mean learning time of the net was 120 seconds
with one hundred epochs, after this number of epochs
the performance index not change. The weights of
neural network after the training are presented below:
ILW =
6, 95 5, 05 0, 70 2, 47
−0, 30 0, 13 −0, 07 −0, 11
0, 89 −1, 60 −1, 06 1, 47
0, 01 −0, 56 0, 01 0, 02
−1, 07 −0, 65 0, 06 0, 24
−5, 81 −1, 44 2, 34 7, 47
−0, 55 −1, 04 −1, 79 −5, 24
−1, 98 −1, 05 −1, 23 1, 29
HLW
T
=
−0.13 −0.45 −0.52 −0.30 −0.36 0. 33
−4.25 −6.96 −3.58 −3.74 −9.44 −0.98
0.22 0.26 0.28 0.21 0. 14 −0.05
0.44 0.45 0.49 0.46 0. 46 −1.76
−0.81 −0.76 −0.82 −0.83 −0.71 −0.07
−0.05 −0.05 −0.03 −0.05 −0.02 0. 14
−0.18 −0.23 −0.25 −0.20 −0.10 0. 22
−0.15 −0.14 −0.21 −0.17 −0.03 0. 04
Where ILW is the matrix weights of input layer
and HLW is the matrix weights of hidden layer.
5.1 Results of training
In the Figure 6 shown the worst result of training of
the temperature signal and the humidity signal. The
inputs of the artificial neural network are the signal of
temperature in the air exit (Sensor F - SHT75 - Figure
2), the signal of humidity in the air exit (Sensor F -
SHT75 - Figure 2), the signal applied to the heating
element and the signal applied in the nebulizer. The
targets of the network are the signals of temperature
measured in the positions A, B, C, D and E (shown
in Figure 2 and the signal of humidity measured in
position E. The mean square error was used as the
performance index.
ARTIFICIAL NEURAL NETWORKS IN THE ESTIMATION OF MEASURES OF TEMPERATURE AND HUMIDITY
INSIDE A NEONATAL INCUBATOR
279
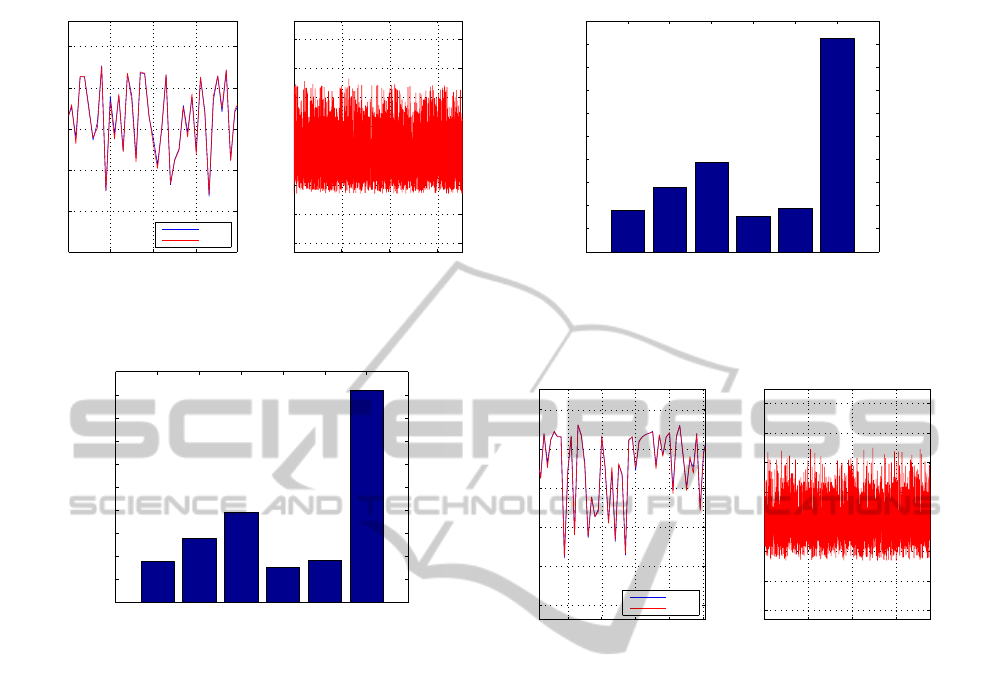
8810 8820 8830
20
25
30
35
40
Sensor C
Time(s)
Temperature ºC
Prev
Real
0 5000 10000 15000
−1.5
−1
−0.5
0
0.5
1
1.5
2
Error −Sensor C
Time(s)
Error
Figure 6: Comparisons, and error, between MLP outputs
and the training data of temperature (worst case).
TA TB TC TD TE HE
0
0.02
0.04
0.06
0.08
0.1
0.12
0.14
0.16
0.18
0.2
Mean Square Error
MSE
Figure 7: The mean squared error (MSE) between the signal
of network and signal real for each sensor (training set).
Figure 7 summarizes the MLP performance with
the mean squared error for each of the six considered
sensor. The trained network successfully learned the
mapping between the signals and desired output of the
training set, as seen by low mean square error values
that were in the order of 0.18.
5.2 Results of validation
The remaining 30% of data were used to validate the
trained network. The mean squared error between
network’s outputs and the desired outputs are shown
in Figure 8.
As one can be see, the mean squared error of the
validation set shows values close to 0.08 for the tem-
perature sensors, and the value of 0.16 for the humid-
ity sensor. Figure 9 shows curves obtained with the
validation set. Since the standard NBR IEC 60601-
2-19 requires that the value of temperature do not
varies above0.5
◦
C during one hour of service, and the
value of relative humidity do not differ 10% of the de-
fined by standard, the model errors in some points are
above the standard requirements but the purpose of
the model is just to give an indication that the sensor
TA TB TC TD TE HE
0
0.02
0.04
0.06
0.08
0.1
0.12
0.14
0.16
0.18
0.2
Mean Square Error
MSE
Figure 8: The mean squared error (MSE) between the sig-
nals of network and real signals for each sensor (validation
set).
3260 3270 3280 3290 3300
15
20
25
30
35
40
Sensor C
Time(s)
Temperature ºC
Prev
Real
0 2000 4000 6000
−1.5
−1
−0.5
0
0.5
1
1.5
2
Error −Sensor C
Time(s)
Error
Figure 9: Comparisons, and error, between MLP outputs
and the validation data of temperature (worst case)
measures the equipment are suffering a breakdown
and that a more precise test calibration must be done.
Therefore the model is useful to determine when the
incubator is out of the norm prescriptions, alerting the
operator which the equipment needs to be sent for
maintenance.
6 CONCLUSIONS
The MLP network developed in this work, have suc-
cess in the estimation of model of the temperature and
humidity of the neonatal incubator, enabling a model
where is possible formulate a predictive control prob-
lem with constraints to satisfy the standard specifica-
tions. As future work we intend to apply another neu-
ral network topologies (ex. RBF, SVM, SOM), and
other non linear mapping techniques such Kalman fil-
tering and NARMAX models in order to have a map-
ping of signals with greater accuracy, and the devel-
opment of a prototype device that is attached to the
incubator to check in real time with the models devel-
oped. As future work is required to develop a predic-
BIOSIGNALS 2012 - International Conference on Bio-inspired Systems and Signal Processing
280

tive controller to apply the model achieved in this ar-
ticle, and to study new topologies of neural networks
to perform a comparative performance between the
models estimated on these topologies in the applica-
tion of predictive control.
ACKNOWLEDGEMENTS
The authors are thankful to FUNCAP (Fundac¸˜ao
Cearense de Apoio ao Desenvolvimento Cient´ıfico e
Tecnol´ogico) for the financial support.
REFERENCES
ABNT, A. B. N. T. (2000). Equipamento Eletrom´edico -
Parte 2:Prescric¸˜oes particulares para seguranc¸a de
incubadoras de rec´em-nascidos. NBR IEC 60601-2-
19, Rio de Janeiro.
Arone, E. M. (1993). Estudo das variac¸˜oes da umidade rela-
tiva no microclima de uma incubadora infantil funcio-
nando com e sem ´agua em seu reservat´orio. Master’s
thesis, Faculdade S˜ao Camilo de Administrac¸˜ao Hos-
pitalar e Sa´ude P´ublica, S˜ao Paulo (SP).
Barbosa, A. and Oliveira, I. (2002). O advento das in-
cubadoras no exterior e no brasil: um ensaio historico.
Pediatria Atual, 6(15):1–45.
Camacho, E. F. and Bordons, C. (2003). Model Predic-
tive Control (Advanced textbooks in control and signal
processing). Springer, 2
nd
edition.
Datasus Minist´erio da Saude (2009). Incubadoras.
Retrieved in http://www2.datasus.gov.br/DATASUS/
index.php?area=0205.
Farges, P., Bouattoura, D., and Villon, P. (1998). Dynamic
programming approach for newborn’s incubator hu-
midity control. IEEE Transactions on Biomedical En-
gineering, 45(1):48–55.
Haykin, S. (2008). Neural Networks and Learning Ma-
chines. Prentice-Hall, Upper Saddle River, N.J., 3
rd
edition.
Rossiter, J. (2004). Model-based predictive control. CRC
PRESS, 1 edition.
Semicondutors, N. (2000). Lm35 precision centi-
grade temperature sensors. Retrieved in
http://www.national.com/ds/LM/LM35.pdf.
Sensirion (2010). Datasheet sht7x (sht71, sht75) hu-
midity and temperature sensor. Retrieved in
http://www.sensirion.com/en/pdf/product information
/Datasheet-humidity-sensor-SHT7x.pdf.
ARTIFICIAL NEURAL NETWORKS IN THE ESTIMATION OF MEASURES OF TEMPERATURE AND HUMIDITY
INSIDE A NEONATAL INCUBATOR
281
