PREDICTION OF CHIMERIC PROTEIN FOLD
Ruben Acuña
1
, Zoé Lacroix
1
, Fayez Hadji
2
, Jacques Chomilier
2,3
and Nikolaos Papandreou
4
1
Scientific Data Management Laboratory, Arizona State University, Tempe AZ 85282-5706, U.S.A.
2
Institut de Minéralogie et de Physique des Milieux Condensés and CNRS, Université Pierre et Marie Curie,
75252 Paris cedex 05, France
3
Ressource Parisienne en Bioinformatique Structurale, 15 rue Hélène Brion, 75 013 Paris, France
4
Genetics Department, Agricultural University of Athens, Iera Odos 75, Athens, Greece
Keywords: Chimeric Proteins, Folding, Prediction, Simulation, Fusion Proteins, MIR.
Abstract: We propose two computational methods for predicting if a protein produced by fusion of genes will
conserve the structures of the fused proteins. We use two complementary paths for prediction. The former is
a simulation from the sequence while the latter exploits its expected structure. Early stages of protein
folding are simulated from their amino acid sequence by capturing the most interacting residues (MIR).
Individual domain structures (or models) are superposed onto the predicted complex structure (or model).
When no structure exists, a model is calculated using a set of ab initio and fold recognition tools. These
results are used to predict the validity of the chimeric protein. We test the two methods against a dataset of
10 proteins.
1 INTRODUCTION
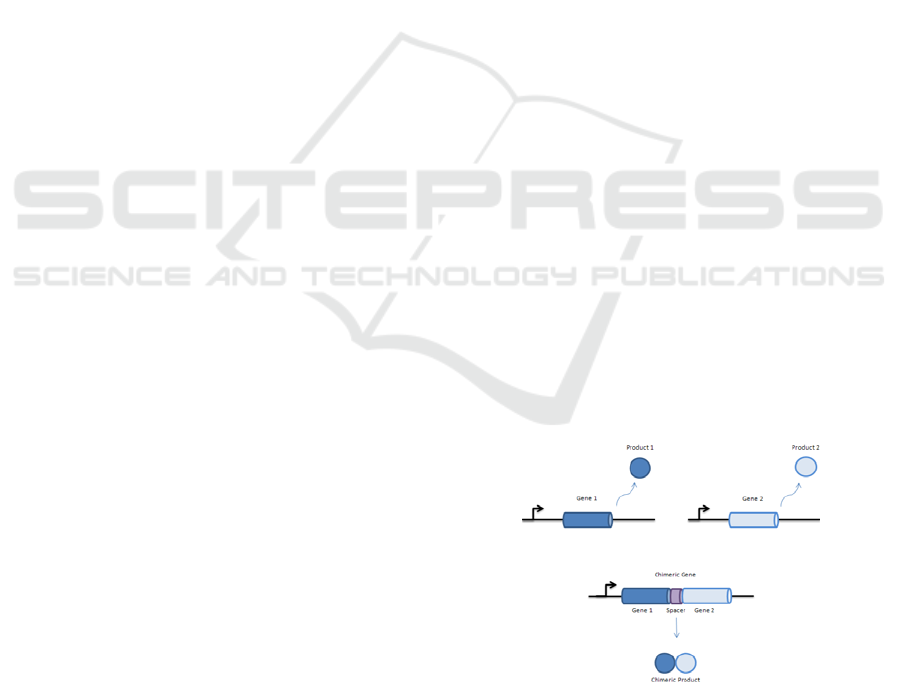
Protein fusion is a process that consists of the
creation of a chimeric protein from parent ones, see
Figure 1. The structure of a protein is correlated to
its function (Chandonia and Brenner, 2006), so if the
structure of a domain is altered when fused to a
partner, the function can be impaired. The
motivation is that the functions of the parent proteins
are conserved in the complex and will work in
tandem. This has applications in drug design, see
(Peppel, Crawford, and Beutler, 1991). The
challenge is this: by fusing two proteins together, is
it possible that they may fold incorrectly, thus
affecting the desired function? Ideally, function is
conserved.
We first use a simulation method that predicts
the most interacting residues (MIR), which can
delineate the folding nucleus (Papandreou, et al.,
2004). The lack of conservation of MIRs may
predict structural differences. The MIR simulation
was shown to corroborate simulations such as
tightened end fragments (TEF) and the calculation of
free energy change upon mutation (Lonquety,
Lacroix, Papandreou and Chomilie, 2009; Lonquety,
Chomilier, Papandreou and Lacroix, 2010). We also
compare our sequence predictions with structural
conservation of the complex relative to the
component domains.
Figure 1: Chimeric protein structure formation.
2 RELATED WORK
The MIR algorithm (Papandreou, et al., 2004) is
designed to calculate the number of residues a given
residue interacts with early in the folding process,
capturing local structural information. A cubic
lattice is constructed containing the protein. The
algorithm selects a random conformation fitting the
lattice. The algorithm then iterates, randomly
moving residues and analyzing the energy of the
new structure. MIR positions correspond to the
234
Acuña R., Lacroix Z., Hadji F., Chomilier J. and Papandreou N..
PREDICTION OF CHIMERIC PROTEIN FOLD.
DOI: 10.5220/0003790102340239
In Proceedings of the International Conference on Bioinformatics Models, Methods and Algorithms (BIOINFORMATICS-2012), pages 234-239
ISBN: 978-989-8425-90-4
Copyright
c
2012 SCITEPRESS (Science and Technology Publications, Lda.)

residues with the highest number of non-covalent
neighbors during the simulation.
Typically, chimeric proteins must be
experimentally tested. However, structure prediction
tools such as QUARK (Xu and Zhang, unpublished;
Xu and Zhang, unpublished; Zhang Lab, 2011), I-
TASSER (Roy, Kucukural and Zhang, 2010; Zhang,
2009), and Phyre2 (Kelley and Sternberg, 2009) can
be used. As I-TASSER and Phyre2 use known
proteins, they may be biased towards a chimera's
structure when modeling its components. We can
evaluate whether each parent domain superposes on
the chimera. Protein structure superposition
potentially captures protein similarities not predicted
by sequence alignments.
Table 1: Each chimeric product is described by its name with its component domains (col. 1), the residue of the sequence
(col. 2), and if the product folds into an oncoprotein (col. 3). The source of their sequence is then indicated (col. 4);
products from KEGG are listed with their ID, from PDB with PDB ID and from NCBI with GenBank Accession. It is
shown if the sequence has a structure PDB entry or model (col. 5 and 6).
Product Length Fold Database(ID) Struct. Model
Etanercept[2] 467 KEGG(D00742)QUARK
TNFRSF1B 235 KEGG(subsequence)QUARK
IgG1Fc 232 KEGG(subsequence)QUARK
alpha‐synuclein(1‐19)fusedMBP 390 PDB(3Q25) PDB
maltosebindingprotein 371 PDB(subsequence)QUARK
Alpha‐Synuclein 19 PDB(subsequence)QUARK
MLL1PHD3‐Cyp33RRMchimeric 140 PDB(2KU7) PDB
Phd3 60 PDB(subsequence)QUARK
Cyp33 80 PDB(subsequence)QUARK
TRIM5/cyclophilinAfusionprotein… 468 NCBI(ACU46018.1)Phyre2
TRIM5 291 NCBI(subsequence)Phyre2
cyclophilinA 177 NCBI(subsequence)Phyre2
GST/EGFPfusionprotein… 518 NCBI(AEA11185.1)Phyre2
GlutathioneS‐transferase 279 NCBI(subsequence)Phyre2
EGFP 239 NCBI(subsequence)Phyre2
bcr/c‐abloncogeneprotein… 156 Onco NCBI(AAA35697.1)I‐TASSER
bcr 37 NCBI(subsequence)I‐TASSER
c‐abl 119 NCBI(subsequence)I‐TASSER
oncogene[Oryctolaguscuniculus] 748 Onco NCBI(AAB48442.1)I‐TASSER
RAD23homolog 250 NCBI(subsequence)I‐TASSER
ral 498 NCBI(subsequence)I‐TASSER
MLL/CBLfusionprotein… 20 Onco NCBI(AAM97173.1)I‐TASSER
MLL 15 NCBI(subsequence)I‐TASSER
CBL 5 NCBI(subsequence)I‐TASSER
tropomyosin4‐anaplasticlymphoma… 320 Onco NCBI(AAK17926.1)Phyre2
tromyosin4 221 NCBI(subsequence)Phyre2
anaplasticlymphomakinase 99 NCBI(subsequence)Phyre2
BRD4‐NUTfusiononcoprotein… 1846 Onco NCBI(AAO22237.1)Phyre2
BRD4 715 NCBI(subsequence)Phyre2
NUT 1131 NCBI(subsequence)Phyre2
PREDICTION OF CHIMERIC PROTEIN FOLD
235
3 METHOD
Given a chimera and its parent domains, we
calculate the MIR in their sequences and determine
if fusion significantly changes the interactions in the
fused domains. A large discrepancy in the
distribution of the MIRs in the parent domains and
the fused protein may allow us to conclude the
absence of a correct fold. We also compute a model
from the sequences and superpose the parent
domains onto the chimera.
In the simplest fusion protein, a sequence is
directly appended to another sequence so as to
produce a larger protein containing both sequences.
This organization holds for engineered chimeras, but
chimeric proteins also form naturally (e.g.
translocation). In Figure 1, we showed the more
general case where a spacer (or ligation scar) exists
between the two fused domains. While folding, a
spacer orientates and distances the two fused
domains to better allow their independent folding.
Our dataset is comprised of two groups of
sequences: a) products of chimeras known to fold
with conservation of folding of the individual parent
domains, b) chimeric products of oncogenes, thus
known to fold incorrectly. Proteins were selected
using the following criteria: 1) The atomic
coordinates must be determined for all residues. 2)
Relatively short. 3) Minimal spacer. We assume that
the sequence is cDNA. See Table 1. We retrofit the
chimeric protein sequence by splitting it into its
parent sequences using BLAST. We assume that
each chimeric protein is the result of appending
precisely two parent domains. In order for the whole
chimeric protein to fold correctly, it would be
required that any spacer did not interfere with the
attached protein. Consider the component protein
and spacer as a whole to be a protein; we then have
two components to fuse which fits our methodology.
The primary structures of the target proteins
were used to produce MIR predictions. For our
computations, we used an implmentation called MIR
2.2beta (Papandreou, et al., 2004). QUARK was
selected as our ab initio modeler based on its
performance in CASP9 (Protein Structure Prediction
Center, 2010), while I-TASSER was selected for its
association with QUARK. Phyre2 was selected for
its accuracy among fold recognition tools. We
expect that the percentage of the components which
superpose with the chimeric proteins would be much
greater in the chimeric proteins which are known to
fold correctly. Superposition was performed with
GANGSTA+.
4 RESULTS
For the MIR prediction, we first used a threshold of
seven interactions (Papandreou, et al., 2004) to
locate MIR. We list the positions along the sequence
where a MIR differs when comparing the
computations for an individual component to the
entire fused protein. Figures 2 and 3 show these
results for two extreme cases, the most divergent and
the most alike. The results of the structural
alignments are shown in Tables 2 and 3. We define
maximum alignment to be the length of the
component sequence divided by the length of the
chimeric sequence. The superposition column
indicates the portion of the component model that
can be superposed onto the chimera. For each
alignment, we also give the RMSD produced by
GANGSTA+ (Guerler and Knapp, 2008). In three
cases, GANGSTA+ could not calculate a result due
to a lack of secondary structure. In another, a model
could not be computed to use with GANGSTA+,
because CBL is peptide rather than a protein. When
more than one model was produced, we picked the
model with the highest reported confidence (Xu and
Zhang, unpublished; Roy, Kucukural and Zhang,
2010).
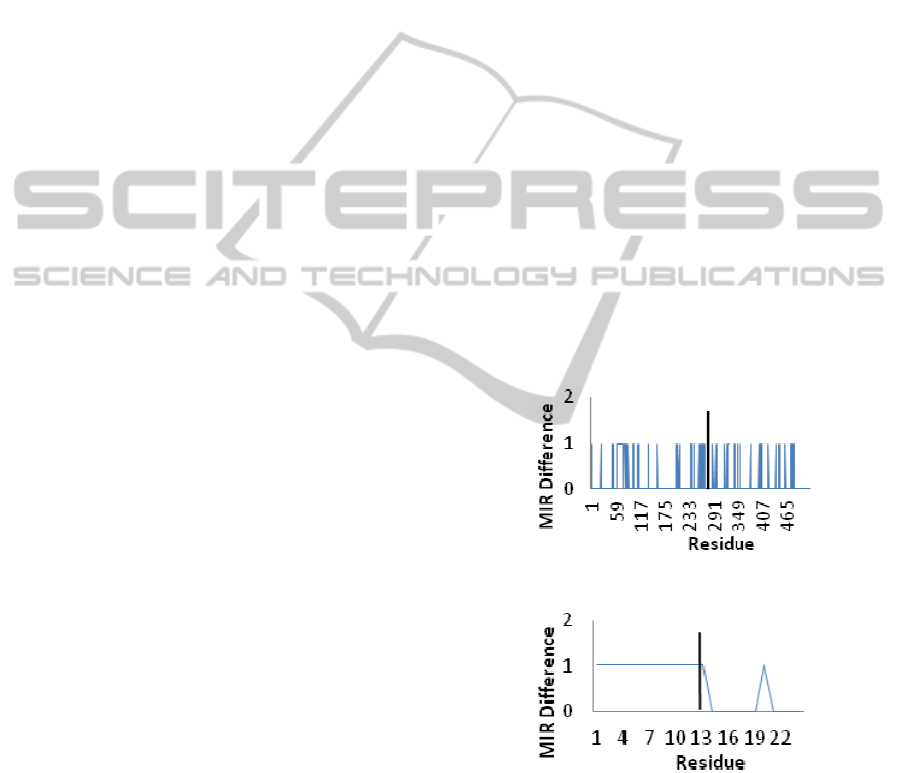
Figure 2: Changes in MIR distribution for GST-EGFP.
Figure 3: Changes in MIRs for BRD4-NUT. Only 12
residues on either side of the point of fusion are shown.
5 DISCUSSION
An analysis of the MIR data would ideally show
similar MIRs. A change in MIRs might indicate a
disruption during folding. In general, the MIR
results are noisy due to the Monte Carlo algorithm.
BIOINFORMATICS 2012 - International Conference on Bioinformatics Models, Methods and Algorithms
236

Table 2: For each domain (col. 2) of a target protein (col. 1), the ratio of the parent length with respect to the target length is
shown in % (col. 3). For each component we show the percentage of the component model that can be superposed with the
model (or structure) of its chimeric target (col. 4), thus the maximum value of col. 4 is that listed in col. 3.
ChimericTarget Component
Componentlength/
targetlength
Superposition
Etanercept TNFRSF1B 50.76% 15.89%
Etanercept IgG1Fc 49.24% 19.48%
alpha‐synuclein(1‐19)fusedtoMBP maltosebindingprotein 25.57% 12.53%
alpha‐synuclein(1‐19)fusedtoMBP Alpha‐Synuclein 4.85% LackingSSE
MLL1PHD3‐Cyp33RRMchimeric Phd3 42.85% 20.00%
MLL1PHD3‐Cyp33RRMchimeric Cyp33 57.15% 56.42%
TRIM5/cyclophilinAfusionprotein TRIM5 62.17% 9.18%
TRIM5/cyclophilinAfusionprotein CyclophilinA 37.83% 36.11%
GST/EGFPfusionprotein GlutathioneS‐transferase 53.86% 42.85%
GST/EGFPfusionprotein EGFP 46.14% 44.20%
Table 3: For each domain (col. 2) of a target oncoprotein (col. 1), the ratio of the parent length with respect to the target
length is shown in % (col. 3). For each component we show the percentage of the component model that can be superposed
with the model of its chimeric target (col. 4). The maximum value of column 4 is listed in col. 3.
OncoproteinTarget Component
Componentlength/
chimeralength
Superposition
bcr/c‐abloncogeneprotein Bcr 23.71% 19.23%
bcr/c‐abloncogeneprotein C‐abl 76.29% 50.64%
oncogene[Oryctolaguscuniculus] RAD23homolog 33.42% 4.01%
oncogene[Oryctolaguscuniculus] Ral 66.58% 47.99%
MLL/CBLfusionprotein[Human] MLL 79.16% LackingSSE
MLL/CBLfusionprotein[Human] CBL 23.84% Nostructure
tropomyosin4‐anaplasticlymphomakinase Tromyosin4 69.06% LackingSSE
tropomyosin4‐anaplasticlymphomakinase Anaplasticlymphoma 30.93% 0.00%
BRD4‐NUTfusiononcoprotein[Human] BRD4 38.78% 4.55%
BRD4‐NUTfusiononcoprotein[Human] NUT 61.22% 2.32%
In several cases, we see a peak in interactions at the
point of fusion due to lengthening of the sequence.
In the PHD3/Cyp33 fusion, the changes are few
enough (3 in 140 residues) to be accounted for by
the algorithm. This indicates that the protein should
fold correctly, as it is known from experiment.
GST/EGFP (figure 2), also known to have a
conserved function after fusion, has nevertheless
differences in MIRs. In the BRD4/NUT fusion
(figure 3), we see a plateau where 19 residues
change their MIR status. We suspect it may be a
motif indicating failure to fold. The remaining
proteins do not give conclusive results.
The superposition analysis is shown in Tables 4
and 5. The RMSD column is computed with
GANGSTA+. Our expectation is that the majority of
the models of proteins known to fold correctly can
be better superposed while the models from the
oncoproteins have minimal superposed results. The
mean RSMD in the set of conserved fold proteins is
2.36 Å, while it is 2.83 Å in the set of oncoproteins.
Of the known correct proteins, 4 have good
superposition, with a superposition including at least
75% of residues and a RMSD less than 2 Å. The
remaining models give superpose results of 14.77%
to 79.56%. Interestingly, only 14.77% of the TRIM5
component was superposed. This is likely due to the
inaccuracy inherent in structural prediction. Of the
oncoproteins, 4 of the models have superpositions
including less than 12% of residues. In particular,
GANGSTA+ cannot find any way to superpose the
anaplastic lymphoma kinase onto the model of its
PREDICTION OF CHIMERIC PROTEIN FOLD
237

chimera. The remaining models range from 72.08%
to 81.11% match. We found only one sequence
where the results of the methods corroborate. In the
case of the Cyp33 component of the PHD3/Cyp33
fusion (which is known to fold correct), the MIR
results indicated almost no change. Likewise, the
superposition tool superposed 98.72% of the
residues in the component.
6 FUTURE WORK
Improvements on the MIR algorithm are being made
by Nikolaos Papandreou. The new implementation
calculates SMIRs (smoothed MIR) which are more
stable across separate computations. By using
QUARK to predict all unknown structures, we
would reduce any variance that is introduced by the
use of multiple tools. This would also remove any
prediction tool bias from an analogous existing
structure. During the analysis of the proteins listed in
Table 1, we assumed all chimeric proteins were the
result of directly appending one protein to another.
Our dataset should be expanded with additional
chimeric proteins containing more than two
components.
7 CONCLUSIONS
In this paper we have presented methods for
predicting the potential of chimeric proteins to fold
correctly. A set of proteins was analyzed using first
a MIR tool and then a superposition tool. The results
of the MIR method were inconclusive. In many
cases similar patterns were seen in the correctly
folded proteins as well as the oncoproteins. In the
case of superposition, the correctly folded proteins
superposed significantly while many of the
oncogenes superposed minimally. In comparing the
results of the two methods, we found only one
instance where they agreed. Based on our results, the
application of superposition tools is capable of
providing some insight into the potential folding of
chimeric proteins.
Table 4: For each domain (col. 2) of a target protein (col. 1), the ratio of the superposition with respect to maximum
possible alignment is shown (col. 3). Column 4 is the associated RMSD.
ChimericProtein Component
superposition/maximum
possiblesuperposition
RMSD
Etanercept TNFRSF1B 31.30% 4.00Å
Etanercept IgG1Fc 39.56% 3.37Å
alpha‐synuclein(1‐19)fusedtoMBP maltosebindingprotein 49.00% 3.58Å
MLL1PHD3‐Cyp33RRMchimeric Phd3 46.67% 2.57Å
MLL1PHD3‐Cyp33RRMchimeric Cyp33 98.72% 1.67Å
TRIM5/cyclophilinAfusionprotein TRIM5 14.77% 2.81Å
TRIM5/cyclophilinAfusionprotein CyclophilinA 95.45% 0.72Å
GST/EGFPfusionprotein GlutathioneS‐transferase 79.56% 1.56Å
GST/EGFPfusionprotein EGFP 95.80% 1.01Å
Table 5: For each domain (col. 2) of a oncoprotein (col. 1), the ratio of the superposition with an ideal alignment is shown
in % (col. 3). Column 4 is the associated RMSD.
ChimericOncoproteinProtein Component
superposition/maximum
possiblesuperposition
RMSD
bcr/c‐abloncogeneprotein bcr 81.11% 2.74Å
bcr/c‐abloncogeneprotein c‐abl 66.38% 2.16Å
oncogene[Oryctolaguscuniculus] RAD23homolog 12.00% 3.46Å
oncogene[Oryctolaguscuniculus] ral 72.08% 2.12Å
tropomyosin4‐anaplasticlymphomakinase anaplasticlymphoma 0.00% N/A
BRD4‐NUTfusiononcoprotein[Homosapiens] BRD4 11.73% 3.12Å
BRD4‐NUTfusiononcoprotein[Homosapiens] NUT 3.79% 3.39Å
BIOINFORMATICS 2012 - International Conference on Bioinformatics Models, Methods and Algorithms
238

ACKNOWLEDGEMENTS
Thanks to Sylvia Acuña for her aid in proofreading
the manuscript.
This research was partially supported by the
National Science Foundation (grants IIS 0431174,
IIS 0551444, IIS 0612273, IIS 0738906, IIS
0832551, and CNS 0849980). Any opinion, finding,
and conclusion or recommendation expressed in this
material are those of the authors and do not
necessarily reflect the views of the National Science
Foundation.
REFERENCES
Chandonia, J.-M., Brenner, E., 2006. The Impact of
Structural Genomics: Expectations and Outcomes.
Journal of Experimental Medicine, 311(5759), pp.
347-351.
Guerler, Z., Knapp, E., 2008. Novel Folds and their
Nonsequential Structural Analogs. Protein Science,
17(8), pp. 1374-1382.
Kelley, L., Sternberg, M., 2009. Protein structure
prediction on the web: A case study using the Phyre
server. Nature Protocols, 4, pp. 363-371.
Lonquety, M., Lacroix, Z., Papandreou, N., Chomilie, J.,
2009. SPROUTS: a database for the evaluation of
protein stability upon point mutation. Nucleic Acids
Research, 37, pp. 374-379.
Lonquety, M., Chomilier, J., Papandreou, N., Lacroix, Z.,
2010. Prediction of stability upon point mutation in the
context of the folding nucleus. Omics, 14, Database
issue, No. 2, pp. 151-156.
Papandreou, N., Berezovsky, I. N., Lopes, A., Eliopoulos,
E., Chomilier J., 2004. Universal positions in globular
proteins. European Journal of Biochemistry, 271(23-
24), pp. 4762–4768.
Peppel, K., Crawford, D., Beutler, B., 1991. A tumor
necrosis factor (TNF) receptor-IgG heavy chain
chimeric protein as a bivalent antagonist of TNF
activity. Journal of Experimental Medicine, 174(6),
pp. 1483-1489.
Protein Structure Prediction Center, 2010. CASP 9.
[online] Available at: <predictioncenter.org/casp9/CD/
data/html/groups.2.html> [Accessed 8 July 2011].
Roy, A., Kucukural, A., Zhang, Y., 2010. I-TASSER: a
unified platform for automated protein structure and
function prediction. Nature Protocols, 5, pp. 725-738.
Xu, D., Zhang, Y.: QUARK Ab Intio Protein Structure
Prediction I: Methodology developments.
unpublished.
Xu, D., Zhang, Y.: QUARK Ab Intio Protein Structure
Prediction II: Results of benchmark and blind tests.
unpublished.
Zhang Lab, 2011. De Novo Protein Strcuture Prediction
by QUARK. [online] Available at: <zhanglab.ccmb.
med.umich.edu/QUARK/> [Accessed 8 July 2011].
Zhang, Y., 2009. I-TASSER: Fully automated protein
structure prediction in CASP8. Proteins, 69(8), pp.
108-117.
PREDICTION OF CHIMERIC PROTEIN FOLD
239
