AN EFFICIENT STOCHASTIC BASED MODEL
FOR SIMULATING MICROELECTRODE RECORDINGS
OF THE DEEP BRAIN
Modelling and Analysis
K. J. Weegink
1
, J. J. Varghese
1
, P. A. Bellette
1
, T. Coyne
2
, P. A. Silburn
3
and P. A. Meehan
1
1
School of Mechanical and Mining Engineering, Faculty of Engineering, The University of Queensland,
4072, St Lucia, Australia
2
St. Andrew’s War Memorial Hospital, Brisbane, Australia
3
Center for Clinical Research, The University of Queensland, 4029, Herston, Australia
Keywords: Deep brain signals, Micro-electrode recordings, Point Process model.
Abstract: We have developed a computationally efficient stochastic model for simulating microelectrode recordings,
including electronic noise and neuronal noise from the local field of 3000 neurons. From this we have
shown that for a neuron network model spiking with a stationary Weibull distribution the power spectrum
can change from exhibiting periodic behaviour to non-stationary behaviour as the distribution shape is
changed. It is shown that the windowed power spectrum of the model follows an analytical result prediction
in the range of 100-5000 Hz. The analysis of the simulation is compared to the analysis of real patient
interoperative sub-thalamic nucleus microelectrode recordings. The model runs approximately 200 times
faster compared to existing models that can reproduce power spectral behaviour. The results indicate that a
spectrogram of the real patient recordings can exhibit non-stationary behaviour that can be re-created using
this efficient model in real time.
1 INTRODUCTION
For the treatment of progressed movement disorders,
such as Parkinson’s disease (PD), deep brain
stimulation (DBS) may be used. This treatment
involves locating a target deep brain structure, such
as the sub-thalamic nucleus (STN), inserting an
electrode to within 1 mm accuracy, and then
applying a pulsed electric field to the area. One of
the tools used to locate the correct nucleus structure
is a microelectrode recording (MER). MERs are
performed by insterting a recording electrode, with a
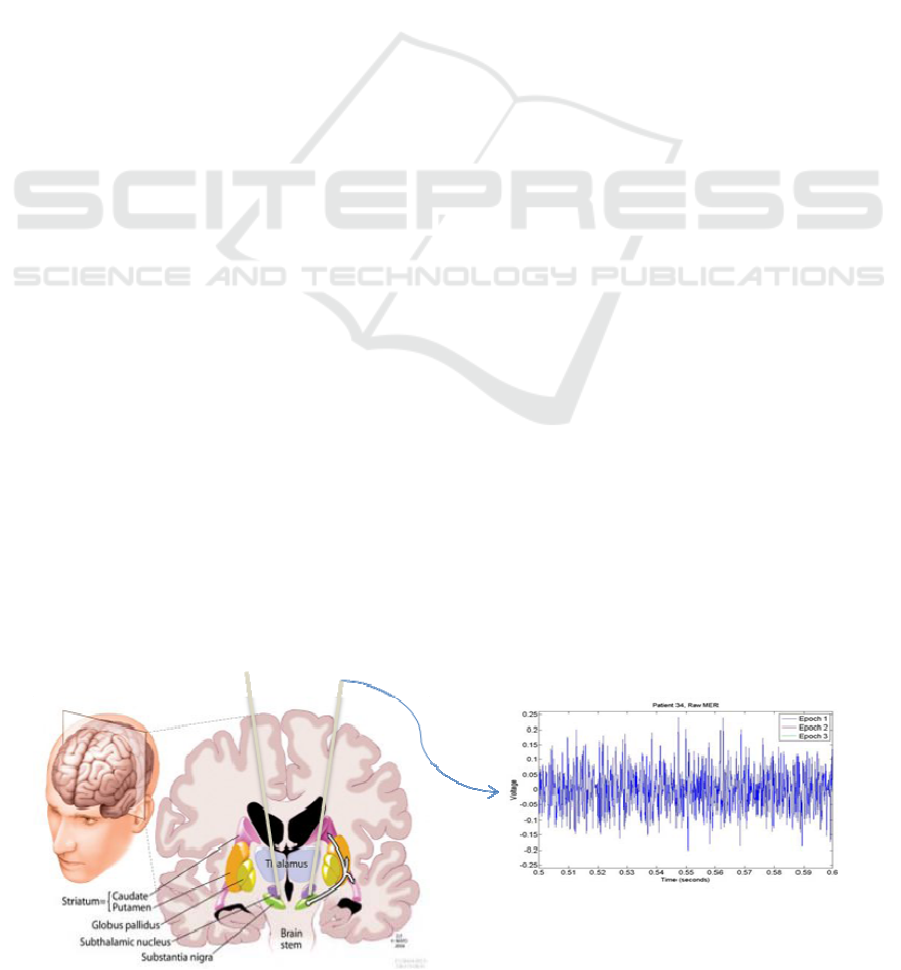
Figure 1: The micro-electrode recordings (MER) are acquired by inserting an electrode into a deep brain structure. The
electrical activity of the neurons surrounding the electrode can couple to it producing a voltage time series.
76
J. Weegink K., Varghese J., Bellette P., Coyne T., Silburn P. and Meehan P..
AN EFFICIENT STOCHASTIC BASED MODEL FOR SIMULATING MICROELECTRODE RECORDINGS OF THE DEEP BRAIN - Modelling and
Analysis.
DOI: 10.5220/0003782400760084
In Proceedings of the International Conference on Bio-inspired Systems and Signal Processing (BIOSIGNALS-2012), pages 76-84
ISBN: 978-989-8425-89-8
Copyright
c
2012 SCITEPRESS (Science and Technology Publications, Lda.)

diameter around 50 um, into the nucleus structure
(figure 1) located via MRI and CT scans.
To confirm the correct location of the implanted
DBS electrodes, patients are awake to perform
neurological tests. This gives an opportunity to
monitor the candidate nucleus, for stimulation, while
the patients perform tasks. Recent work has shown
that with the correct measure, correlations between
MER recordings and patient response to symantic
tests has been demonstrated (P. A. Meehan &
Bellette, 2009; Paul A. Meehan et al., 2011;
Varghese et al., 2011).
Currently there has also been work on
developing a bi-directional brain-machine interface
for DBS treatment (Rouse et al., 2011). To further
develop these research paths appropriate methods
for efficient real time simulations to estimate neural
network behaviour are required. For instance
developing a metric that can characterise the
underlying neural behaviour from a MER, a better
understanding of the process in DBS could be made.
Current MER models only consider the
behaviour of the closest neuron and reduce the
further neurons to a local field noise (Santaniello,
Fiengo, Glielmo, & Catapano, 2008). For feedback
control of DBS the behaviour of the neural network
needs to be modelled, as it has been shown that
analysis of the closest neuron to the electrode is
insufficient (Rouse, et al., 2011). Using the current
non-linear neuron models of DBS (Rubin & Terman,
2004) for this type of feedback controller would be
too computationally intensive, for this reason models
that can take into account a large number of neurons
and display markers of pathalogical states efficiently
are needed.
In this paper we develop numerical probabilistic
models, using a point process (PP) in order to create
a much more computationally efficient model of
networked neurons. Each neuron is coupled to the
electrode, using a non-homogenous model for the
extracellular medium, via a filter function derived
from a conductance based model for the STN
extacellular current during an action potential (AP).
We use the model to compare with real patient
MERs and an analytical model using frequency
based analysis. This type of numerical model could
potentially be used in a clinical setting as part of a
feedback controller for DBS, alleviating the clinical
load of optimizing the device settings.
2 METHODS
There are several aspects to modelling and analysing
deep brain signals. The system is a complicated
system with many levels of dynamics required to
create a MER. Section 2.1 contains the procedure
used to acquire patient MERs. The factors that
contribute to modelling a MER; modelling the
behaviour of a single neuron, the network behaviour,
the neuron electrode interaction and the electrical
equipment processing the signal are detailed in the
section 2.2. A simple analytical model is presented
in 2.3 for comparison to the numerical model and to
provide more insight into how the statistical
distribution influences the expected power spectrum.
The methods of the comparative analysis are then
summarized in 2.4.
2.1 Experimental Procedure - Patient
MER Acquisition
MERs are acquired from participants with idiopathic
PD who were considered suitable for the
implantation of bilateral permanent stimulators in
the STN. Fused MRI and stereotactic CT images and
direct visualisation of FLAIR (Fluid-attenuated
inversion recovery) MRI images displayed by
Stealthstation (Medtronic Inc., Minneapolis, MN)
were used to target the STN.
During surgery characteristic STN firing patterns
were used to confirm the STN location by the
neurologist and neurosurgeon. More details of the
surgical procedure are reported in Coyne et al.
(Coyne et al., 2006).
MERs were acquired with a Tungsten
microTargeting
®
electrode (model mTDWAR, FHC,
Bowdoinham, ME) with a tip diameter of less than
50µm and impedance of approximately 0.5 MΩ (±
30%) at 1 kHz. MERs were filtered (500-5000 Hz)
and recorded at a sampling rate of 24 kHz from
LeadPoint™ (Medtronic Inc., Minneapolis, MN).
2.2 Numerical Modelling
of Micro-Electrode Recordings
A MER is created by the activity of the neurons
around the recording electrode. The neurons
generate currents and hence electric fields that
propagate through the different structures of the
brain tissue, which can attenuate and filter the signal
(Garonzik, Ohara, Hua, & Lenz, 2004). Finally the
field incident on the electrode is processed by the
electrical equipment to produce the recording.
Models of MERs have been developed that
consider single unit recordings, made from a
stochastic single neuron with random noise
(Santaniello, et al., 2008) and local field potentials
AN EFFICIENT STOCHASTIC BASED MODEL FOR SIMULATING MICROELECTRODE RECORDINGS OF THE
DEEP BRAIN - Modelling and Analysis
77

(LFP) created using the spike trains of
simultaneously recorded in-vivo cells (Bedard &
Destexhe, 2009). However neither of these models
allow for real time simulations with dynamically
altering network behaviour.
To effectively model a MER which would allow
real time simulations, there are several different
stages that need to be taken into consideration. The
four separate areas we are to model are the
behaviour of the neural network, the electrical
dynamics of individual neurons, the coupling of the
electric fields from a neuron to the electrode and the
processing of the signal by the electronics.
2.2.1 Neural Networks
For a MER a large number of neurons in the
structure surrounding the electrode contribute to the
signal. Dynamic models of neurons and neural
networks are common for simulating brain
structures(Feng, Shea-Brown, Greenwald, Kosut, &
Rabitz, 2007; Izhikevich, 2007a, 2007b; Rubin &
Terman, 2004; Terman, Rubin, Yew, & Wilson,
2002). These types of models, using synaptic
connections between neurons with dynamical neuron
models, can be very computationally intensive
(Long & Fang, 2010). To reduce the computational
burden of modelling individual neurons with
synaptic connections, the firing times of each neuron
can be characterized by a stochastic variable. This
variable is produced from a probability distribution
that depends upon the behaviour of the network.
This type of model is a point process (Perkel,
Gerstein, & Moore, 1967a, 1967b).
For single neurons the spiking statistics are often
modelled by a Poisson distribution of inter spike
interval (ISI) times. The participants for the deep
brain MER recordings are undergoing treatment for
a pathological state that is treated by altering STN
function. This could imply abnormal function of the
STN where the firing is not best described by a
Poisson distribution in ISIs.
A probability distribution that can give the
common types of behaviour found in neurons, such
as bursting, Poisson and periodic behaviour, is the
Weibull distribution (Li, 2011; McKeegan, 2002;
Perkel, et al., 1967a, 1967b). This type of
distribution can reduce to a Poisson distribution if
the shape parameter is equal to one, takes the form
of a Rayleigh distribution if the shape parameter is
larger than two and burst fire behaviour is produced
as it goes below one.
The point process simulation is performed using
MATLAB 7.12.0 (R2011a) on a PC with a quad
core 1.73GHz processor and 8.0 GB of RAM. A
spatial distribution of 3000 neurons is randomly
generated, shown in figure 2, that follows the radial
density of neurons (
(
)
) given in equation (1)
using a spatial neuron density of =10
.
(
)
=4
.
(1)
Figure 2: The radial distribution of neurons used for
simulations. The volume of tissue for the simulation
depends on the number of neurons simulated.
All simulations are performed over a three
second period. Time series of Dirac pulses are
created for each neuron by drawing interval times
for spike occurrences from a probability distribution.
Weibull distributions are used to generate the ISIs
given by
(
)
=
>
0 ≤
,
(2)
is the scale parameter that controls the rate and is
set to 10 Hz. The shape parameter c is varied to
control the neuron behaviour; with ≪1 generating
bursting, =1 Poissonian and ≫1 periodic
behaviour. The parameter
controls the refractory
time of the neuron and set to 5 ms, preventing
another action potential occurring for the same
neuron in this period. The first spike for each neuron
uses =1 with
=0. Each time series is convolved
with the EAP for an STN neuron by taking the
product in the frequency domain. The time series
data for each neuron are then superimposed to create
the voltage at the electrode.
2.2.2 Neuron Dynamics
Using a PP model for the neural network, the
dynamics of each neuron have been reduced to an
‘on’ or ‘off’ state. To develop the correct response
for a neuron when in the ‘on’ state, conductance
models such as the Hodgkin and Huxley (HH)
model can be used to generate the behaviour of the
BIOSIGNALS 2012 - International Conference on Bio-inspired Systems and Signal Processing
78
individual neuron, when an action potential occurs.
The HH model can calculate the extracellular
currents around a neuron which is required for
determining the voltage seen by an electrode. It has
previously been demonstrated STN cells can be
simulated effectively using this type of model
(Terman, et al., 2002). More computationally
efficient mathematical models of neurons are not
considered since these types of models cannot
always reproduce the correct shape of the action
potential waveform, and this feature is important
when considering the windowed power spectrum.
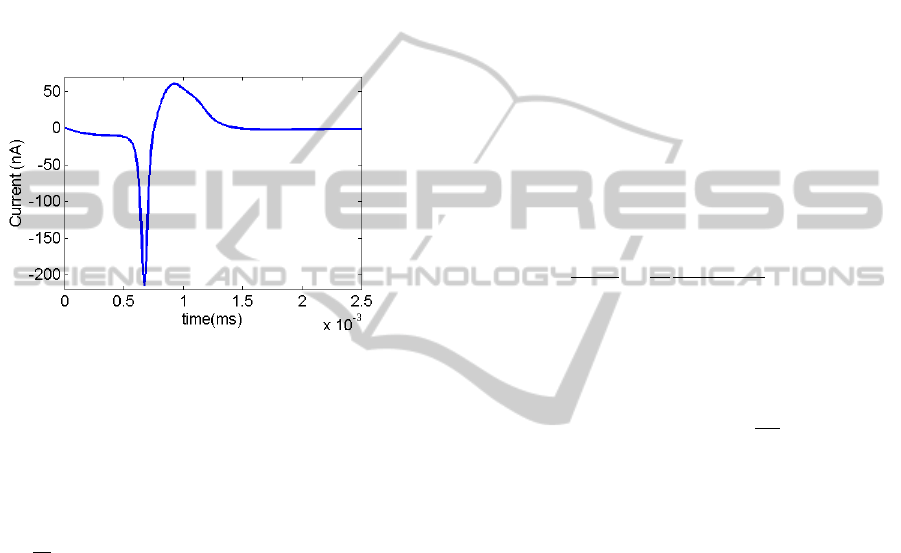
Figure 3: The extracellular current used for each neuron
generated using equation (3).
The STN cell is modelled using a single
compartment conductance based model described by
a modified version of the HH equation, based on
(Feng, et al., 2007; Rubin & Terman, 2004; Terman,
et al., 2002):
=−
(
−
)
−
(
−
)
−
ℎ
(
−
)
−
(
−
)
−
(
−
)
,
(3)
where
is the membrane capacitance and set to
1
⁄
;
,
are the leak conductance and
reversal potential (2.25/
and −60.0
respectively);
,
are the
conductance and
equilibrium potential (45/
and −80.0
respectively);
,
are the
conductance and
equilibrium potential (37.5/
and 55.0
respectively);
is a low-threshold T-type Ca
2+
conductance (0.5/
); and
,
are a high-
threshold Ca
2+
conductance and a Ca
2+
equilibrium
potential (0.5/
and 140.0 respectively).
The gating variables , , ℎ, and follow the
differential equations given in (Terman, et al., 2002)
using the parameters given in their table 1. The
dynamics of a single neuron are modelled in
NEURON (Hines & Carnevale, 1997) using
equation (3) to generate the extracellular current
during an action potential, shown in figure 3.
2.2.3 Neuron/Electrode Interaction
The electrode senses the neuron dynamics through
the electric field that propagates from the neuron.
This electric field is known as the extracellular
action potential (EAP). The EAP is generated by
ionic currents around the active neuron. As the EAP
propagates through the extracellular space to the
electrode it will pass through regions of space with
different conductivity and permittivity. This will
cause filtering effects along with attenuation of the
field. This means that the electrode will record a
different EAP for each neuron depending upon the
distance from the electrode and the media in
between.
The complex impedance (
(
)
) for the
interaction of each neuron with the electrode over
the range of radii is calculated by (Bedard, Kroger,
& Destexhe, 2004),
(
)
=
()
(
)
(
)
(
)
(
)
′
,
(4)
where is the conductivity in the extracellular
medium, is the permittivity in the extracellular
medium and R is the spherical radial size of each
neuron. An exponentially decaying conductance
(
)
=
(
)
+
(
1−
)
e
,
(5)
with a space constant =500, cell radius
=10, conductivity at the cell
(
)
=
1.5/ and a normalized low amplitude
conductivity
=2×10
; and a constant
normalized permittivity =10
/ were used
following Bedard (2004). The EAP waveform in the
frequency domain for each neuron is calculated
using the complex impedance and the FFT of the
extracellular current.
The voltage (
), in terms of the frequency
components, at the electrode caused by a neuron is
then calculated using Ohm’s law (Bedard, et al.,
2004),
()=
(),
(6)
where
is the frequency component of the current
at the neuron.
2.2.4 Electrical Processing
To properly analyse a MER the effects of the
electrical equipment, on the recording, need to be
included. These effects include the introduction of
noise, such as that due to sampling rate, clock
AN EFFICIENT STOCHASTIC BASED MODEL FOR SIMULATING MICROELECTRODE RECORDINGS OF THE
DEEP BRAIN - Modelling and Analysis
79

stability and thermal noise, and any filtering that
occurs. These issues could greatly affect the ability
of a measure to differentiate the neuronal behaviour
from the electrical effects.
The first such noise source is the noise present
from thermal fluctuation of electrons in the
microelectrode (Akingba, Wang, Chen, Neves, &
Montemago, 2003). This type of noise is known as
Johnson-Nyquist noise and is characterized by
having zero mean voltage and a variance dependant
on the temperature, resistance and frequency
bandwidth.
The phase noise is not considered in this analysis
due to the stability of the 10 MHz clock typically
used and the comparatively small sample rate of 24
kHz. Digitization noise can be accounted for by
producing the final MER of the simulation with the
same time step that the patient data is recorded at.
Finally any filters can be added using the filter
transfer function in the post processing of the MER
simulation.
Thermal noise on the electrode is added as white
noise using
〈
〉
=0,
(7)
〈
〉
=4
Δ
,
(8)
where
is Boltzmann’s constant, is the
temperature, is the resistance,Δ is the bandwidth
and
〈〉
is the time average, it is found that for a 0.5
MΩ resistor at body temperature (37
o
C) the thermal
noise can be between 10-30% of the size of the
neural signal.
The recording is filtered with a 6
th
order low
pass Butterworth filter with a corner frequency of 5
kHz and a 3
rd
order high pass filter with a corner
frequency of 500 Hz. The final MER from the
simulation is produced with a sample rate of 24 kHz
to create the same digitization effects as present in
the patient data.
2.3 Simplified Analytical Model
of Micro-Electrode Recordings
The MER may be analytically modelled by a
superposition of independent spike trains, equivalent
to the numerical model using a point process. The
PSD for a PP model will be a filtered version of the
PSD for the EAP waveform. For independent
overlapping pulse trains, with the same shape
waveform for each pulse, it has been shown (Banta,
1964) that the power spectrum (
()) for the MER
can be written as
()=
(
)
−2
(
)
(
)
,
(9)
where () is the PSD of the waveform, () is
the characteristic function (Fourier transform) of the
probability distribution for the aggregate spiking
statistics, is the number of pulses per unit time and
is the amplitude of the pulses with
representing
the ensemble average.
Although this equation for the PSD takes into
account the attenuation caused by the extracellular
medium on the spike waveform it does not take into
account the frequency filtering effects.
This equation can however be used to see
expected behaviour of different simulations. The
bracketed term can be thought of as a filter, which is
a function of the spiking probability, applied to the
waveform PSD. By looking at this term the filtering
effects caused by the different probability functions
can be examined.
2.4 Procedure for Comparison of
Numerical and Experimental
Results
The most intuitive way to analyse the noise of an
MER is to look at the PSD. This was first done by in
1979 (McNames, 2004) using a circuit equivalent of
a Fourier Transform (FT). In recent years analysis of
MERs has progressed into the digital domain. The
majority of these techniques still involve analysis of
the PSD.
Neuron spiking behaviour can be examined
through MER PSDs. It was shown how
behaviour in the PSD can arise from shot noise type
behaviour of neurons spiking (Milstein, Mormann,
Fried, & Koch, 2009), while
behaviour may be
due to filtering by reactive extracellular media, or
due to complex self-organized critical phenomena
(Bedard & Destexhe, 2009).
Complex measures have been used to look at
MERs, and it has been shown that some techniques,
such as the Non-Markov parameter (NMP) relate to
the PSD (Varghese, et al., 2011).
The windowed PSD will not capture transient
behaviour in the MER. To view this transient
behaviour a spectrogram can be used. This involves
dividing the signal into smaller time bins. The PSD
is taken for each time bin to see the PSD as a
function of time for the MER.
A windowed PSD is taken of the time series data
from the simulation using a Gaussian window with
an
width of 1/50
th
of the signal length. The PSD
is then averaged of 5 trials of the simulation with the
same firing statistics. This is compared to the
windowed PSD of a three second signal averaged
over 5 recordings.
BIOSIGNALS 2012 - International Conference on Bio-inspired Systems and Signal Processing
80
Spectrograms are produced with the same time
intervals used for the windowed PSD. The
spectrograms consist of a series of instantaneous
PSD over each time interval. The spectrograms are
then used to compare the stationary behaviour of the
power spectrum for different ISI probability
distributions and the patient data.
3 RESULTS AND DISCUSSION
The results from the numerical simulations are
presented in this section and are then compared to
the experimental results and analytical predictions.
Subsection 3.1 summarises the numerical results and
provides a comparison with MERs acquired from
patients. The time series, windowed power spectrum
and spectrogram for three different simulation
parameters are used. Subsection 3.2 includes details
of the results from the simple analytical model,
comparing how the power spectrum of the EAP is
modified under the different spiking statistics used
to produce the MERs from the numerical models.
3.1 Numerical and Experimental
Results Comparison
The time series of voltage from the simulations has
been plotted for three different firing probability
distributions and compared to a patient recording
(Figure 4). For ≅1 the time series have similar
features to the patient data. Differences can only be
seen for large deviations from =1. As case
examples for their characteristic behaviour extreme
cases of have been used. As ≪1, bursting
behaviour is visible in the time series and for ≫1
periodic spiking becomes apparent.
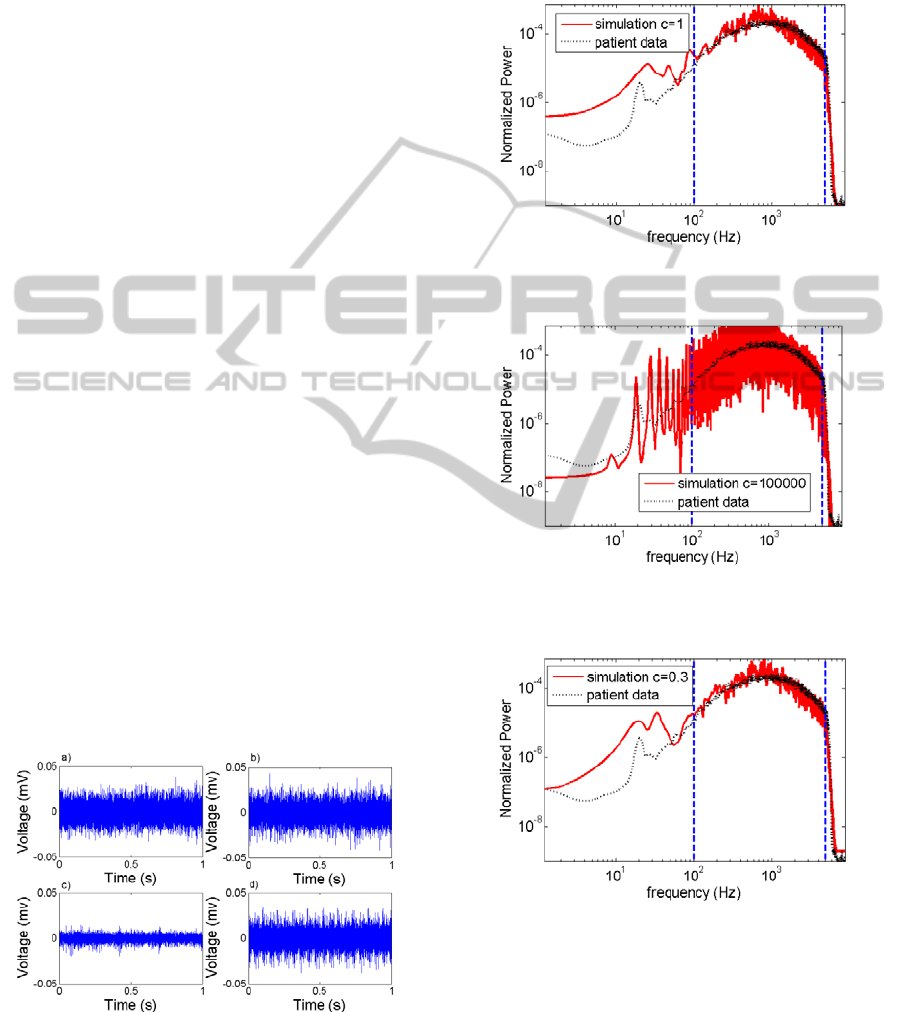
Figure 4: Comparison of a) Patient MER to simulations
with b)=1 , c) ≪1and d) ≫1.
The simulations were calculated at a rate of 6
milli seconds per neuron per second of
computational time, a 200 fold increase on
dynamical models that reproduce accurate waveform
shapes (Long & Fang, 2010).
Figure 5: Overlap of the real patient windowed PSD over
the windowed PSD of the simulation for =1.
Figure 6: Overlap of the real patient windowed PSD over
the windowed PSD of the simulation for ≫1.
Figure 7: Overlap of the real patient windowed PSD over
the windowed PSD of the simulation for ≪1.
The windowed PSD for all three simulations and
the patient recordings, seen in figures 5, 6 & 7, have
three main regions. The first region is the filter drop
off above 5 kHz. This feature is present in all 4
PSDs with good agreement between patient data and
simulations. The thermal noise term added is white
AN EFFICIENT STOCHASTIC BASED MODEL FOR SIMULATING MICROELECTRODE RECORDINGS OF THE
DEEP BRAIN - Modelling and Analysis
81
noise and as such adds the same power to every
frequency, shifting the PSD up. This effect is
removed by normalizing the power spectrum to
integrate to unity. The other electrical effects; high
and low pass filtering; do however alter the
normalized power spectrum, seen by the sharp
falloff in power in this region.
The second region is the behaviour at high
frequencies (100-5000 Hz). The two simulations
with ≤1 have good agreement with patient data in
this region shown in figures 5 & 7. The simulation
with ≫1 (figure 6) has structure in this region that
can be explained as harmonics of features in the low
frequency region. The overall shape in this region is
dominated by the waveform of the EAP.
The final region of interest is in the region below
100 Hz. This region is thought to contain
information of the Local field potential (LFP).
Experimentally this region has an electronic filter,
with a slow drop off. For ≫1 this region has a
sharp peak at 10 Hz, the simulated spike rate, and
then has peaks at the harmonic frequencies of n10
Hz, where n is an integer. The other two cases have
anomalous peaks in this region similar to the 20 Hz
peak in the patient data. This beta band peak (12-30
Hz) has been seen in PD MER recordings previously
and has been implicated in the pathological state
(Eusebio & Brown, 2009).
Besides the PSD for ≫1, the problem with
comparing the average PSD is that they appear very
similar between 100-5000 Hz with differences
below 100 Hz. Another method to examine the
spectral properties of an MER is to look at the
spectrogram, figure 8, and to observe changes in the
power spectrum over time.
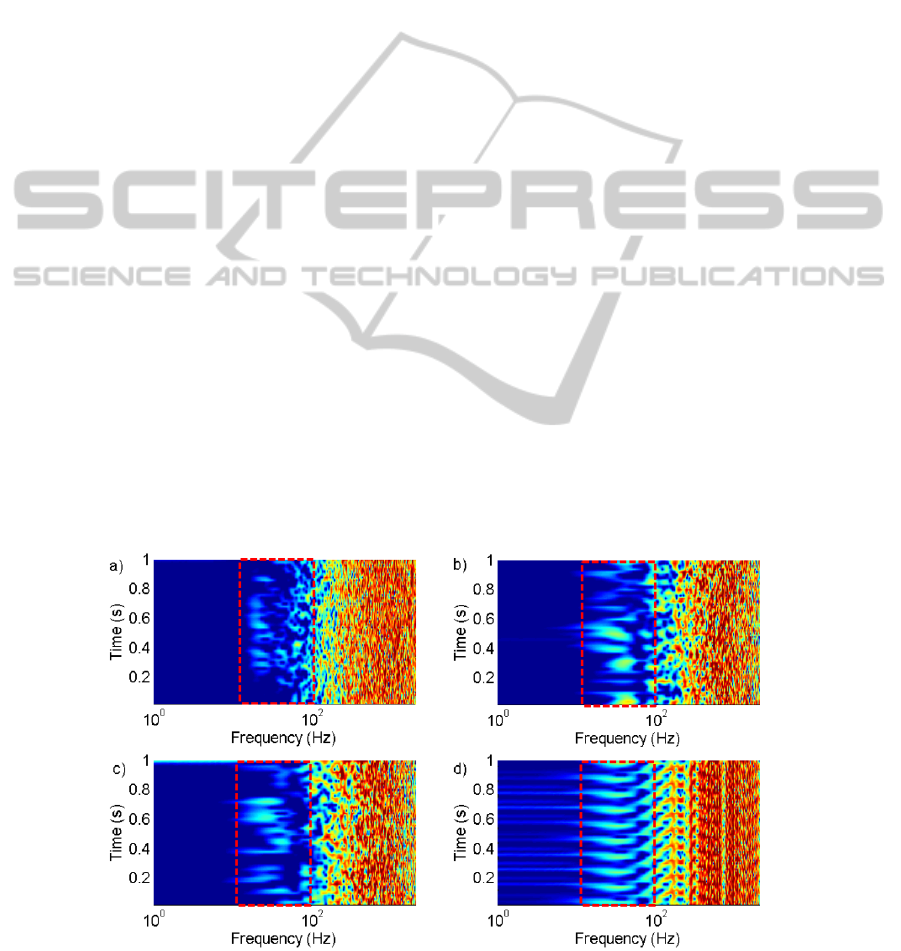
From the spectrogram for the typical patient
MER recording it can be seen that the PSD changes
in time. These recordings show the feature in the
beta band appearing and disappearing through the
recording.
When the numerical simulations were performed
with ≫1, the PSD appears periodic stationary.
This behaviour can be seen in figure 8 d). When c is
set to one or below features of the PSD appears to
change in time in the beta band. This is similar
behaviour to the PSD for the patient data.
This analysis suggests that ≅1 qualitatively
represents the patient data the best from the options
tried. This supports the idea that spiking behaviour
in a large network appears Poisson (Câteau & Reyes,
2006; McNames, 2004; Stevens & Zador, 1998).
3.2 Analytical Predictions
The results from equation (5) show the effect of
changes in the aggregate probability distribution.
Equation (5) can be thought of as a spike waveform
filter that is dependent on the probability distribution
through
(
)
1−
(
)
⁄
. Figure 9 shows the
frequency behaviour of equation (5) for different
values of
, if the statistics follow a Weibull
distribution.
For ≫1 and =1 figure 9 shows the
frequency filtering effects due to the spiking
statistics are flat and will not add noticeable features
in the PSD below 100 Hz. This analytical model
doesn’t take into account the frequency filtering of
Figure 8: Spectrograms with the region displaying beta band behaviour boxed in red, a) patient MER showing transient beta
band behaviour, b) simulations ≪1 showing transient beta band behaviour, c) =1 showing transient beta band
behaviour and d)≫1 showing periodic behaviour.
BIOSIGNALS 2012 - International Conference on Bio-inspired Systems and Signal Processing
82
more distant neurons by the extracellular medium.
Figure 9 a) shows how the extracellular medium
model acts as a low pass filter. For these reasons this
model is not sufficient to describe the features seen
in the numerical simulations below 100 Hz.
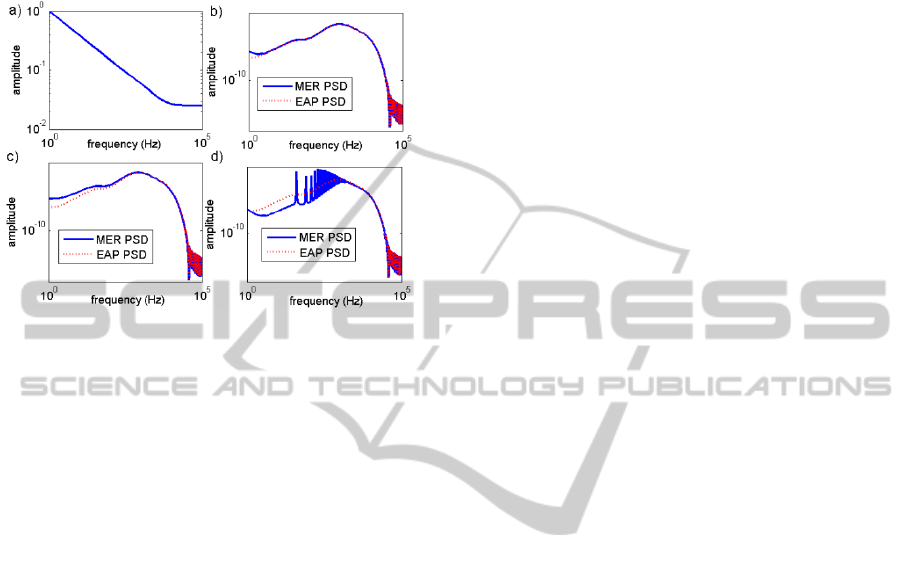
Figure 9: a) The filter function of the extracellular medium
at 0.2. Inserts b)-d) show the comparison of the power
spectrum of the EAP with the MER power spectrum from
the analytical model, b) the MER PSD for =1 modelled
by equation (9), it can be seen that for this distribution the
results of the MER and EAP PSDs are in agreement, c) the
MER PSD for ≫1 modelled by equation (9), d) the
MER PSD ≪1 modelled by equation (9).
For ≫1 the 10 Hz peak with harmonic peaks
in the numerical simulation can be seen in the
frequency effects from equation (9), shown in figure
9, if the aggregate probability distribution maintains
the single neuron ISI probability shape.
The problem with this analysis is that we have
assumed that the distribution controlling the ISIs is
stationary in time. Equation (9) cannot account for
ISI distributions that change in time. The non-
stationary nature of the real patient PSD could
suggest that the probability distribution describing
the neuron firing may not be stationary. This
behaviour can alternatively be explained by the
probabilistic nature of the simulation and the time
period the PSD is taken over. This is demonstrated
by the simulations using the PP model showing
similar non stationary behaviour under the same
analysis, even though the probability distribution of
ISIs was stationary in time.
4 CONCLUSIONS
MERs were efficiently simulated using a PP model
with a conductance model for generating the EAP,
taking into account extracellular frequency filtering
and attenuation; and the effects of the recording
electronics. The simulations perform approximately
200 times faster than using a Hodgkin and Huxley
model for all of the neuron dynamics (Long & Fang,
2010). With this computationally efficient model
very good agreement was achieved when comparing
the windowed PSD of the simulated MERs with real
patient data for frequencies above 100 Hz.
Below 100 Hz the PSD of patient MERs are not
stationary, which can be reproduced using a time
stationary probability distribution for the ISI. Since
the model is a probabilistic model that treats the
neurons as point sources rather than a full dynamical
model, the neurons are either in an ‘on’ or ‘off’
state. This means it cannot produce neural features
such as sub-threshold oscillations and cellular
activity such as synaptic currents. These features
may be critical for describing the features below
100Hz sufficiently.
The analytical model using the results from
Banta (1964) showed features that were present in
the simulations, such as the harmonic structure
present in the windowed PSD for simulations with
≫1. This type of analysis could allow for
characterization of the ISI probabilities of patient
MERs from the windowed PSD.
To account for the features in the beta band (10-
35 Hz) more complex models; including explicit
network interactions and full cell dynamics, such as
sub-threshold oscillations, may be required.
Future work could include performing the
inverse problem of finding the shape and rate
parameters that best describe a patient MER. The
results from this study could be used to find markers
that may be applicable in the clinical environment
for optimising DBS and potentially operating in a
feedback controller.
ACKNOWLEDGEMENTS
The authors are greatly indebted to PD specialists of
St. Andrew’s War Memorial and The Wesley
Hospitals, Australia for their motivation, guidance,
interdisciplinary expertise and funding.
REFERENCES
Akingba, A. G., Wang, D., Chen, P.-s., Neves, H., &
Montemago, C. (2003). Application of nanoelectrodes
in recording biopotentials. Paper presented at the
IEEE-NANO 2003.
AN EFFICIENT STOCHASTIC BASED MODEL FOR SIMULATING MICROELECTRODE RECORDINGS OF THE
DEEP BRAIN - Modelling and Analysis
83

Banta, E. (1964). A note on the correlation function of
nonindependent, overlapping pulse trains. Information
Theory, IEEE Transactions on, 10(2), 160-161.
Bedard, C., & Destexhe, A. (2009). Macrascopic Models
of Local Field Potentials and the Apparent 1/f Noise in
Brain Activity. Biophysical Journal, 96, 2589-2603.
Bedard, C., Kroger, H., & Destexhe, A. (2004). Modeling
Extracellular Field Potentials and the Frequency-
Filtering Properties of Extracellular Space.
Biophysical Journal, 86, 1829-1842.
Câteau, H., & Reyes, A. D. (2006). Relation between
Single Neuron and Population Spiking Statistics and
Effects on Network Activity. Physical Review Letters,
96(5), 058101.
Coyne, T., Silburn, P. A., Cook, R., Silberstein, P.,
Mellick, G., Sinclair, F.,& Stowell, P. (2006). Rapid
subthalamic nucleus deep brain stimulation lead
placement utilising CT/MRI fusion, microelectrode
recording and test stimulation. Acta Neurochirurgica
Suppl(99), 49-50.
Eusebio, A., & Brown, P. (2009). Synchronisation in the
beta frequency-band--the bad boy of parkinsonism or
an innocent bystander? Experimental Neurology,
217(1), 1-3.
Feng, X.-J., Shea-Brown, E., Greenwald, B., Kosut, R., &
Rabitz, H. (2007). Optimal deep brain stimulation of
the subthalamic nucleus—a computational study. J.
Comput. Neurosci.(23), 265–282.
Garonzik, I. M., Ohara, S., Hua, S. E., & Lenz, F. A.
(2004). Microelectrode Techniques: Single-Cell and
Field Potential Recordings. In Z. Israel & K. J.
Burchiel (Eds.), Microelectrode recordings in
movement disorder surgery (Vol. 1). New York:
Thieme Medical Publishers, Inc.
Hines, M. L., & Carnevale, N. T. (1997). The NEURON
Simulation Environment. Neural Computation, 9(6),
1179-1209. doi: 10.1162/neco.1997.9.6.1179
Izhikevich, E. M. (2007a). Dynamical Systems in
Neuroscience. Cambridge: MIT Press.
Izhikevich, E. M. (2007b). Solving the distal reward
problem through linkage of STDP and dopamine
signaling. Cerebral Cortex, October(17), 2443-2452.
Li, C. (2011). A Model of Neuronal Intrinsic Plasticity.
Autonomous Mental Development, IEEE Transactions
on, PP(99), 1-1.
Long, L. N., & Fang, G. (2010). A Review of Biologically
Plausible Neuron Models for Spiking Neural
Networks. Paper presented at the AIAA
InfoTech@Aerospace Conference, Atlanta, GA.
McKeegan, D. E. F. (2002). Spontaneous and odour
evoked activity in single avian olfactory bulb
neurones. Brain Research, 929(1), 48-58. doi:
10.1016/s0006-8993(01)03376-5
McNames, J. (2004). Microelectrode Signal Analysis
Techniques for Improved Localization. In Z. Israel &
K. J. Burchiel (Eds.), Microelectrode recordings in
movement disorder surgery (Vol. 1). New York:
Thieme Medical Publishers, Inc.
Meehan, P. A., & Bellette, P. A. (2009). Chaotic Signal
Analysis of Parkinson's Disease STN Brain Signals.
Paper presented at the Topics in Chaotic Systems.
Meehan, P. A., Bellette, P. A., Bradley, A. P., Castner, J.
E., Chenery, H. J., Copland, D. A.,& Silburn, P. A.
(2011). Investigation of the Non-Markovity Spectrum
as a Cognitive Processing Measure of Deep Brain
Microelectrode Recordings. Paper presented at the
BIOSIGNALS 2011- International Conference on Bio-
Inspired Systems and Signal Processing, Rome, Italy.
Milstein, J., Mormann, F., Fried, I., & Koch, C. (2009).
Neuronal Shot Noise and Brownian 1/f^2 Behavior in
the Local Field Potential. PLoS One, 4(2), e4338
4331-4335.
Perkel, D. H., Gerstein, G. L., & Moore, G. P. (1967a).
Neuronal Spike Trains and Stochastic Point Processes
I. Biophys J., 7(4), 391–418.
Perkel, D. H., Gerstein, G. L., & Moore, G. P. (1967b).
Neuronal Spike Trains and Stochastic Point Processes
II. Biophys J., 7(4), 419–440.
Rouse, A. G., Stanslaski, S. R., Cong, P., Jensen, R. M.,
Afshar, P., Ullestad, D., & Denison, T. J. (2011). A
Chronic Generalizaed Bi-directional Brain-Machine
Interface. J. Neural Eng., 8(036018).
Rubin, J. E., & Terman, D. (2004). High Frequency
Stimulation of the Subthalamic Nucleus Eliminates
Pathological Thalamic Rhythmicity in a
Computational Model. Journal of Computational
Neuroscience(16), 211–235.
Santaniello, S., Fiengo, G., Glielmo, L., & Catapano, G.
(2008). A biophysically inspired microelectrode
recording-based model for the subthalamic nucleus
activity in Parkinson’s disease. Biomedical Signal
Processing and Control(3), 203–211.
Stevens, C. F., & Zador, A. M. (1998). Input synchrony
and the irregular firing of cortical neurons. Nature
Neuroscience 1, 210 - 217. doi: 10.1038/659
Terman, D., Rubin, J. E., Yew, A. C., & Wilson, C. J.
(2002). Activity Patterns in a Model for the
Subthalamopallidal Network of the Basal Ganglia. The
Journal of Neuroscience, 7(22), 2963–2976.
Varghese, J. J., Weegink, K. J., Bellette, P. A., Meehan, P.
A., Coyne, T., & Silburn, P. A. (2011). Theoretical &
Experimental Analysis of the Non Markov Parameter
to Detect Low Frequency Synchronisation in Time
Series Analysis. Paper presented at the Engineering in
Medicine and Biology Society, Annual International
Conference of the IEEE, Boston Massachusetts.
BIOSIGNALS 2012 - International Conference on Bio-inspired Systems and Signal Processing
84
