
RESPIRATORY SOUND ANNOTATION SOFTWARE
João Dinis
1
, Guilherme Campos
2
, João Rodrigues
2
and Alda Marques
1
1
Escola Superior de Saúde (ESSUA), University of Aveiro, 3810-193 Aveiro, Portugal
2
Instituto de Engenharia Electrónica e Telemática de Aveiro (IEETA), University of Aveiro, 3810-193 Aveiro, Portugal
Keywords: Adventitious lung sounds, Respiratory cycles, Crackles, Wheezes, Diagnosis, Respiratory diseases, COPD,
Asthma, Cystic fibrosis, Pneumonia.
Abstract: Significant research efforts have been dedicated to the automatic detection of adventitious lung sounds,
using, for this purpose, different algorithms. The validation of these algorithms is based on the comparison
of their results with reference annotations and therefore requires the development of user-friendly
annotation software. This paper presents an application, developed in Matlab®, for the annotation of
respiratory sounds. The user can identify respiratory cycles and adventitious sounds – crackles and wheezes
– directly on the waveforms displayed on the screen, which may be simultaneously played back. The audio
playback speed is user-adjustable and synchronised with the cursor display. Specific annotation file storage
formats were defined. Preliminary usability tests performed by three health professionals using twenty
respiratory sound files from six patients (with pneumonia and cystic fibrosis) indicate that the software is
user-friendly and effective, allowing simple and quick annotations.
1 INTRODUCTION
It is estimated that chronic obstructive pulmonary
disease (COPD) and asthma affect between 10% to
25% of the adult European population (Sovijärvi et
al., 2000b). In the USA, these diseases affect more
than 50 million people (Bloom et al., 2009); (Pleis et
al., 2009). As a result of this high prevalence, the
research effort dedicated to improving diagnosis,
monitoring and treatment methods for respiratory
diseases has significantly increased during the last
decade.
Auscultation has been the main tool used by
health professionals to diagnose and monitor cardio-
respiratory diseases, as it is non-invasive, quick,
effective and easy to use. The goals of auscultation
are to detect adventitious lung sounds (ALSs), i.e.,
artefacts superimposed on the normal respiratory
sounds and considered symptoms of respiratory
system pathologies (Sovijärvi et al., 2000a), and to
observe their characteristics (intensity, duration,
etc.) in different chest locations. This is crucial in
diagnosing disease severity and location.
ALSs are normally grouped into two main
classes: crackles and wheezes. They can be generally
characterised as follow:
Wheezes are pitch-based sounds sustained for
longer than 100 ms with frequencies above 100 Hz
(Sovijärvi et al., 2000a). Wheezes can be
monophonic (single frequency) or polyphonic
(multiple frequencies) and are mainly associated
with COPD and asthma (Waris et al., 1998). They
occur mostly during expiration, but can also be
observed during inspiration in more severe cases.
There is a direct relationship between the wheeze
occupation rate in a respiratory cycle and the
severity of the pathology (Shim and Williams,
1983).
Crackles are explosive, discontinuous sounds
which can occur in both respiratory phases, being
more frequent during inspiration. Crackles can be
classified as fine (short duration) or coarse (long
duration) according to their duration, waveform, and
time of occurrence within a respiratory cycle. The
number of crackles in a respiratory cycle is also an
important indicator of the severity of pulmonary
pathologies (Piirila and Sovijärvi, 1995).
It is difficult to objectively detect and classify ALSs,
because standard auscultation is a subjective
process: it depends on the experience and skill of its
users (Sovijärvi et al., 2000b), their ability to
memorise different sound patterns (Marques et al.,
2006) and it is also influenced by stethoscope
183
Dinis J., Campos G., Rodrigues J. and Marques A..
RESPIRATORY SOUND ANNOTATION SOFTWARE.
DOI: 10.5220/0003756301830188
In Proceedings of the International Conference on Health Informatics (HEALTHINF-2012), pages 183-188
ISBN: 978-989-8425-88-1
Copyright
c
2012 SCITEPRESS (Science and Technology Publications, Lda.)

technology. This has experienced constant evolution,
through the use of not only better sensors and
acoustic coupling techniques, but also electronic
methods of signal transduction, conditioning,
amplification and noise reduction. The advent of
digital stethoscopy, allowing the application of
advanced digital signal processing techniques, was
pioneer in the development of algorithms for
automatic detection and classification of ALSs.
Numerous algorithms have been proposed for both
wheezes (e.g. (Qiu et al., 2005); (Taplidou and
Hadjileontiadis, 2007)) and crackles (e.g.
(Vannuccini et al., 1998); (Lu and Bahoura, 2008))
automatic detection. There is also interest in
automating the detection of respiratory phases (e.g.
(Yildirim et al., 2008)), due to its clinical relevance.
Therefore, algorithm validation is a key aspect in
this area of research and has been insufficiently
addressed in the literature. Classifier performance
(Fawcett, 2004) is typically based on four well-
known parameters, namely the true positive (TP),
true negative (TN), false positive (FP) and false
negative (FN) counts (Table 1).
Table 1: Confusion matrix.
Gold Standard
Positive Negative
Test
Yes True Positive False Positive
No False Negative True Negative
This matrix is the basis of many common
classification metrics, for example sensitivity, also
known as true positive rate (TPR) and precision, also
known as positive predictive value (PPV), both
usually expressed as percentages. These metrics (and
the parameters in which they are based) imply a
comparison between the automatic detection results
and a reference, or gold standard, necessarily based
on the subjective judgment of human annotators.
The reference should be obtained through statistical
agreement among a number, as high as possible, of
annotations performed by qualified professionals. It
is therefore essential to have a complete and reliable
computational tool for respiratory sound annotation.
The work presented in this paper is part of a
broader effort aiming at establishing appropriate,
clearly-defined and as widely accepted as possible
validation tools and procedures.
2 STATE OF THE ART
The literature was carefully reviewed for software
tools that might be useful for respiratory sound
annotation. The most relevant are briefly discussed
in the following paragraph.
Praat (Boersma and Weenink, 2011) is used for
sound analysis, synthesis and manipulation. It was
deemed insufficiently user-friendly for the intended
purpose; it requires a level of programming skills
which health professionals may not be assumed to
possess. Windows Tool for Speech Analysis (WASP)
(Huckvale, 2010) is used to record, analyse and
display speech. Its main features are the ability to
play and annotate the recorded sound and compute
its spectrogram. However, it lacks user-friendliness
and presents some drawbacks, mainly on the sound
playback functions (e.g. during playback, there is no
information about the current sample of the sound
being played). PhiSAS (Brown et al., 2002), was
developed to study the respiratory function. It allows
sound recording and is equipped with a wide range
of processing and analysis tools but has no
annotation functions. Finally, the R.A.L.E.
Repository (PixSoft), one of the most cited, is mainly
a didactic application. It includes a respiratory sound
database with examples of several lung sounds.
However, these are not annotated by health
professionals. Also, unlike all previous ones, it is not
open-source software.
This led to the conclusion that while there are
valuable tools for audio annotation and/or analysis,
none of them are appropriate for respiratory sound
annotation by health professionals. The Respiratory
Sound Annotation Software (RSAS) presented in this
paper fulfils this need.
3 USER INTERFACE
The annotation process is time-consuming and
demands concentration and rigor, as there can be
hundreds of ALSs in a file of few seconds long. It
should also be noted that this tool is intended to be
used mainly by health professionals, who tend to
have overloaded agendas and no programming
skills. For these reasons, the main requirement of the
software is user-friendliness: the annotation must be
simple, quick and intuitive.
The application was developed in Matlab®
(Mathworks, 1994-2011) because of its rapid
prototyping characteristics and because it should
simplify the integration of automatic detection
algorithms in the future. The software comprises two
main sections:
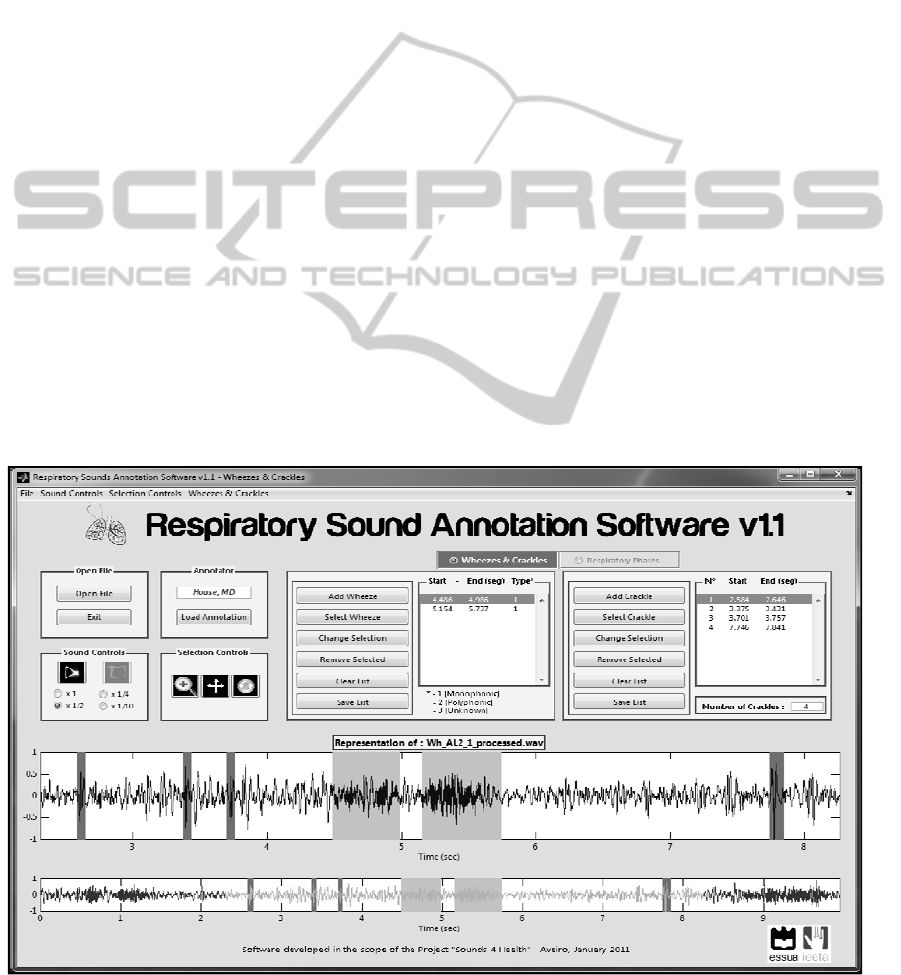
Wheeze and crackle annotation (Figure 1);
Respiratory phase annotation.
HEALTHINF 2012 - International Conference on Health Informatics
184
It is also possible to annotate a respiratory sound
simultaneously for wheezes, crackles and respiratory
phases. Different formats of information storage are
applied in each case. The user can check if there was
a previous annotation of the respiratory sound under
analysis, and if so, it can be loaded and edited. To
avoid bias, users can only access their own data.
Regarding sound selection, the zoom and pan
functions stand out. The zoom function allows time
expanded wave analysis (TEWA) even larger than
800 mm/sec, as suggested by Murphy et al. (1977).
This is particularly beneficial for crackle annotation.
The pan tool makes it possible to go forward or
backward on the sound graph by simply dragging
the mouse, making the selection of new portions
quick and intuitive. The playback tools include two
buttons whose function is self-explanatory:
Play/Pause;
Stop.
One of the most important features of this
application is the possibility of modifying the
respiratory sound playback speed. There are four
speeds available: normal
(1)
, half
(1 2
⁄
)
, one
fourth
(1 4
⁄
)
and one tenth of normal speed
(1 10
⁄
).
By using a phase vocoder (Ellis, 2002), the
audio file is temporally extended with no significant
change in pitch. This is especially relevant for the
wheeze annotation.
The annotation tools are designed for quick and
simple operation. For example, it is possible to
remove annotated ALSs from the list (individually
or collectively) and to modify them by changing
their starting or ending times. It is also possible to
change wheeze type and select signal portions
previously annotated as ALS (useful for playback).
When adding a new ALS, the starting and ending
time can be specified in any order.
In respiratory cycle annotation, the user only
needs to mark the phase transition instants and
identify the first phase. The remaining phases are
automatically labelled according to the respiratory
phase sequence: inspiration, expiration and pause. If
the user selects a point between two previously
selected, the list is rearranged to maintain the correct
respiratory phase sequence. All samples must belong
to a respiratory phase; therefore, the start of a given
phase necessarily coincides with the end of the
previous one. In both sections – adventitious lung
sounds (Figure 1) and respiratory phases – two plots
are always present:
Main Plot;
Guide Plot.
On the Main Plot, it is possible to select signal
portions using the selection tools (zoom and pan).
The playback tools take effect on the selected signal
portion. For example, if the sound is selected from
4s to 6s, this is the time interval that will be played
Figure 1: Screenshot of the wheeze and crackle annotation section.
RESPIRATORY SOUND ANNOTATION SOFTWARE
185

when the Play button is pressed. Every time a sound
is being played, a red vertical line slides along the
Main Plot to indicate that the current sample is being
played.
The Guide Plot keeps the user informed about
the location of the annotations previously made, and
about the signal portion currently selected. Both
plots take advantage of colour-coding ALS and
respiratory phase types: crackles are marked in red
while wheezes are marked in gold; inspirations,
expirations and respiratory pauses are marked in
yellow, green and brown, respectively.
4 DATA STORAGE
Annotation data are stored in folders identified by
the name of the corresponding annotator. Two file
formats are used:
type_sound_file_name.mat,
type_sound_file_name.csv.
The field type assumes the value wh, cr or rp,
depending on whether the file is a wheeze, a crackle
or a respiratory phase annotation, respectively.
The way the data are stored depends on the type
of annotation. Wheeze annotation data are stored as
an nx3 matrix, where n is the number of annotated
wheezes. The first and second columns are,
respectively, the starting and ending times of the
wheeze. The third column stores the type of wheeze
by means of a numeric code – 1 (monophonic), 2
(polyphonic) or 3 (unknown). Crackle annotation
data are stored in an analogous way. Since this
version of the software does not consider crackle
classification, an nx2 matrix is enough, n being the
number of crackles in the respiratory sound. The
annotation of respiratory phases is stored slightly
differently. Because the ending time of a respiratory
phase coincides with the starting time of the
following respiratory phase and the phases follow a
repetitive sequence, only one of them needs to be
stored; starting time was the chosen one. Data are
stored in an nx3 matrix, where n is the number of
respiratory cycles. The first, second and third
columns are the starting times of inspiratory phase,
expiratory phase and respiratory pause, respectively.
The software automatically assumes that the
phase with the latest starting time ends on the final
sound sample. If a respiratory cycle is incomplete
the value NaN is assigned to the column cells
corresponding to non-existing phases.
5 SOFTWARE TESTING
It is important to test the usability of the system, i.e.,
its acceptability for a particular class of users
carrying out specific tasks in a specific environment
(Holzinger, 2005).
Throughout the development, the software was
continuously tested by a multidisciplinary team of
technicians and researchers of the project. The
feedback given contributed decisively to the
development of user-friendly tools.
Once the development of the package reached its
current version (1.1), a more formal assessment of
performance was carried out, through a pilot test
involving twenty 10-second respiratory sound files
recorded from six patients. These files were
annotated by three health professionals with
experience in cardio-respiratory diseases. The file
selection criteria was to have half of the files
predominantly occupied by crackles and the other
half predominantly occupied by wheezes (Table 2).
Table 2: Characteristics of the twenty files selected for
software usability tests.
Wheeze Files
Crackle
Files
Total
Cystic Fibrosis 9 5 14
Pneumonia 1 5 6
The respiratory sounds from the patients
diagnosed with pneumonia belong to a repository
being built in a University of Aveiro research project
(PTDC/SAU–BEB/101943/ 2008) and the remaining
were collected during a PhD at University of
Southampton (Marques, 2008).
5.1 Results
The tests allowed the estimation of annotation time
per ALS (T
ALS
), a parameter useful to evaluate the
ease with which the user adapts to the software. The
data shown in Figure 2 was taken from a log report
generated for one of the annotators. The file
sequence on the horizontal axes corresponds to the
chronological order of annotation.
On average, the annotation time was 10.7±2.1
seconds per crackle and 67±15 seconds per wheeze.
The use of sound playback tools during crackle
annotation was 0.18±0.13 times per added crackle.
On wheeze annotation, sound playback was used
7.73±3.65 per added wheeze. Only in the annotation
of this type of ALS, the playback speed was changed
by the user (twice).
HEALTHINF 2012 - International Conference on Health Informatics
186
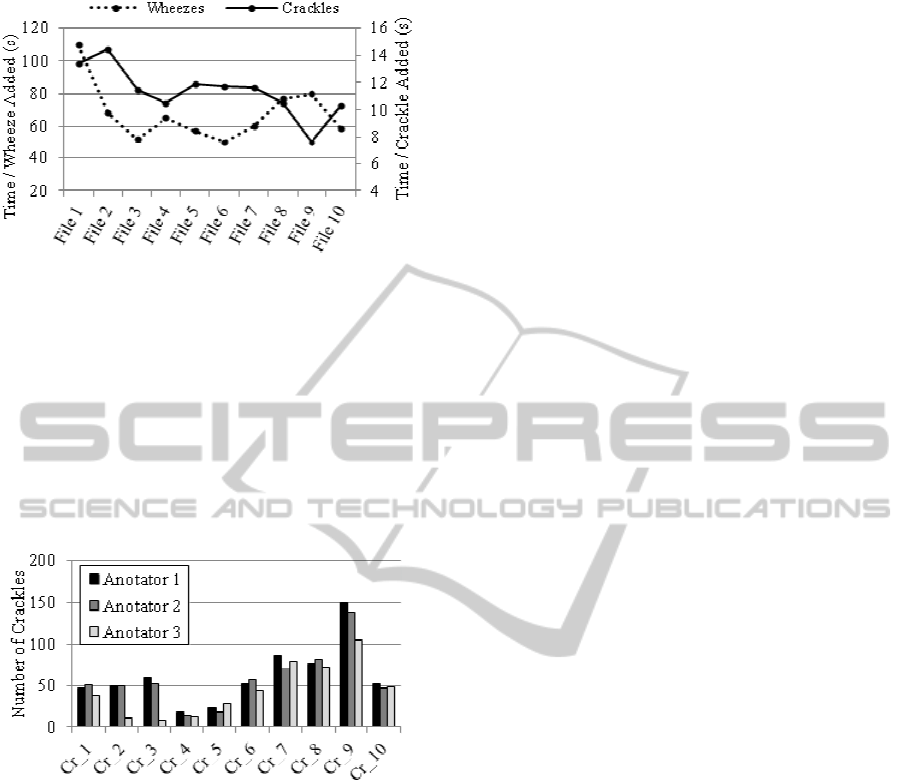
Figure 2: Annotation time per added crackle (T
CR
) and per
added wheeze (T
WZ
). File n stands for Cr_n on crackle
annotation and Wh_n on wheeze annotation.
An aspect that deserves to be emphasised is the
divergence between the number of crackles
identified by different annotators in every crackle
file of the pilot study (Figure 3). The same is
observed in wheeze files, where, although the
agreement was very good (Altman, 1991), Cohen’s
Kappa coefficient (Cohen, 1960) was never greater
than k=0.93.
Figure 3: Number of crackles annotated by each annotator
in the files predominantly occupied by crackles.
These results reinforce the importance of
creating agreement metrics robust enough to extract
reference annotations (Gold Standards).
5.2 Discussion
The first discussion topic, and perhaps the most
important, is the rapid user adaptation to the
software tools provided. As shown in Figure 3, T
CR
is significantly reduced especially from Cr_2 to
Cr_3, remaining almost constant afterwards. The
adaptation time can be estimated through the total
annotation time of these two respiratory sounds:
approximately 20 minutes. The annotation of the
wheeze files was performed two weeks after the
annotation of the crackle files. The T
WZ
decreased
after the annotation of Wz_1, remaining almost
constant until the end, suggesting that the adaptation
was very quick and easy, approximately 3 minutes.
On the use of playback tools, it was observed
that the number of playbacks per ALS in wheeze
annotation was considerably higher than in crackle
annotation. A complementary statistical analysis was
conducted using SPSS® 17.0, to study the
correlation between variables (Pearson’s
correlation). As mentioned earlier, there was a
statistically significant correlation (p<0.05) between
the number of file playbacks and the number of
wheezes added during the annotation. On the crackle
annotation this correlation was not observed. These
results strongly suggest that crackle annotation is
mainly based on graphical analysis of the signal,
while wheeze annotation is much more auditory,
possibly due to the tonal character of wheezes.
Analysing the log report, it was possible to
notice that the Selection Change Button was never
used. This feature must be rethought or even
removed in future versions of the software.
In spite of using Matlab®, the application was
very responsive and no significant delays were
noticeable.
Despite the differences between crackles and
wheezes, the typical annotation procedure adopted
by the user was similar in both cases. After selecting
the respiratory sound to be annotated, the user listens
to the whole sound at normal speed at least once,
then selects an initial portion using the zoom tool
and gradually advances on the sound using the pan
tool. The annotators always proceeded from the
beginning to the end of the file.
6 CONCLUSIONS AND FUTURE
WORK
A tool for annotating crackles, wheezes and phases
on respiratory sounds was developed. Usability tests
suggest that the software is user-friendly and reliable
on crackle and wheeze annotation. Selection and
playback tools contribute decisively to accurate
annotations. More usability tests will be conducted
to evaluate respiratory phase annotation
performance.
A major objective of this research project is to
integrate this application on a web-based platform
open to the scientific community. This is intended to
feature:
A dynamic repository of respiratory sounds
carefully recorded and documented for selection
(e.g. by disease, age, gender);
RESPIRATORY SOUND ANNOTATION SOFTWARE
187

Gold standard annotations for each of the
repository files, obtained through statistical
agreement criteria in selected annotator panels;
Performance evaluation of automatic ALS
detection algorithms (or training of health
professionals) comparing with gold-standards.
ACKNOWLEDGEMENTS
The authors gratefully acknowledge the funding
provided to this project, “Sounds4Health”, by
Quadro de Referência Estratégico Nacional
(QREN), on a partnership between University of
Aveiro and ISA (Intelligence Sensing Anywhere).
The authors would also like to thank to Doctors
Ilka Rosa and Daniela Oliveira for their kind
contribution during the software usability tests.
REFERENCES
Altman, D. G., 1991. Practical statistics for medical
research, London: Chapman and Hall.
Bloom, B., Cohen, R. and Freeman, G., 2009. Summary
health statistics for US children: National Health
Interview Survey, 2008. Vital Health Statistics, 10, pp
1-81.
Boersma, P. and Weenink, D., 2011. Praat - Doing
phonetics by computer. 5.2.23 ed. Amsterdam:
Phonetic Sciences, University of Amsterdam.
Brown, A. S., Harvey, D., Jamieson, G. and Graham, D.
PhiSAS: a low-cost medical system for the observation
of respiratory dysfunction. [leaflet] 6 Feb. 2002 ed.
IEEE.
Cohen, J., 1960. A Coefficient of Agreement for Nominal
Scales. Educational and Psychological Measurement,
20, pp 37-46.
Ellis, D., 2002. A Phase Vocoder in Matlab [online]
Available at: <http://bit.ly/8Pf5f> [Accessed 21st
January 2011].
Fawcett, T., 2004. ROC Graphs: Notes and Practical
Considerations for Researchers. 12.
Holzinger, A., 2005. Usability engineering methods for
software developer. Communications of the ACM, 48,
pp 71-74.
Huckvale, M., 2010. Windows Tool for Speech Analysis
(WASP). Version 1.45 ed. London: University College
London.
Lu, X. and Bahoura, M., 2008. An integrated automated
system for crackles extraction and classification.
Biomedical Signal Processing and Control, 3, pp 244-
254.
Marques, A., 2008. The use of computer aided lung sound
analysis to characterise adventitious lung sounds: A
potential outcome measure for respirathory therapy.
PhD, Southampton University.
Marques, A., Bruton, A. and Barney, A., 2006. Clinically
useful outcome measures for physiotherapy airway
clearance techniques: a review. Physical Therapy
Reviews, 11, pp 299-307.
The Mathworks, 1994-2011. Matlab. 7.4 ed, Natick,
Massachusetts, U.S.A.
Murphy, R. L. H., Holford, S. K. and Knowler, W. C.,
1977. Visual Lung-Sound Characterization by Time-
Expanded Wave-Form Analysis. New England
Journal of Medicine, 296, pp 968-971.
Piirila, P. and Sovijärvi, A., 1995. Crackles: recording,
analysis and clinical significance. Eur Respir J, 8, pp
2139-48.
Pixsoft. The R.A.L.E. Repository [online] Available at:
<http://www.rale.ca> [Accessed 1st July 2011].
Pleis, J., Lucas, J. and Ward, B., 2009. Summary health
statistics for US adults: National Health Interview
Survey, 2008. Vital Health Statistics, 10, pp 1-157.
Qiu, Y., Whittaker, A., Lucas, M. and Anderson, K., 2005.
Automatic wheeze detection based on auditory
modelling. Proc Inst Mech Eng H, 219, pp 219-27.
Shim, C. S. and Williams, M. H., Jr., 1983. Relationship
of wheezing to the severity of obstruction in asthma.
Archives of internal medicine, 143, pp 890-2.
Sovijärvi, A., Malmberg, L., Charbonneau, G. and
Vanderschoot, J., 2000a. Characteristics of breath
sounds and adventitious respiratory sounds. Eur.
Respir. Rev., 10, pp 591-596.
Sovijärvi, A., Vanderschoot, J. and Eavis, J., 2000b.
Standardization of computerized respiratory sound
analysis. Eur. Respir. Rev., 10, pp 585-590.
Taplidou, S. and Hadjileontiadis, L., 2007. Wheeze
detection based on time-frequency analysis of breath
sounds. Comput Biol Med, 37, pp 1073-83.
Vannuccini, L., Rossi, M. and Pasquali, G., 1998. A new
method to detect crackles in respiratory sounds.
Technol Health Care, 6, pp 75-9.
Waris, M., Helistö, P., Haltsonen, S., Saarinen, A. and
Sovijärvi, A., 1998. A new method for automatic
wheeze detection. Technol. Health Care, 6, pp 33-40.
Yildirim, I., Ansari, R. and Moussavi, Z., 2008.
Automated respiratory phase and onset detection using
only chest sound signal. 30
th
Annual International
Conference of the IEEE EMBS., August 2008,
Vancouver, Canada.
HEALTHINF 2012 - International Conference on Health Informatics
188
