
WHAT MAKES US CLICK?
Modelling and Predicting the Appeal of News Articles
Elena Hensinger, Ilias Flaounas and Nello Cristianini
Intelligent Systems Laboratory, University of Bristol, Merchant Venturers Building, Bristol, U.K.
Keywords:
Pattern analysis, Ranking SVM, News appeal, Text analysis, User preference modelling.
Abstract:
We model readers’ preferences for online news, and use these models to compare different news outlets with
each other. The models are based on linear scoring functions, and are inferred by exploiting aggregate be-
havioural information about readers’ click choices for textual content of six given news outlets over one year
of time. We generate one model per outlet, and while not extremely accurate – due to limited information –
these models are shown to predict the click choices of readers, as well as to being stable over time. We use
those six audience preference models in several ways: to compare how the audiences’ preferences of different
outlets relate to each other; to score different news topics with respect to user appeal; to rank a large number of
other news outlets with respect to their content appeal to all audiences; and to explain this measure by relating
it to other metrics. We discover that UK tabloids and the website of the “People” magazine contain more
appealing content for all audiences than broadsheet newspapers, news aggregators and newswires, and that
this measure of readers’ preferences correlates with a measure of linguistic subjectivity at the level of outlets.
1 INTRODUCTION
News stories and their potential appeal to readers is a
vital question for journalists and editors, who have to
select which news to cover. There is high competition
between news media to try to get readers’ attention
and to provide the best service for their audiences.
Furthermore, selecting interesting news to read from
a huge pool of possible stories becomes a demanding
task for the audiences. In this competitive environ-
ment, knowing and understanding readers’ interests
is valuable for news outlets.
This paper presents an approach to build models
of readers’ preferences based on the set of “Top Sto-
ries” and “Most Popular” stories. The first set con-
tains articles selected by editors to feature on the main
page of the outlet website; the second contains the
most clicked articles of an outlet. We present several
ways of using those models to understand the rela-
tions between various outlets, topics, and audiences.
Our main findings are that it is possible to quantify the
appeal of different articles and topics of news for dif-
ferent audiences, and that articles from “Health” and
“Entertainment” sections are typically more appeal-
ing to a general audience than articles about “Busi-
ness”, “Politics” and “Environment”.
We built one model for each of the audiences of
“The New York Times”, “Los Angeles Times”, “The
Seattle Times”, “CBS”, “BBC” and “Yahoo! News”.
We use these models to score a large number of news
outlets with respect to their appeal. Over all mod-
els, “Top Stories” from UK tabloids and the “People”
magazine score highest in being preferred by a gen-
eral reader when given a choice between two articles.
Furthermore, we found a strong and significant corre-
lation between the linguistic subjectivity and the ap-
peal of articles.
Previous work in news analysis and readers’ news
preferences was mainly carried out by scholars of me-
dia studies or political sciences. One recent example
of such studies includes (Boczkowski and Mitchel-
stein, 2010), which use RSS feeds as data sources and
focus on studying public and non-public affairs in Ar-
gentina. Identifying influential factors connected to
news choices of newspapers has been one focus of
journalism studies since the 1970s (T. Harcup and D.
O’Neill, 2001). One main challenge in social sciences
is the fact that data is collected, processed and anal-
ysed by hand by individual researchers, which lim-
its the amount of data that can be processed. Auto-
matic processing of news and readers’ clicks has been
realised in recent years but usually with a different
goal than understanding the inter-relationships of in-
volved parties: it was rather aimed at news recom-
mendations, as in (Das et al., 2007) or advertisement
selection and positioning.
41
Hensinger E., Flaounas I. and Cristianini N. (2012).
WHAT MAKES US CLICK? - Modelling and Predicting the Appeal of News Articles.
In Proceedings of the 1st International Conference on Pattern Recognition Applications and Methods, pages 41-50
DOI: 10.5220/0003728000410050
Copyright
c
SciTePress

In order to build user profiles, one has to acquire
data about user preferences. Common approaches in-
clude to ask users about their preferences, or to collect
click data. The first approach is more direct, but also
more tedious and obtrusive for users. The second ap-
proach usually requires a log-in system to link user
profiles and demographic information to user click
choices, as in (Liu et al., 2010). We explore a third
approach which does not directly interfere with the
users, and it is based on simply monitoring what they
click. We had indirect access to this information for
some outlets which advertise in their websites their
most popular stories, i.e. the most clicked stories.
The drawback is that this information is not available
for all outlets and there is not a fine-grained user seg-
mentation. In our previous work we explored such
datasets with different techniques to model user pref-
erences in terms of prediction performance and ap-
plications (Hensinger et al., 2011), (Hensinger et al.,
2010).
Our models are built based on pairwise data from
user clicks: one more appealing news article versus
a less appealing one, both collected on same day and
from same outlet. This approach uses a linear util-
ity function to connect pairwise preferences to utility
values of items, in our case to article scores, with the
more appealing item having a higher score than its
counterpart. A preference model w contains weights
for individual article features and the “appeal” score
s(x) of an article x is computed by the linear func-
tion s(x) = hw, xi. We represent articles as bags of
words with TF-IDF weights as features – a standard
representation in information retrieval and text cate-
gorisation (Salton et al., 1975) – which is found be-
hind search engines, topic classifiers and spam filters
(Sculley and Wachman, 2007). Models are computed
via the Ranking Support Vector Machines (SVM)
method, introduced by (Joachims, 2002).
In Section 2, we focus on all tasks involved in
building models: We describe the theoretical frame-
work to learn pairwise preference relations, and the
selection and preparation of the data. We report on
the performance of the resulting models and also ex-
plore their similarities to each other. The models are
stable over time: we tested on weekly datasets up to
six months older than the data used to build the mod-
els. They can also make better than random predic-
tions of the choice of a typical reader, if he or she has
to choose between two articles.
Two factors which restrict the efficiency of our
models lie in the nature of the data we use. First,
we apply a very coarse-grained user segmentation:
all users of one outlet are seen as one homogeneous
group, since more detailed information is not avail-
able to us. Second, we use textual content only, while
online articles are often presented with supplementary
material, for instance images or videos. Such addi-
tional data can influence users’ choices, but it is not
provided by our data gathering system. Additionally,
we use only a subset of the full article text, mimicking
the real-life situation of news web pages, where the
user typically sees only the titles and short descrip-
tions of a collection of articles and has to make the
choice of what story she or he wants to read. Regard-
ing these restrictions and characteristics of our data,
it is remarkable that it is still possible to produce user
interest models that are reliable in their performance.
Having created the models, the key question be-
comes how to exploit them. Our goal is to gain an
understanding about the landscape of outlets, their
editors’ choices, and how those relate to their read-
ers’ interests. In this direction we performed a se-
ries of experiments. In Section 3 we compare the ap-
peal of different news topics. We found that topics
such as “Entertainment” and “Health” are perceived
as more appealing compared to topics such as “Busi-
ness”, “Environment” and “Politics”.
In Section 4 we compare outlets based on the ap-
peal of articles that appear in their main web pages.
For each article, we compute an appeal score with
each of the built models. We average the appeal
scores over all articles and models — for data from 33
different outlets. This allows us to rank those outlets
by their overall appeal score. It turns out - perhaps
not surprisingly - that articles from the online pres-
ence of the “People” magazine and from UK tabloids
are more appealing than from broadsheet papers and
newswires.
Finally, in Section 5, we attempt to explain the
behaviour of audiences and their click choices. We
measured readability and linguistic subjectivity of ar-
ticles and compared those quantities with the articles’
average appeal. Our finding is that outlets with simi-
lar appeal of their articles have also similar linguistic
subjectivity.
2 MODELLING NEWS APPEAL
This section describes the theoretical framework of
learning pairwise preference relations; the selection
and preparation of the data we used in our experi-
ments; and the resulting models, their prediction per-
formance, and their distances to each other.
The key task is to score news articles by means of
a linear function s(x) = hw,xi where x is the vector
space representation of the article and w is a parame-
ters vector.
ICPRAM 2012 - International Conference on Pattern Recognition Applications and Methods
42

2.1 Ranking Pairs with Ranking SVM
The Ranking SVM was introduced by (Joachims,
2002) and it was applied in the context of search en-
gine queries. It builds upon the method for binary
classification of SVM (Boser et al., 1992), (Cristian-
ini and Shawe-Taylor, 2000). The goal of SVMs
is to construct a separating hyperplane between two
classes of items, which is described by a linear func-
tion f(x) = hw,xi + b. The class of an item x
i
∈ R
n
is decided via f(x): if this value is larger or equal
to 0, then the data item is assigned to class y = +1,
otherwise to class y = −1. Training data is not al-
ways linearly separable, thus slack variables ξ are in-
troduced, which allow handling of the misclassified
items. Finding the best separating hyperplane for ℓ
training examples is achieved by realising a maxi-
mal margin classifier, found as the solution to the
quadratic optimisation problem of the form:
minimise
ξ,w,b
hw, wi +C
ℓ
∑
i=1
ξ
2
i
(1)
subject to y
i
(hw, x
i
i + b) ≥ 1− ξ
i
, i = 1, . .. ℓ, (2)
ξ
i
≥ 0 ,i = 1, .. .ℓ (3)
The approach can be adapted to our task: instead
of classes for individual items x
i
, we learn the prefer-
ence relationship between pairs of items (x
i
,x
j
). An
item x
i
is said to be preferred to x
j
by notion x
i
≻ x
j
,
and, assuming a linear utility function f : R
n
→ R of
the form f(x) = hw, xi + b, this “better than” relation-
ship can be captured via
x
i
≻ x
j
⇐⇒ f(x
i
) > f(x
j
) (4)
leading to:
hw, x
i
i + b >
w, x
j
+ b (5)
⇐⇒ hw, x
i
i + b− (
w, x
j
+ b) > 0 (6)
⇐⇒
w, (x
i
− x
j
)
> 0 (7)
Learning the relationship between two items x
i
and x
j
is thus expressed as a binary classification
problem on the data item of their difference x
(i, j)
=
x
i
− x
j
. The class label y is determined via u(x
(i, j)
) =
w, x
(i, j)
: if it is greater or equal to 0, then y
(i, j)
= +1,
otherwise y
(i, j)
= −1.
The optimisation problem for Ranking SVM for ℓ
training data pairs of form x
(i, j)
, with slack variables
ξ
(i, j)
for non-linearly separable data, is expressed,
over all pairs x
(i, j)
, as:
minimise
ξ,w
hw, wi +C
∑
x
(i, j)
ξ
(i, j)
(8)
subject to y
(i, j)
(hw, x
(i, j)
i) ≥ 1− ξ
(i, j)
, (9)
ξ
(i, j)
≥ 0 ∀ x
(i, j)
(10)
The solution weight vector w can not only be used
to predict the preference relationship between two
items x
i
and x
j
, but also to compute the utility score
for an individual item x
i
via s(x
i
) = hw, x
i
i.
We exploit both these properties: we learn models
on pairwise data, and we quantify the appeal of indi-
vidual items via their utility scores s(x
i
). For all our
experiments, we used the freely available implemen-
tation SVM
rank
(Joachims, 2006).
2.2 News Articles Dataset
For this study, we used two different datasets with
two different goals: one to model audience prefer-
ences, and one to apply those models to. For the first
dataset, we utilised news articles from six English-
speaking news outlets from UK and US, namely “The
News York Times”, “Los Angeles Times”, “The Seat-
tle Times”, “CBS”, “BBC”, and the news aggregator
“Yahoo! News”. We collected articles for the time in-
terval between 1st January 2010 and 31st December
2010. For the second dataset of application examples,
we used articles from 1st June 2010 until 31st May
2011, from 33 different English-speaking outlets from
US and UK, including the ones stated above.
News data was collected, pre-processed and man-
aged via the News Outlets Analysis & Monitoring
(NOAM) system (Flaounas et al., 2011). More specif-
ically, we analysed news items advertised by the var-
ious outlets through Real Simple Syndication (RSS)
and Atom news feeds. A feed contains news articles
in a structured format including a title, a short descrip-
tion and the publication date. Typically, outlets offer
their content organised in many different feeds, such
as “Top Stories” and “Most Popular” which we used
to train our models; and topics such as “Business” or
“Entertainment” which we exploit in our work for as-
signing articles to topic categories.
As for the data, we used the well-defined set of
“Top Stories” articles, i.e. items published in the
“Main Page” of the outlets. We furthermore used arti-
cles from the “Most Popular”feed to incorporatepref-
erence information, since this feed presents articles
the readers found most interesting – by clicking on
them in order to read them. With this feed, we could
separate the “Top Stories” articles into two groups:
those which became popular, and those which didn’t.
Finally, we paired up articles to use for the Rank-
ing SVM approach by combining an article present
in “Top Stories” and “Most Popular” feeds, with one
article that appeared in “Top Stories” but not in “Most
Popular” feed, both from same day and same outlet.
WHAT MAKES US CLICK? - Modelling and Predicting the Appeal of News Articles
43

Table 1: Average sizes of preference data pairs in training
and testing data.
Outlet Training data Testing data
BBC 85,111 15,818
CBS 7,095 1,188
Los Angeles Times 2,621 476
The New York Times 7,736 1,452
The Seattle Times 29,458 5,502
Yahoo! News 40,215 6,712
By comparing the potential amount of articles in
the positiveset for different training time intervals, we
decided to use six weeks for training, keeping in mind
that user interests can drift over time, and longer time
intervals might not be able to capture such variations
in interests. We had access to one year of data, and
we created 47 datasets using a sliding window of six
weeks for training and one consecutive week for test-
ing. The sizes of training and test datasets are reported
in Table 1. We omitted some datasets for which data
was inadequate in either train or test set. There were
18 such datasets for “BBC”, five for “The New York
Times” and less than three for the remaining outlets.
For each article, we extracted its title and de-
scription, to imitate the snippet of text a user would
see on the news outlet webpage. To represent this
data, we applied standard text mining pre-processing
techniques of stop word removal, stemming (Porter,
1980), and transfer into the bag-of-words (TF-IDF)
space (Liu, 2007). The overall vocabulary we used
was comprised from 179,238 words.
Our data have no demographic information about
the readers, thus we cannot perform such segmenta-
tion of the readers’ population. Instead, we perform
“behavioural segmentation” – a concept in market-
ing (Assael and A. Marvin Roscoe, 1976) – and di-
vide audiences by their choice of news outlet. Con-
sequently, our segmentation is rather coarse-grained,
treating all outlet users as one group with homoge-
neous article preferences. Furthermore, we use tex-
tual content only, not being able to take into account
that user attention could have been affected by addi-
tional visual information, such as images or videos,
next to a news article. These facts have certainly an
effect on model performance for predicting user pref-
erences.
2.3 User Preference Models
Each of the 47 training sets per outlet led to one
model. We evaluated each model on its perfor-
mance for pairwise preference prediction on the rel-
ative dataset of the following week. As an explo-
ration, we also created and tested 47 “universal” mod-
els by concatenating the training and testing datasets
0
10
20
30
40
50
60
70
80
90
100
Performance %
BBC
CBS
Los Angeles
Times
New York
Times
Seattle
Times
Yahoo!
News
Universal
Model
Figure 1: Pairwise preference performance for six audience
models (dark grey) and universal model across all audiences
trained on the concatenation of all training data (light grey).
The universal model performs as well as the least strong
model. We cannot refine the segmentation of the audience
any further than per outlet, as we do not have access to ad-
ditional user data. Error bars represent the standard error of
the mean.
across all outlet audiences. The results, averaged over
datasets, for the individual audience models, as well
as for the universal model are shown in Figure 1.
The universal model does not perform better than the
weakest individual model, thus we use only the indi-
vidual audience models in this study.
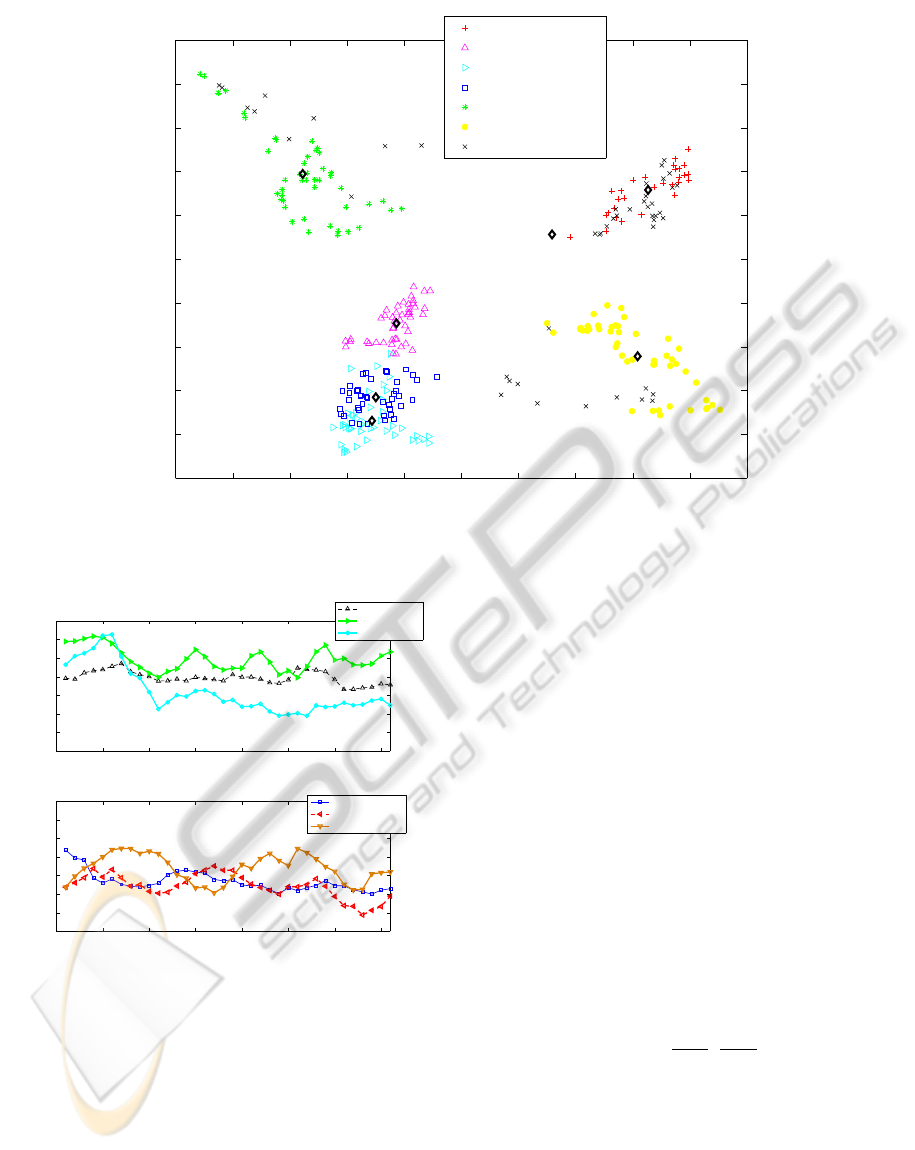
Each of the models is a vector in the high-
dimensional space of word features, and thus we can
measure the distance of each one to the others. In
the following, we adopted the Euclidean distance as
measure of proximity between models, and we used
multidimensional scaling to visualise the models’ po-
sitions in a 2D plane, as illustrated in Figure 2. Same-
audience models create distinctive clusters in that
space. On the contrary, points that represent the uni-
versal model are spread over the entire space. We also
computed the centre of mass for each cluster, shown
as diamonds. This was used to identify one model
per outlet that best represents the overall cluster – the
closest one to the centre of mass. Additionally, we
can observe the audience’s similarities to each other.
For example, preferences of the readers of “The News
York Times” are very similar to the preferences of the
readers of “Los Angeles Times”; and readers of both
are close to the preferences of the audience of “CBS”.
Finally, we were interested in evaluating how the
models’ performance will vary over time, if applied to
predict pairwise preference relations on testing data in
distant future from the time of its creation. We created
weekly test sets for the time period between 1st Oc-
tober 2010 and 31st May 2011, which covers part of
the time the models have been trained on, and the full
future time in our application experiments.
ICPRAM 2012 - International Conference on Pattern Recognition Applications and Methods
44
−0.5 −0.4 −0.3 −0.2 −0.1 0 0.1 0.2 0.3 0.4 0.5
−0.4
−0.3
−0.2
−0.1
0
0.1
0.2
0.3
0.4
0.5
0.6
BBC
CBS
Los Angeles Times
New York Times
Seattle Times
Yahoo! News
Universal model
Figure 2: Relative distances between outlets’ audience models, with centres of mass of each cluster as a diamond. Models
for different audiences cluster together, while the universal models are spread over the entire space of audiences. We can also
observe the distances and similarity of audience groups, for instance, preference models for “Los Angeles Times” and “The
New York Times” are very close to each other.
0 5 10 15 20 25 30 35
50
55
60
65
70
75
80
85
Weeks between 1st October 2010 and 31st May 2011
Performance %
0 5 10 15 20 25 30 35
50
55
60
65
70
75
80
85
Weeks between 1st October 2010 and 31st May 2011
Performance %
New York Times
Seattle Times
Yahoo! News
BBC
CBS
Los Angeles Times
Figure 3: Model performances over time, with models be-
ing assessed on weekly data in the future, and the curves
smoothed via a five-week sliding window. The models be-
have stable, and only two fall sporadically below 60% pair-
wise prediction performance, towards the distant future of
six months after their training time interval.
Figure 3 shows the performance curves, smoothed
via a five-week sliding window, i.e. averaged over the
testing week, plus two weeks before and after. For
most models, the performance decreases slightly over
this long period of time, but only for two models, the
pairwise preference prediction falls sporadically be-
low 60% in further progressing time (six months after
learning the model). Keeping that in mind, and the
distinct clusters of models in Figure 2, the inferred
models for each of the six outlets are very stable –
albeit not highly accurate – predictors of the prefer-
ences of readers.
3 TOPIC APPEAL
One interesting use of our models is that they can pro-
vide insights into how audiences would rate articles
from different outlets and topics. To assign one or
more topics to an article, we use the topic of the feeds
it was carried in.
Recall that the Ranking SVM technique produces
a model which is capable to compute the appeal score
for an individual article x
i
. Here, we use a version of
the scoring function, calculated by:
s(x
i
) = h
w
||w||
,
x
i
||x
i
||
i (11)
We normalise the models and articles such that the
number of words in each of them would not have an
effect on the score.
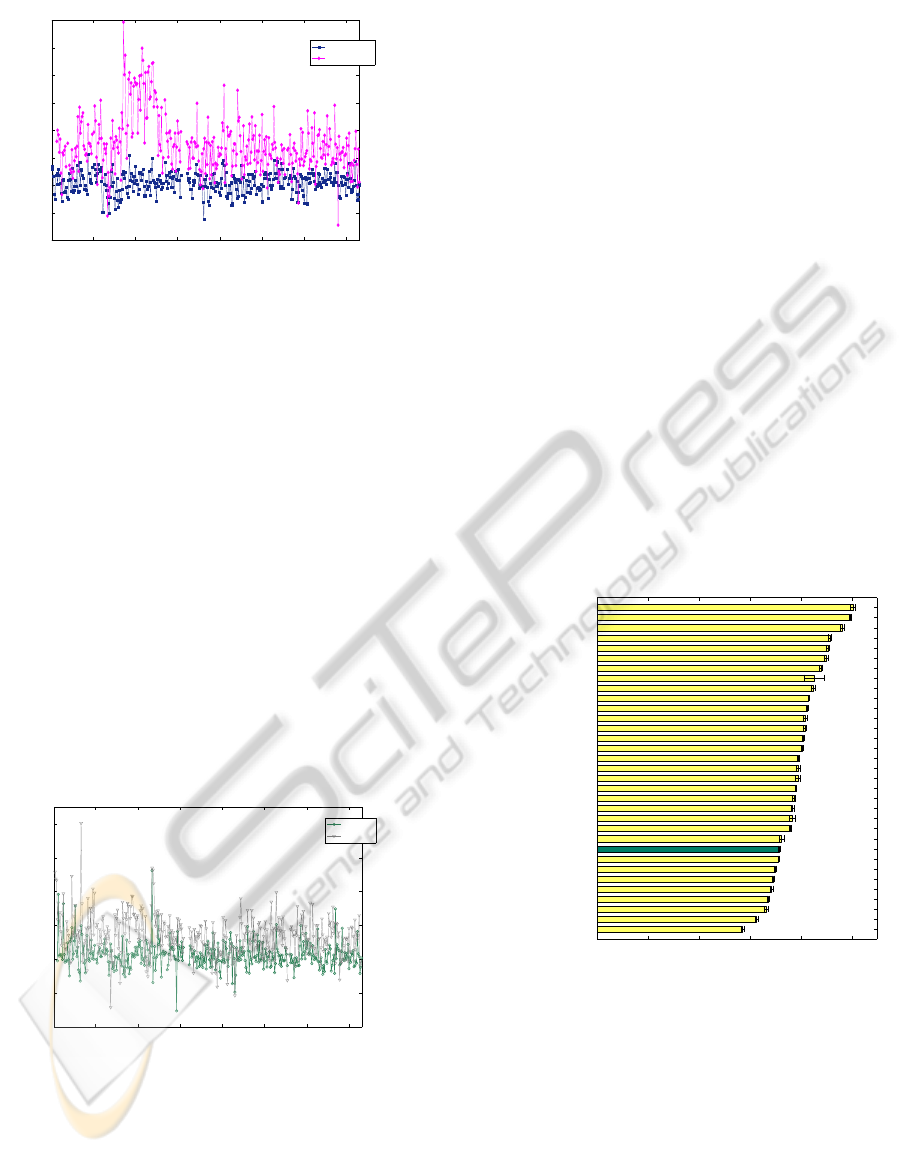
As a detailed example, we discuss article scores,
averaged for all daily articles from the outlet “BBC”
between 1st June 2010 and 31st May 2011, scored
by the audience model for “BBC”. In Figure 4, we
compare average daily appeal scores of articles from
WHAT MAKES US CLICK? - Modelling and Predicting the Appeal of News Articles
45
50 100 150 200 250 300 350
−0.02
−0.01
0
0.01
0.02
0.03
0.04
0.05
0.06
Days between 1st June 2010 and 31st May 2011
Top Stories
Most Popular
Figure 4: Daily average appeal scores assigned by the
“BBC” audience model to articles between 1st June 2010
and 31st May 2011 from “Top Stories” and “Most Popular”
feeds of outlet “BBC”. Even though the audience preference
model was trained on more restricted data for “Most Popu-
lar” articles, it captures the desired preference relationship.
the “Top Stories” feed with the ones from the feed
of “Most Popular” items, both from outlet “BBC”
(note that one and the same article can occur in both
feeds). The “Most Popular” feed is scored consis-
tently higher, i.e. more appealing to the audience,
which is the goal of our initial modelling. In this
application, the data is not restricted to the subset of
“Top Stories”, but it can originate from other feeds
as well, such as “Sports”, “Business” or “Entertain-
ment”.
The same exploration can be applied for other
topic feeds, such as “Business” and “Politics”, as il-
lustrated in Figure 5. We can observe a larger vari-
ety of scores, with “Politics” articles scoring by trend
higher than “Business” ones, and also having closer
scoring values to “Most Popular” articles of Figure 4.
50 100 150 200 250 300 350
−0.04
−0.02
0
0.02
0.04
0.06
0.08
Days between 1st June 2010 and 31st May 2011
Business
Politics
Figure 5: Daily average appeal scores assigned by the
“BBC” audience model to articles between 1st June 2010
and 31st May 2011 from “Business” and “Politics” feeds. In
trend, articles with political content score higher than busi-
ness ones.
We score the articles of those outlets for which we
created models using the corresponding model. For
example, we score “Yahoo! News” articles by the
model of “Yahoo! News” audience only. In Table
2, we additionally show the topics for each outlet and
their average amount of daily articles. Table 3 lists
the rankings of topics for different audience groups,
sorted from highest to lowest by their average appeal
scores for the entire period of time under study.
Overall, articles advertised in topic feeds of
“Health” and “Entertainment” score higher, while the
appeal of articles in topics “Business”, “Politics” and
“Environment” score lower.
4 OUTLET APPEAL
In previous sections, we have been comparing audi-
ence to “their” respective outlet only. In this section,
we will show results of application of one audience
model, but different news outlets. We used “Top Sto-
ries” articles for 33 different outlets from US and UK
to compute daily average article scores, and averaged
them over the 365 days of the covered time period.
These overall scores allow to compare different out-
lets in terms of their general appeal to a specific au-
dience, such as for “BBC” model in Figure 6. Error
bars represent standard error of the mean.
0 0.1 0.2 0.3 0.4 0.5
International Herald Tribune
Reuters
Time
The New York Times
Yahoo! News
The Independent
The Seattle Times
Huffington Post
BBC
The Arizona Republic
The Denver Post
Detroit Free Press
Los Angeles Times
New Scientist
The Boston Globe
Seattle Post
USA Today
CBS
San Francisco Chronicle
Star Tribune
Chicago Tribune
CNN
The Philadelphia Inquirer
New York Post
Daily News
Weekly World News
The Guardian
Daily Express
People.com
Daily Telegraph
The Sun
Daily Mail
The Daily Mirror
Figure 6: Comparison of 33 outlets, sorted by the daily
scores of the “BBC” audience model for their “Top Sto-
ries” articles, averaged over one year of time between 1st
June 2010 and 31st May 2011. The outlet “BBC” is marked
through dark colour. We followed up the question why these
“Top Stories” articles are not the most appealing for its au-
dience model. Error bars represent standard error of the
mean.
We can observe that articles from UK tabloids
score highest for this audience, followed by the ones
from the web presence of “People” magazine, “The
Guardian” and the satire “Weekly World News”.
The result of “Top Stories” articles of “BBC” be-
ICPRAM 2012 - International Conference on Pattern Recognition Applications and Methods
46
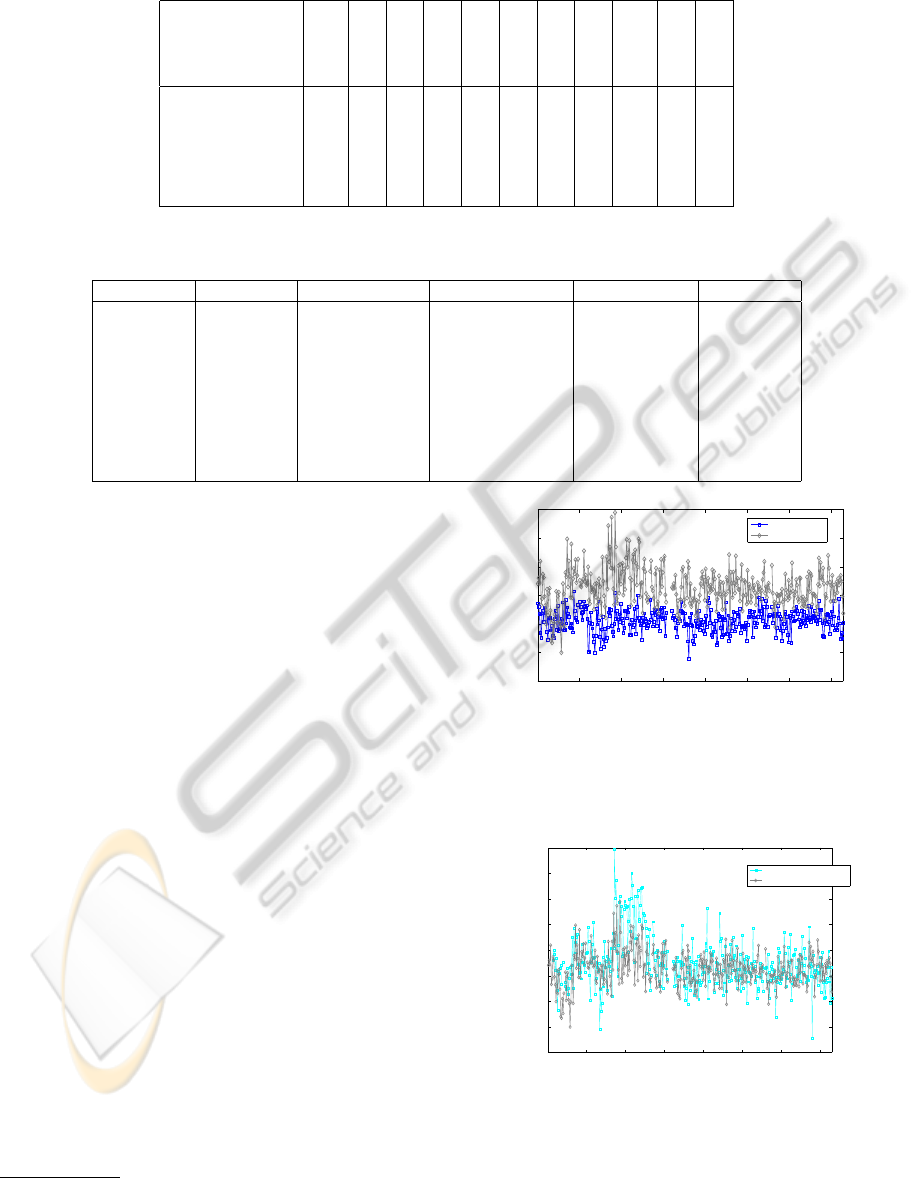
Table 2: Average daily article sizes for the topic feeds available in this study.
Outlet
Top Stories
Most Popular
Celebrity
Technology
Entertainment
Health
Science
Environment
Sports
Business
Politics
BBC 126 28 - 9 17 9 13 13 - 32 24
CBS 36 7 11 5 11 9 8 - - 9 16
Los Angeles Times 25 10 - 5 16 4 5 3 - - 6
The New York Times 44 17 - 14 - 12 14 12 48 39 -
The Seattle Times 92 8 - 89 38 9 - - 135 89 21
Yahoo! News 67 70 28 39 45 15 26 16 44 - -
Table 3: Topics, ranked from highest to lowest, by their carried articles’ average appeal scores to the same audience model,
averaged over one year of time.
BBC CBS Los Angeles Times The New York Times The Seattle Times Yahoo! News
Most Popular Health Health Technology Most Popular Health
Politics Entertainment Most Popular Health Entertainment Technology
Entertainment Celebrity Entertainment Most Popular Sports Celebrity
Technology Most Popular Technology Sports Health Entertainment
Health Technology Science Business Top Stories Most Popular
Science Science Top Stories Science Technology Science
Environment Business Politics Top Stories Business Environment
Business Top Stories Environment Environment Politics Sports
Top Stories Politics - - - Top Stories
ing not the most appealing, for a model which has
been created to reflect the “BBC” audience, led us to
further investigation of these results. We can visu-
alise and compare the averaged daily scores for the
data behind the results: “Top Stories” articles from
“BBC”, and the ones from the highest ranked outlet,
“The Daily Mirror”. In Figure 7 we compare the ap-
peal of “Top Stories” articles from these two outlets
on the same audience group.
In Figure 8 we compare “Most Popular” scores
from “BBC” articles against the scores of “Top Sto-
ries” articles from “The Daily Mirror”. The latter
scores’ similarities explain the result of the ranking
in Figure 6.
5 GLOBAL APPEAL SCORES
AND LINGUISTIC
SUBJECTIVITY OF OUTLETS
Our final exploration focuses on the global appeal, i.e.
averaged over all audience models and days, for the
33 outlets. The resulting global ranking of outlets is
shown in Figure 9.
The online presence of the “People” magazine,
which carries mainly celebrity news
1
, leads the global
scoring, followed by UK tabloids. Also, as in the
“BBC” example in Sect. 4, the satire magazine
1
Source (Aug. 2011): http://en.wikipedia.org/wiki/
People.com
50 100 150 200 250 300 350
−0.02
−0.01
0
0.01
0.02
0.03
0.04
Days between 1st June 2010 and 31st May 2011
BBC
The Daily Mirror
Figure 7: Comparison of average daily appeal scores for
“Top Stories” articles of outlets “BBC” and “The Daily Mir-
ror”, scored by the “BBC” audience model. The latter out-
let’s news are scored as more appealing then the former,
even though the model was trained on data from “BBC”.
50 100 150 200 250 300 350
−0.02
−0.01
0
0.01
0.02
0.03
0.04
0.05
0.06
Days between 1st June 2010 and 31st May 2011
BBC − Most Popular
The Daily Mirror − Top Stories
Figure 8: Comparison of average daily appeal scores for
“Top Stories” articles from “The Daily Mirror” and “Most
Popular” articles from “BBC”. The audience model has
been trained to recognise articles of such appeal score, and
the overlap of scores explains the different ranking of the
outlets in Figure 6.
WHAT MAKES US CLICK? - Modelling and Predicting the Appeal of News Articles
47
0 0.1 0.2 0.3 0.4 0.5 0.6 0.7
Reuters
Yahoo! News
International Herald Tribune
The New York Times
Los Angeles Times
Seattle Post
CNN
Time
The Boston Globe
The Arizona Republic
BBC
The Seattle Times
CBS
San Francisco Chronicle
USA Today
The Independent
The Guardian
Chicago Tribune
Huffington Post
Star Tribune
Daily News
The Denver Post
Daily Telegraph
Detroit Free Press
New York Post
Daily Express
The Philadelphia Inquirer
Weekly World News
New Scientist
The Sun
Daily Mail
The Daily Mirror
People.com
Figure 9: The 33 outlets, sorted by the average daily appeal scores of all audience models for their “Top Stories” articles for
one year of data between 1st June 2010 and 31st May 2011. Error bars represent standard error of the mean. UK tabloids
score highest, along with the news from the online presence of the “People” magazine, which carries predominantly celebrity
news. On the opposite, the news aggregator “Yahoo! News” and the newswire “Reuters” score least appealing.
0.58 0.6 0.62 0.64 0.66 0.68 0.7 0.72
16
18
20
22
24
26
28
30
Daily Telegraph
The Independent
Daily Mail
The Sun
The Daily Mirror
BBC
Reuters
The Guardian
New Scientist
USA Today
The New York Times
Los Angeles Times
Daily News
New York Post
Chicago Tribune
The Philadelphia Inquirer
The Denver Post
The Arizona Republic
Star Tribune
The Seattle Times
Detroit Free Press
San Francisco Chronicle
International Herald Tribune
CNN
CBS
Huffington Post
Time
Seattle Post
The Boston Globe
People.com
Yahoo! News
Global appeal
Linguistic subjectivity
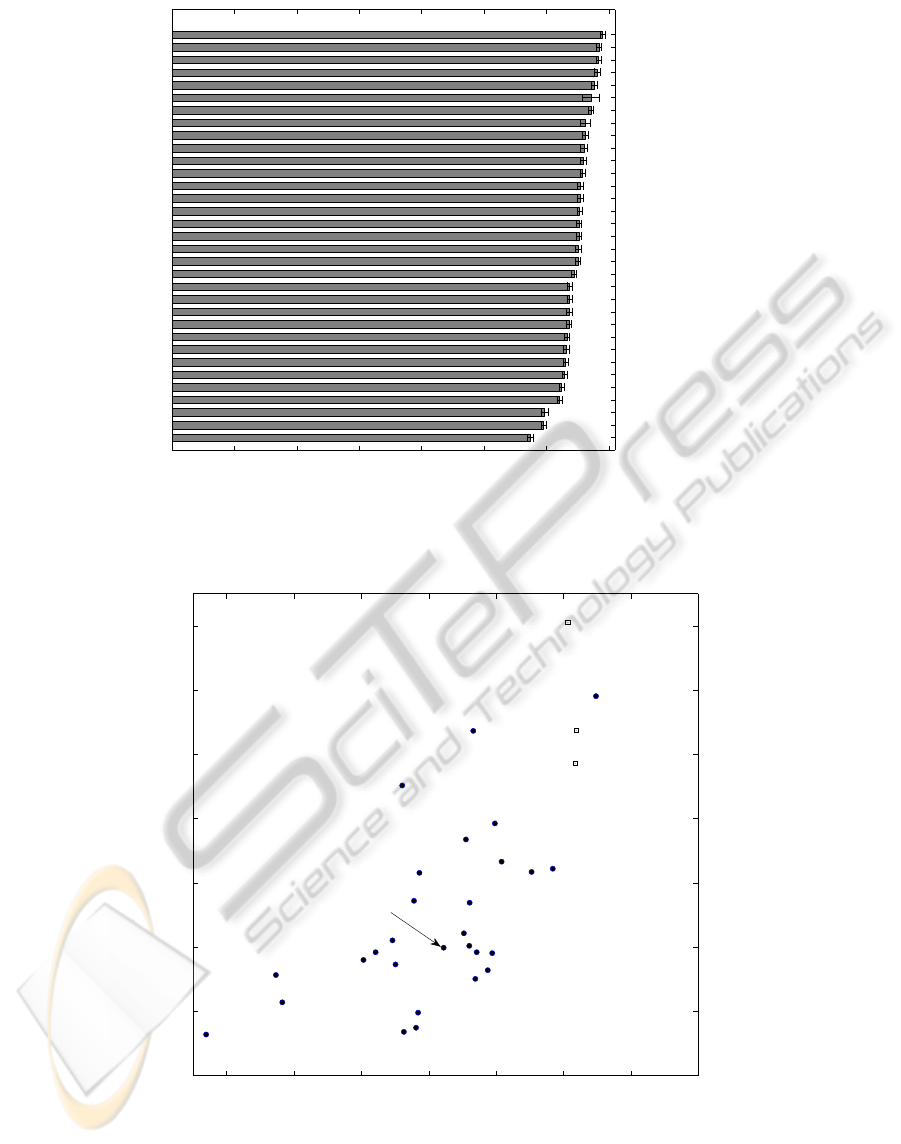
Figure 10: Outlets in the space of global appeal and linguistic subjectivity. UK tabloids, marked as rectangles, cluster together
in both dimensions.
“Weekly World News” scores highly. The news ag-
gregator “Yahoo! News” and the newswire “Reuters”,
on the contrary, appear at the bottom of this list. We
can assume two reasons for this result: the variety
of stories and topics of carried articles, and the use
of less subjective linguistic content and rather fac-
ICPRAM 2012 - International Conference on Pattern Recognition Applications and Methods
48

tual language. Broadsheet newspapers, such as “The
Guardian” or “Daily Telegraph” are placed in be-
tween those two extremes.
As an overall note, one should keep in mind that
the signal captured is just one part of the decision
making process of news readers. That signal refers to
“What makes us click an article?” and not to “What
makes us choose the outlet?”.
In terms of choice of words, we investigated fur-
ther, and calculated two more features for each article:
its readability and its linguistic subjectivity. Readabil-
ity describes the ease or difficulty of text comprehen-
sion, and it is a factor for reader satisfaction (Burgoon
et al., 1981). One widely used test to measure text
readability is the Flesch Reading Ease Test (Flesch,
1948), which uses average sentence length and av-
erage syllable count per word. Linguistic subjectiv-
ity quantifies the usage of sentiment-loaded words.
While in theory, a news article should be rather neu-
tral in its selection of words and just report the facts,
in reality outlets have the choice of wording news and
grasping the attention of their readers by using ei-
ther positively or negatively loaded words. Our mea-
sure of linguistic subjectivity focuses on adjectives as
the strongest sentiment carriers (Hatzivassiloglou and
Wiebe, 2000), and it is defined as the ratio of adjec-
tives with sentiment over the total number of adjec-
tives in a text.
We computed linguistic subjectivity and readabil-
ity scores for articles that appeared in “Top Stories”
feed of 31 outlets in the same time interval as for
the appeal scores, and we measure pairwise Pearson
correlation between outlets’ global appeal, readability
and linguistic subjectivity. Table 4 presents our find-
ings and the corresponding p-values. We observe a
strong and significant correlation between global ap-
peal of an outlet and its linguistic subjectivity.
Table 4: Pairwise correlation coefficient and p-values be-
tween global appeal, readability and linguistic subjectivity
for 31 outlets.
Appeal vs. Corr. coeff. p-value
Readability 0.2653 0.1492
Linguistic Subjectivity 0.6791 0.0000
We visualise all outlets in the two-dimensional
space of appeal and linguistic subjectivity in Figure
10. UK tabloids and the “People” magazine are posi-
tioned close to each other, and further apart from other
outlets. On the opposite directions, we can find the
newswire “Reuters” and “BBC”. Another observation
is that “The Boston Globe”, “The New York Times”
and its international version “International Herald Tri-
bune” – all assets of “The New York Times Com-
pany”
2
– have similar linguistic subjectivity and ap-
peal.
6 CONCLUSIONS AND FUTURE
WORK
We have shown how limited information from news
feeds of online news can be used to model readers’
preferences and articles’ appeals.
We modelled pairwise preferences for six differ-
ent audience groups based on a period of one year.
After measuring their distances from each other, we
could observe that some audience’ models are very
close to each other in terms of their news preferences,
while all groups are clustered and homogeneous,with
a stable prediction performance over time.
As next step, we used representative models to
score articles for one year, on different topics of news,
and on a large amount of other outlets. This allowed
to obtain an average appeal score for 33 international
news outlets and to visualise the connection between
tabloids and high appeal. We also showed a strong
correlation between linguistic subjectivity, i.e. a fac-
tor of writing style, and articles’ appeal.
Such analyses can be helpful for journalists and
editors to understand what their readers enjoy reading
about and which words trigger the audience’s atten-
tion. Indeed, different topics differ in their appeal,
allowing for further investigations of questions such
as “why?” and “how exactly?”.
Similar models represent audiences with similar
preferences. For the outlets of these audiences, this
similarity information can provide a better under-
standing of their competition. Our models also cap-
ture the general strong appeal of articles from tabloids
and celebrities outlets.
In our future work we will introduce more proper-
ties of news articles that are likely to influence reader
choices, such as the presence of celebrities, the report
of scandals, or the use of sensational language. We
aim to investigate further how choices and interests of
audiences are related to choices of outlet editors, and
how readers’ clicks can be affected by textual content,
as we have shown for linguistic subjectivity.
ACKNOWLEDGEMENTS
I. Flaounas and N. Cristianini are supported by the
CompLACS project (European Community’s Sev-
2
Source (Aug. 2011): http://www.nytco.com/company/
index.html
WHAT MAKES US CLICK? - Modelling and Predicting the Appeal of News Articles
49

enth Framework Programme - grant agreement No.
231495); N. Cristianini is supported by a Royal So-
ciety Wolfson Research Merit Award; All authors are
supported by Pascal2 Network of Excellence.
REFERENCES
Assael, H. and A. Marvin Roscoe, J. (1976). Approaches
to market segmentation analysis. The Journal of Mar-
keting, 40(4):67–76.
Boczkowski, P. J. and Mitchelstein, E. (2010). Is there a
gap between the news choices of journalists and con-
sumers? A relational and dynamic approach. The In-
ternational Journal of Press/Politics, 15(4):420–440.
Boser, B., Guyon, I., and Vapnik, V. (1992). A training algo-
rithm for optimal margin classifiers. In Proceedings of
the 5th Conference on Computational Learning The-
ory (COLT), pages 144–152.
Burgoon, M., Burgoon, J. K., and Wilkinson, M. (1981).
Writing style as a predictor of newspaper reader-
ship, satisfaction and image. Journalism Quarterly,
58:225–231.
Cristianini, N. and Shawe-Taylor, J. (2000). An introduction
to Support Vector Machines and other kernel-based
learning methods. Cambridge University Press.
Das, A., Datar, M., Garg, A., and Rajaram, S. (2007).
Google news personalization: scalable online collab-
orative filtering. In Proceedings of the 16th Interna-
tional Conference on World Wide Web (WWW), pages
271–280.
Flaounas, I., Ali, O., Turchi, M., Snowsill, T., Nicart, F.,
De Bie, T., and Cristianini, N. (2011). NOAM: news
outlets analysis and monitoring system. In Proceed-
ings of the 2011 international conference on Manage-
ment of data (SIGMOD ’11), pages 1275–1278.
Flesch, R. (1948). A new readability yardstick. Journal of
Applied Psychology, 32(3):221–233.
Hatzivassiloglou, V. and Wiebe, J. (2000). Effects of adjec-
tive orientation and gradability on sentence subjectiv-
ity. In Proceedings of the International Conference on
Computational Linguistics, pages 299–305.
Hensinger, E., Flaounas, I. N., and Cristianini, N. (2010).
Learning the preferences of news readers with SVM
and Lasso ranking. In Proceedings of Artificial Intel-
ligence Applications and Innovations - 6th IFIP WG
12.5 International Conference (AIAI), pages 179–186.
Hensinger, E., Flaounas, I. N., and Cristianini, N. (2011).
Learning readers’ news preferences with Support Vec-
tor Machines. In Proceedings of Adaptive and Natu-
ral Computing Algorithms - 10th International Con-
ference (ICANNGA), pages 322–331.
Joachims, T. (2002). Optimizing search engines using
clickthrough data. In Proceedings of the Eighth
ACM SIGKDD International Conference on Knowl-
edge Discovery and Data Mining (KDD), pages 133–
142.
Joachims, T. (2006). Training linear SVMs in linear time.
In Proceedings of the Twelfth ACM SIGKDD Interna-
tional Conference on Knowledge Discovery and Data
Mining (KDD), pages 217–226.
Liu, B. (2007). Web Data Mining, Exploring Hyperlinks,
Contents, and Usage Data. Springer.
Liu, J., Dolan, P., and Pedersen, E. R. (2010). Personal-
ized news recommendation based on click behavior.
In Proceedings of the 15th international conference
on Intelligent user interfaces, (IUI ’10), pages 31–40.
Porter, M. (1980). An algorithm for suffix stripping. Pro-
gram, 14:130–137.
Salton, G., Wong, A., and Yang, C. S. (1975). A vector
space model for automatic indexing. Communications
of the ACM, 18:613–620.
Sculley, D. and Wachman, G. M. (2007). Relaxed on-
line SVMs for spam filtering. In Proceedings of the
30th annual international ACM SIGIR conference on
Research and development in information retrieval,
pages 415–422.
T.Harcup and D.O’Neill (2001). What is News? Galtung
and Ruge revisited. Journalism Studies, 2(2):261–
280.
ICPRAM 2012 - International Conference on Pattern Recognition Applications and Methods
50
