
TOO FAST TOO FURIOUS
Faster Financial-market Trading Agents Can Give Less Efficient Markets
John Cartlidge, Charlotte Szostek, Marco De Luca and Dave Cliff
Department of Computer Science, University of Bristol
Merchant Venturers Building, Woodland Road, BS8 1UB, Bristol, U.K.
Keywords:
Software agents, Auctions, Financial markets, Algorithmic trading, High-frequency trading, HFT, Computa-
tional finance, Human-agent experiments, OpEx.
Abstract:
For many of the world’s major financial markets, the proportion of market activity that is due to the actions
of “automated trading” software agents is rising: in Europe and the USA, major exchanges are reporting
that 30%–75% of all transactions currently involve automated traders. This is a major application area for
artificial intelligence and autonomous agents, yet there have been very few controlled laboratory experiments
studying the interactions between human and software-agent traders. In this paper we report on results from
new human-agent experiments using the OpEx experimental economics system first introduced at ICAART-
2011. Experiments explore the extent to which the performance of the traders, and of the market overall, is
dependent on the speed at which the agents operate. Surprisingly, we found that slowing down the agents
increased the markets overall ability to settle to a competitive equilibrium, and that slow-agent markets were
more efficient.
1 INTRODUCTION
For many of the world’s major financial markets, in
the past quarter of a century or less, the traditional
scene of a central exchange’s “trading floor” popu-
lated by large numbers of human traders interacting
with each other to buy and sell blocks of financial
instruments has been replaced by electronic markets.
Traders still interact with each other to discover coun-
terparties and agree a price for a transaction, but they
do so via trader-interface client computers that attach
to the exchange’s server, which may be many kilome-
tres away. For many of the world’s major exchanges,
there is now no physical trading floor; instead every-
thing happens via electronic interaction.
As this shift has taken place, so it has enabled
software agents with various degrees of artificial in-
telligence (AI) to replace human traders. The propor-
tion of market activity that is due to the actions of
“automated trading” software agents is rising: in Eu-
rope and the USA, major exchanges are reporting that
30%–75% of all transactions currently involve auto-
mated traders (Foresight Project, 2011). Many invest-
ment banks, hedge funds, and money-management
firms are now so dependent on technology involv-
ing sophisticated and computationally intensive anal-
ysis of financial data combined with high-speed au-
tomated trading systems, that these financial-sector
businesses have in reality become technology com-
panies. AI techniques are used to analyse large fi-
nancial data-sets of both numeric and non-numeric in-
formation, to generate trading signals that are fed to
autonomous software-agent “algorithmic trading” or
“automated execution” systems which perform roles
that ten years ago would have been the responsibility
of a human trader.
As algorithmic trading has become common over
the past decade, automated trading systems have been
developed with truly super-human performance, as-
similating and processing huge quantities of data,
making trading decisions, and executing them, on
sub-second timescales. This has enabled what is
known as high-frequency trading, where algorithmic
trading systems will take positions in the market (e.g.,
by buying a block of shares) for perhaps one or two
seconds or less, before reversing the position (e.g.,
selling the block of shares); each such transaction
generates only a few cents worth of profit, but by do-
ing this constantly and repeatedly throughout the day,
steady streams of significant profit can be generated.
For accounts of recent technology developments in
the financial markets, see: Angel, Harris, and Spratt
(2010), Gomber, Arndt, Lutat, and Uhle (2011), Lein-
weber (2009), Perez (2011).
126
Cartlidge J., Szostek C., De Luca M. and Cliff D..
TOO FAST TOO FURIOUS - Faster Financial-market Trading Agents Can Give Less Efficient Markets.
DOI: 10.5220/0003720301260135
In Proceedings of the 4th International Conference on Agents and Artificial Intelligence (ICAART-2012), pages 126-135
ISBN: 978-989-8425-96-6
Copyright
c
2012 SCITEPRESS (Science and Technology Publications, Lda.)

Clearly, the current financial markets are a major
application area for research in AI and autonomous
agents, and the present-day markets are populated by
a mix of human and software-agent traders. Given
the huge economic significance of the financial mar-
kets in most advanced economies, it seems reason-
able to expect that there would be a well-established
body of research that studies the interaction of human
traders with autonomous software-agent trading sys-
tems. Surprisingly, this is not the case: in fact, the
number of scientific studies of human-agent interac-
tions in electronic marketplaces is staggeringly small.
The entire research literature includes only six papers:
we discuss each in Section 2.
The main contribution of this paper is our demon-
stration of new results from controlled laboratory
studies of human and software-agent traders interact-
ing in electronic marketplaces. Our new results indi-
cate something that is perhaps counterintuitive: when
automated trader-agents are slowed down to operate
on human time-scales, the efficiency of the overall
market dynamics increases. We demonstrate this by
detailed reporting and analysis of results from new
human-agent experiments using the OpEx experimen-
tal economics system that was first introduced by De
Luca and Cliff (2011a). We explore the extent to
which the performance of traders, and of the market
overall, is dependent on the speed at which the agents
operate: we ran one set of experiments where the “re-
action time” of agents was faster than human traders
can realistically be expected to operate at, and another
set where agents were slowed to operate at human-
like timescales. Perhaps counter-intuitively, we found
that slowing down the agents increased the market’s
overall ability to settle to a competitive equilibrium,
and that slow-agent markets were more efficient. We
describe our methods in Section 3, present results in
Section 4, and discuss those results in Section 5.
2 BACKGROUND
2.1 Economics, Experiments, & Agents
In the academic economics literature, the mechanism
within which buyers and sellers interact on almost all
of today’s electronic financial markets is known as
the continuous double auction (CDA). In this mech-
anism, buyers are free to announce (or “quote”) bid-
prices at any time, and sellers are free to quote offer-
prices (also commonly referred to as “asks”) at any
time. Also, at any time, any seller is free to accept
(or “hit”) any buyer’s bid, and any buyer is free to
hit any seller’s offer. When Trader A hits Trader B’s
quote, whatever price B quoted is the agreed price of
the transaction. There may be a clock running, in-
dicating for how much longer the market will remain
open, but there is no central auctioneer or coordinator:
the exchange’s central server exists to receive bids and
offers, to display a summary (commonly known as the
order-book) of the current outstanding quotes to all
market participants, and to remove orders when they
are hit, passing the details of the transaction to appro-
priate clearing and settlement systems.
The order book will typically show quote data in
two columns or lists: one for bids, the other for asks.
Both lists will be ordered best-to-worst, so bid prices
will appear in descending numerical order (highest-
first) and ask-prices will appear in ascending numeri-
cal order (lowest-first). Very often, next to each price
will be an indication of the quantity available at that
price. In liquid markets, the number of orders and
price-points in the order book may be very large, and
the order-book displayed on a trader’s screen may
only show the best ten or twenty prices.
The CDA is the auction mechanism that under-
lies most of the world’s financial markets: the many
electronic markets and the few remaining ones that
use a physical trading floor. Every hour of every
working day, trillions of dollars-worth of orders flow
through CDA markets. Understanding the dynam-
ics of such markets, how they behave under varying
circumstances, is an endeavour that can be pursued
by observation of real-world market activity, or by
controlled experimentation in laboratory settings with
traders interacting in artificial markets. This second
approach is known as experimental economics, a field
established in a seminal sequence of papers published
by Vernon Smith in the early 1960’s, a contribution
for which he was awarded the Nobel Prize in Eco-
nomics in 2002 (for further details, see Smith, 2006).
In his landmark first paper, Smith (1962) reported
on experiments in which he took a number of human
subjects and randomly assigned them to be traders,
either buyers or sellers. Each buyer was given a quan-
tity of money and a private (known only to that seller)
limit price, the maximum they should pay for a unit
of the “stock” being traded in the market. Each seller
was given one or more units of stock to sell (all sell-
ers’ units of stock were each identical and carried no
real-world value) along with a private limit price, the
price below which they should not sell that unit of
stock. The experimental CDA market then opened
for a “trading-day” and the traders were allowed to
quote bids and offers and to hit each other’s quotes.
If a buyer had used up all her money, or a seller had
sold all her units, she dropped out of the market for
the rest of that day. This continued until either no
TOO FAST TOO FURIOUS - Faster Financial-market Trading Agents Can Give Less Efficient Markets
127

traders were able or interested in trading, or a time-
limit expired for that “day”. In reality, each “day”
lasted five or ten minutes. At the end of each “day”,
any unused assignments of money or units of stock
were returned to the experimenters. Subjects were re-
warded in proportion to how much “profit” or “utility”
they had generated, calculated as the differences be-
tween transaction prices and their private limit prices.
So, for example, if a buyer with a limit price of $2.00
hit the order of a seller who had quoted $1.80, where
the seller’s limit price was $1.50, the buyer’s utility
would be $0.20 and the seller’s would be $0.30.
Smith’s experiments typically ran for several (five
to ten) trading “days”, with fresh assignments of stock
and money being made at the start of each “day”. The
set of buyers’ limit prices defined a market demand
schedule (conventionally plotted as a demand curve
on a graph illustrating the relationship between quan-
tity and price) and the sellers’ limit prices defined a
market supply schedule (commonly plotted as a sup-
ply curve). As any student of elementary economics
is aware, the point at which the supply and demand
curve intersect, where the quantity demanded equals
the quantity supplied, defines the market’s equilib-
rium price which we denote by P
0
and its equilibrium
quantity which we denote Q
0
. If transactions take
place at P
0
then the allocation of resources from sell-
ers to buyers can be optimal, for a particular definition
of optimality. One of the very attractive features of
the CDA that Smith’s experiments helped to illumi-
nate is that it can reliably, rapidly, and robustly “dis-
cover” the underlying equilibrium price, with trans-
action prices converging on P
0
even with only small
numbers of traders, and where each trader is acting
only out of self-interest and without any trader dis-
closing their private limit-prices.
Smith measured the equilibration (equilibrium-
finding) behaviour of his experimental CDA markets
using a metric that he referred to as α, the root mean
square difference between each transaction price, p
i
,
over some period, and the P
0
value for that period,
expressed as a percentage of the equilibrium price:
α =
1
P
0
s
1
n
n
∑
i=1
(p
i
− P
0
)
2
(1)
As we discuss at length in De Luca, Szostek,
Cartlidge, and Cliff (2011), this design—the one that
Smith (1962) chose for his first set of experiments—
has proven to be extremely influential and its influ-
ence has been very long-lasting. Experimental eco-
nomics became a well-established field, with many
researchers around the world exploring various types
of market mechanism under various types of circum-
stances. Initially, all work in experimental economics
involved human subjects, but as the computing power
fell in cost so some academic economists (such as
Arthur, 1993) suggested that computer programs, au-
tonomous software agents, could be written to sim-
ulate the human subjects and could operate as sub-
stitutes for those humans, thereby allowing for large
numbers of experiments to be conducted without the
time and monetary costs of running experiments with
rooms full of humans. At much the same time, the
notion of working on software agents, for a wide va-
riety of purposes, was gaining popularity in the AI
research community, and a sizeable research commu-
nity grew up around the area of agent-mediated elec-
tronic commerce (AMEC: see, e.g., Noriega & Sierra,
1999). However the focus in the AI/agents/AMEC re-
search communities was almost exclusively on stud-
ies of software agents interacting with other software
agents in various market scenarios: there are so few
papers in the literature that study the interactions of
human traders with software-agent traders that we can
discuss all of them here.
2.2 IBM 2001
The first ever scientific study of the interactions be-
tween human and robot traders in experimental CDA
markets was published in 2001 by a team of re-
searchers working at IBM’s Research Labs (Das,
Hanson, Kephart, & Tesauro, 2001). The IBM
team tested several software-agent strategies, includ-
ing “Zero-Intelligence-Plus” (ZIP: Cliff & Bruten,
1997) and a version of the “GD” algorithm intro-
duced by Gjerstad and Dickhaut (1998), which IBM
had modified and re-named as MGD. Both ZIP and
MGD had originally been tested only in CDA mar-
kets populated by copies of the same algorithm, which
could hence be simulated at great speed. However,
to run these algorithms against human traders, the
IBM researchers introduced a sleep-wake cycle for the
trading-agents, where on each loop of the cycle they
would be prevented from trading by going into a dor-
mant ‘sleep’ mode for s seconds, then ‘wake up’, is-
sue quotes and potentially enter into transactions, and
then go back to sleep. Most of IBM’s results came
from ‘fast’ agents where s = 1.0, but they also pro-
vided a brief discussion of results from ‘slow’ agents
where s = 5.0.
IBM’s results showed that both ZIP and MGD
could consistently out-perform human traders, an out-
come that generated worldwide press coverage. They
also found, curiously, that the efficiency of the mar-
kets (a measure that we define formally later in this
paper) reduced when the traders in the markets were
mixtures of humans and agents: purely human mar-
ICAART 2012 - International Conference on Agents and Artificial Intelligence
128

kets, and purely agent markets, each had better effi-
ciency scores than did the human-agent ones.
The new results that we present in this paper give
a more detailed exploration of the effects of varying
the ‘reaction speed’ s, but for a more recent trading-
agent strategy that has been shown in previous papers
to outperform both ZIP and MGD.
2.3 Grossklags & Schmidt 2003/2006
Grossklags & Schmidt (G&S) performed a set of
human-agent experiments that they describe in two
papers (Grossklags & Schmidt, 2003, 2006). This
work was clearly inspired by Das et al. (2001), and
they duly cited that paper. However, G&S used their
own trader-agent algorithm rather than any of the
ones employed by IBM, in order to explore a dif-
ferent issue: the effect of knowledge/ignorance of
the presence of trader-agents on the behaviour of hu-
man traders. So, while G&S might reasonably be
described as having been inspired by the IBM work;
they had certainly not replicated it. G&S found that
there was indeed a significant “knowledge effect”:
market dynamics were altered just by telling the hu-
mans that there were software agents in the market.
2.4 De Luca & Cliff 2011
In their ICAART-2011 paper, De Luca and Cliff
(2011a) introduced De Luca’s Open Exchange
(OpEx) system, an experimental algorithmic trad-
ing platform designed to closely resemble the struc-
ture and behaviour of modern commercial financial
market electronic trading systems, and to be generic
enough to support experimental economics simula-
tions of arbitrary complexity. OpEx involves a num-
ber of ‘netbook’ cheap portable PCs connected to a
central ‘exchange server’. Human traders enter their
orders in the Trading GUI (graphical user interface)
running on their netbook; the GUI allows users to
view the market order book, their “blotter” (personal
history of orders and trades), and their current as-
signments of stock or money. Trader-agents, on the
other hand, produce orders automatically, without the
need of human intervention, on the basis of the market
conditions that they observe: in principle the trader-
agents can be given the same information as is pre-
sented to the human traders on the GUI, although
many trading-agent strategies use only a subset of
such information. For further details of the design,
implementation, and use of OpEx, see De Luca and
Cliff (2011a) and De Luca et al. (2011).
De Luca and Cliff (2011a) presented results that
replicated and extended IBM’s paper. The replica-
tion involved running human-agent CDA experiments
with the agents using Cliff’s ZIP strategy; the exten-
sion explored the response of GDX, an extended form
of the MGD algorithm that IBM had used in 2001.
GDX was invented by IBM researchers Tesauro and
Bredin (2002), some time after IBM’s human-agent
paper: from the order in which the papers appeared,
and given that MGD and ZIP scored approximately
the same in the 2001 paper, it seems reasonable to
speculate that GDX was invented in an attempt to es-
tablish it as clearly the best-performing CDA strategy
in the published literature. However, the paper intro-
ducing GDX (Tesauro & Bredin, 2002) only shows
results from agent-vs-agent experiments: it had never
been tested against human traders before De Luca &
Cliff’s experiments.
De Luca and Cliff (2011a) monitored Smith’s α
metric and also two other standard measures of mar-
ket activity: the allocative efficiency, E, of traders is
the total profit earned by a trader, π
i
, divided by the
maximum theoretical profit for that trader,
ˆ
π
i
: that is,
the profit a trader could have made if all market partic-
ipants would have traded units at the theoretical mar-
ket equilibrium price, P
0
.
E =
1
n
n
∑
i=1
π
i
ˆ
π
i
(2)
And the profit dispersion, which we denote here as
π
disp
, is the deviation of actual profits of traders, π
i
,
from the maximum theoretical profit of traders,
ˆ
π
i
.
π
disp
=
s
1
n
n
∑
i=1
(π
i
−
ˆ
π
i
)
2
(3)
De Luca and Cliff (2011a) found that GDX did indeed
outperform ZIP in human-vs.-agent experiments, on
all these metrics.
In a subsequent paper, De Luca and Cliff (2011b)
tested a more recent trading strategy called AA,
one that again had previously only been evalu-
ated in agent-vs-agent experiments. AA stands for
Adaptive Aggressive and was the primary contribu-
tion of Vytelingum’s (2006) PhD Thesis (see also
Vytelingum, Cliff, & Jennings, 2008). Vytelingum
had demonstrated that AA dominates GDX in agent-
vs-agent experiments, but he had not tested it in
human-vs-agent contexts. De Luca & Cliff’s results
from human-vs-AA experiments demonstrated that
AA indeed outperformed GDX, and they concluded
that AA is hence the best-performing published CDA
trading strategy.
TOO FAST TOO FURIOUS - Faster Financial-market Trading Agents Can Give Less Efficient Markets
129

2.5 De Luca et al. 2011
In De Luca et al. (2011), a 24,000-word briefing pa-
per written for, and published by, the UK Government
Office for Science as part of their Foresight project on
the future of computer trading in the financial mar-
kets,
1
we reported on a new set of experiments de-
signed to explore the response of AA and ZIP strate-
gies in a setting significantly closer to the reality of
current financial markets. Ever since Smith’s semi-
nal 1962 paper, many experimental economic studies
have copied his initial experiment design of dividing
the experiment into a number of discrete periods or
“days”, each lasting a few minutes, with allocations
of stock and money expiring at the end of each day,
and with fresh allocations then being assigned to all
participants at the start of each new “day”.
The longevity of that experiment design can per-
haps be explained by the desire for consistency that
each successive set of authors had need for in com-
paring their results with earlier work. For example,
De Luca and Cliff (2011a, 2011b) used this design
because they wanted to be able to make direct com-
parisons between their results and Vytelingum’s from
his publications introducing AA, and IBM’s from
the 2001 paper. Presumably, in turn, Vytelingum
had used this experiment design because it had been
used by IBM; IBM used it because it had been used
by Cliff’s first publications describing the ZIP algo-
rithm and also, independently, by Gjerstad & Dick-
haut when they introduced the GD algorithm.
Despite its longevity, this design of experiment is
clearly artificial. Smith referred to the discrete pe-
riods in his experiments as “days”, presumably as a
sign that he intended his experiments as studies of
the equilibration dynamics of CDA markets measured
over periods of days with the market closing at the end
of each day and then reopening some hours later for
the next day’s trading. But many present-day financial
markets are, for practical purposes, continuously run-
ning. For instance, if a trader wants to convert a quan-
tity of US Dollars into a quantity of Euros, whatever
time of day it is at that trader’s location, somewhere in
the world there will be a foreign exchange (FX) mar-
ket operating that the trader can connect to, to do the
deal. As the London FX market closes each evening,
dealers in New York take over as the world’s primary
FX market; as New York closes, the focus of market
activity switches to Tokyo, and as Tokyo closes, the
next day’s FX trading is starting in London.
In addition to being continuously running rather
than broken into a sequence of discrete CDA auctions,
1
http://www.bis.gov.uk/foresight/our-work/projects/
current-projects/computer-trading
real-world CDA financial markets also have the obvi-
ous feature that traders can join the market or leave
the market at any time. When they join the market,
they bring stock or money with them, thereby adding
to the liquidity of the market; and when they leave the
market, their withdrawal reduces the liquidity in the
market. This is in stark contrast to Smith’s experiment
design where liquidity is gradually consumed during
each trading period (as traders transact and withdraw
from the market for that day) and then at the start of
each new trading period liquidity spikes back up to its
initial maximum again.
We explored the response of AA and ZIP in CDA
experiments where there was no division of trading
into discrete days, and where the market liquidity was
continuously replenished by trickle-feeding it in over
the duration of the experiment rather than all arriving
in one burst at the start of each trading period. For
this we used the design explored in a human-market
experimental economics study reported by Cliff and
Preist (2001). Surprisingly, we found that when the
experiment design was changed to a single period
with continuous replenishment, both AA and ZIP
were outperformed by the human traders, and so we
concluded that the previously-reported dominance of
ZIP and AA over humans in CDA markets (i.e., Das
et al., 2001; De Luca & Cliff, 2011a, 2011b) appeared
to be a consequence of the experiment design that was
used in those earlier studies. In that paper we concen-
trated on exploring the responses on “fast” (s = 1.0)
versions of the algorithms, as had been used in IBM’s
work, but we also ran two experiments with a “slow”
(s = 10.0) version. Differences in the response of the
fast and slow versions led us to speculate that perhaps
the algorithms would outperform the human traders if
they were given even faster response times.
And it is for that reason that we undertook our lat-
est batch of experiments, the results from which are
reported for the first time in the next section. Our in-
tention was to generate additional data for “slow” ver-
sions of the algorithms, so that we had enough sam-
ples that we could draw statistically significant con-
clusions, and then to contrast those results with the
first-ever studies of humans interacting with “ultra-
fast” versions of the agent algorithms, with a sleep-
time of only s = 0.1 seconds—a ‘reaction time’ that
is manifestly faster than that at which a human could
plausibly be relied on to operate successfully. In the
following section we describe our methods and the re-
sults, and then discuss the surprising outcome of our
experiments: giving the trading agents faster reaction
times worsened the efficiency of our CDA markets.
ICAART 2012 - International Conference on Agents and Artificial Intelligence
130

3 METHOD
We present here a new series of artificial trad-
ing experiments between humans and agents using
DeLuca’s OpEx framework. We explore the perfor-
mance of AA under two conditions: AA-ultra (“ultra-
fast” trader-agents set to wake and calculate every
0.1s) and AA-slow (“slow” trader-agents set to wake
every 10s and perform further internal calculations
every 2.5s). All experiments were run at the Uni-
versity of Bristol between April and July 2011 using
postgraduate students in non-financial but analytical
subjects (i.e., students with skills suitable for a pro-
fessional career in finance, but with no specific trad-
ing knowledge or experience). Moving away from the
artificial constraint of regular simultaneous replenish-
ments of currency and stock historically used in previ-
ous experiments, we instead choose to drip-feed order
assignments into the market at regular intervals.
3.1 Experimental Setup
AA trading agents have short term and long term
adaptive components (Vytelingum, 2006). In the
short term, agents use learning parameters β
1
and λ to
adapt their order aggressiveness. Over a longer time
frame, agents use the moving average of the previ-
ous N market transactions and a learning parameter
β
2
to estimate the market equilibrium price, ˆp
0
. For
all experiments, we set parameter values β
1
= 0.5,
λ = 0.05, N = 30, and β
2
= 0.5. The convergence
rate of bids/asks to transaction price is set to η = 3.0.
For each experiment, 6 human participants were
seated around a rectangular table with three buyers
on one side and three sellers opposite. Participants
were given a brief introduction to the trading GUI
and the rules of the market. Typically, this lasted less
than 10 minutes. The market was then reset to clear
any residual orders from the system before the exper-
iment was started. Each experiment lasted 20 min-
utes, during which the 6 human participants (3 buyers
and 3 sellers) and 6 trader-agents (3 buyers and 3 sell-
ers) competitively traded to maximise profit. Trader-
agents were homogeneously configured to be either
AA-slow or AA-ultra.
To encourage participation, humans were each
given a cash payment, P, for taking part. Then, as
a further incentive to encourage competition, the par-
ticipants finishing first (the human with the highest
efficiency score) and second were given an additional
cash bonus payment of 2P and P, respectively.
2
2
In early trials, cash prizes were set to P = £20, hence,
the winner received a total sum of £60, including partici-
pation fee. However, in later experiments, to reduce costs,
Table 1: Permit replenishment schedule (170s cycle). Limit
prices of traders’ order assignments and the time-step they
are sent (numbers in brackets are multiples of 10s).
1 2 3 4 5 6
Buyer 1 350 (0) 250 (4) 220 (7) 190 (9) 150 (14) 140 (16)
Buyer 2 340 (1) 270 (3) 210 (8) 180 (10) 170 (12) 130 (17)
Buyer 3 330 (2) 260 (4) 230 (6) 170 (11) 160 (13) 150 (15)
Seller 1 50 (0) 150 (4) 180 (7) 210 (9) 250 (14) 260 (16)
Seller 2 60 (1) 130 (3) 190 (8) 220 (10) 230 (12) 270 (17)
Seller 3 70 (2) 140 (4) 170 (6) 230 (11) 240 (13) 250 (15)
0
50
100
150
200
250
300
350
400
0 1 2 3 4 5 6 7 8 9 10 11 12 13 14 15 16 17 18
Price
Quantity
Q
0
#
P
0
#
Supply#
Demand#
Figure 1: Supply and demand schedule generated by permit
schedule shown in Table 1. Each replenishment cycle, equi-
librium price P
0
= 200 and equilibrium quantity Q
0
= 9.
Each experiment started with an empty market-
place. Then, order assignments were periodically dis-
tributed to traders. Table 1 shows the permit sched-
ule used to generate order assignments and describes
one full replenishment cycle lasting 170s. The permit
schedule describes the limit price of each trader’s as-
signment and the time-step that it is sent (numbers in
brackets represent the time in 10s steps relative to the
start of the replenishment cycle). Thus, we see that
at the start of each cycle, human Buyer1 and trader-
agent Buyer1 each receive a buy order assignment
with limit price 350; and human Seller1 and trader-
agent Seller1 each receive a sell order assignment
with limit price 50. After 170s the replenishment
cycle repeats, producing 7 full permit cycles during
the 20 minutes experiment (no assignments were sent
in the final 10s). Fig. 1 shows the demand and sup-
ply schedules generated by Table 1. We see that de-
mand and supply is symmetric (and unbiased) about
P
0
= 200. Each replenishment cycle, the sequence
of limit prices for order assignments are arranged in
an arithmetic progression. Thus, early in the cycle
(time< 90s), assignments are easier to execute, hav-
ing buy (sell) limit prices above (below) P
0
.
When a trader receives an assignment it is auto-
matically queued until the trader decides to work it.
humans were required to compete in 3 consecutive experi-
mental trials. For these experiments, the participation pay-
ment was doubled to P = £40, with the overall winner from
the 3 trials receiving a total cash sum of £120 (£80 for sec-
ond place).
TOO FAST TOO FURIOUS - Faster Financial-market Trading Agents Can Give Less Efficient Markets
131
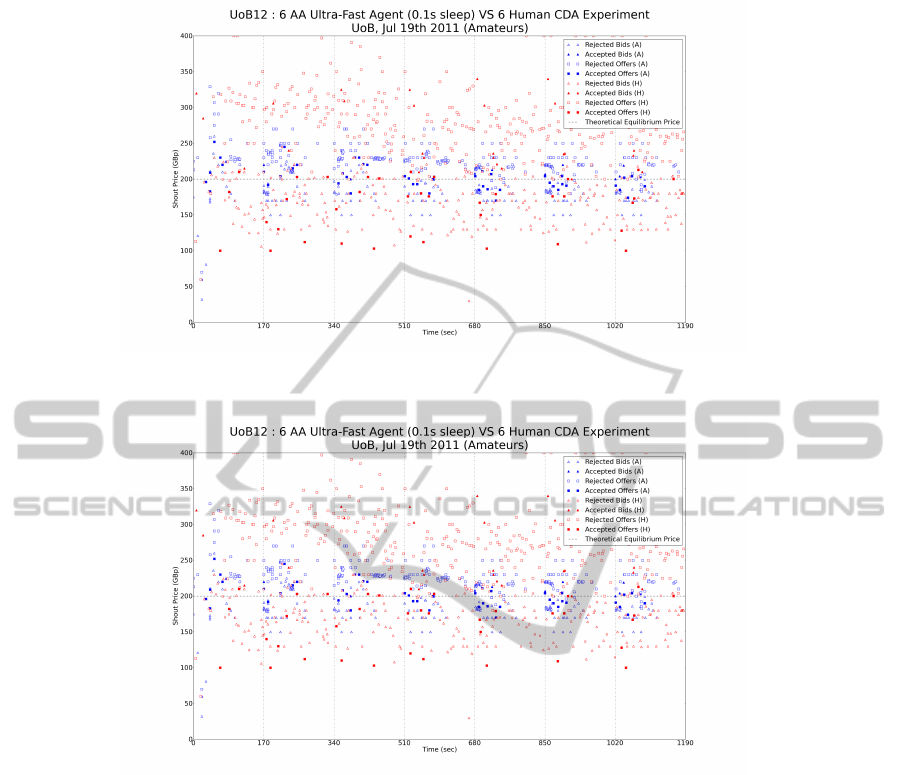
Figure 2: Time-series of all quotes posted onto the order book during run U12-ultra. The dashed horizontal line represents P
0
and vertical lines represent the start and end of each replenishment cycle.
Figure 3: Time-series of all execution prices during un U12-ultra. The dashed horizontal line represents P
0
and vertical lines
represent the start and end of each replenishment cycle.
Traders are able to work assignments in any order and
at any time, thus enabling them to have multiple si-
multaneous order on the exchange. To stop traders
from making a loss, order submissions are capped at
the limit price. Thus, the profit on each trade is cal-
culated as the difference between execution price and
limit price. To ease analysis, the maximum theoreti-
cal profit,
ˆ
π, available to each trader was deliberately
kept equal.
In total, a series of 7 experiments were run: 3 un-
der condition AA-ultra, and 4 under AA-slow.
4 RESULTS
Fig. 2 shows the time-series of shouts (buy and sell
orders submitted to the exchange) for experiment
UoB12-ultra, with human quotes in red and agents in
blue. This rich data set is selected as a representa-
tive example of market activity. Filled and open-faced
markers show accepted and rejected shouts respec-
tively, with triangles representing bids and squares
representing offers. Vertical lines denote the start and
end of each permit replenishment cycle (170s) and the
dashed horizontal line shows the theoretical market
equilibrium price, P
0
= 200. Fig. 3 shows the time-
series of execution prices for the same experiment.
It is clear from this view that the majority of trading
occurs in clusters at the start of each replenishment
cycle. This correlates with our expectation, since as-
signments that are easiest to trade are distributed early
in the cycle (refer to Table 1). Further, it can be seen
that after an initial exploratory period, trade prices
in each cycle are distributed in clusters around P
0
.
This distribution of trade prices around the theoreti-
ICAART 2012 - International Conference on Agents and Artificial Intelligence
132
cal equilibrium price can be quantified using Smith’s
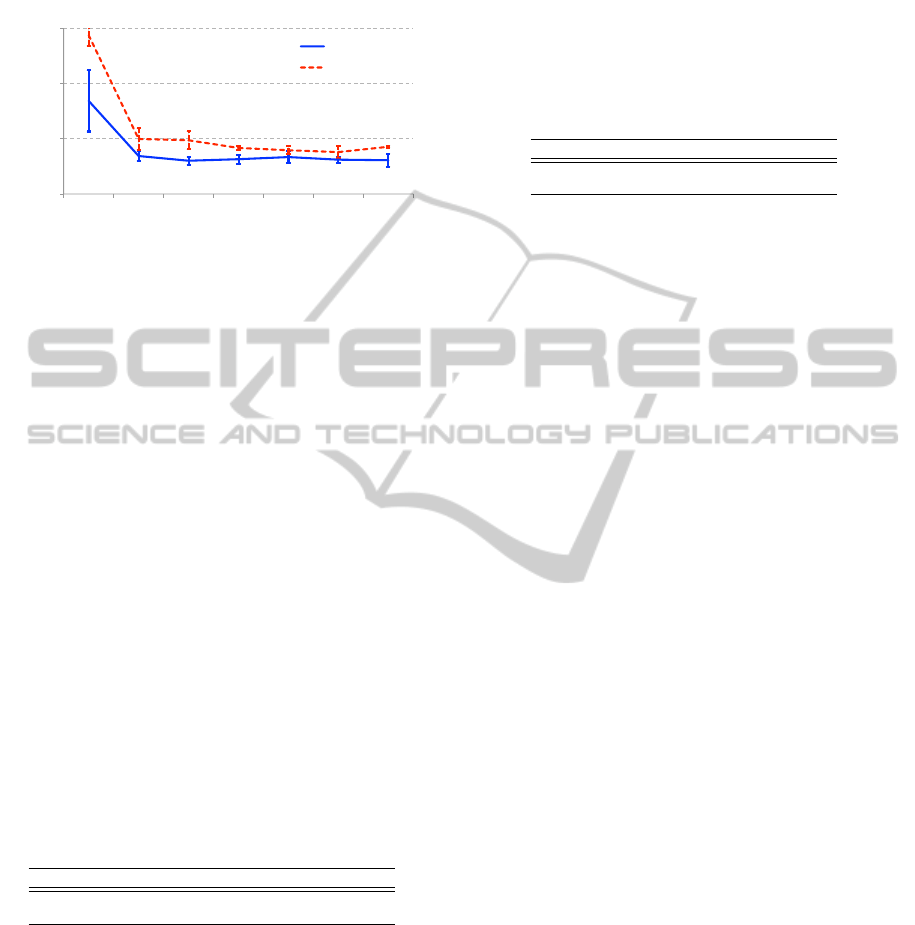
alpha measure (α, equation 1). In Fig. 4, mean α±s.d.
is plotted for each replenishment cycle.
0%#
10%#
20%#
30%#
1#
2#
3#
4#
5#
6#
7#
Smith's(Alpha(
Replenishment(Cycle(
UoB.AA.slow#
UoB.AA.ultra#
Figure 4: Smith’s alpha ± standard deviation.
Fig. 4 shows that under both conditions, alpha
drops quickly after the initial permit-replenishment
cycle and then maintains a consistently low level for
the rest of the experiment. The volatile activity of
the market shortly after opening is a result of traders
probing demand and supply at varying price levels.
Overall, alpha values for AA-slow experiments are
lower than for AA-ultra, suggesting that slow trader-
agents improve market convergence.
Table 2 tabulates the allocative efficiency (equa-
tion 2) of traders. The mean efficiency of trader-
agents, Eff(A), is similar under both conditions. How-
ever, the efficiency of humans, Eff(H), is 6% lower
under condition AA-ultra. Thus, an increase in
agents’ speed leads to a reduction in overall mar-
ket efficiency, Eff(Market). AA-ultra agents achieve
approximately 3% more profit than humans (final
column) while AA-slow agents achieve slightly less
profit than humans. However, this does not imply
that AA-ultra outperform AA-slow but rather that hu-
mans perform more poorly when competing against
the faster trader-agents.
Table 2: Allocative efficiency.
Trials Eff(A) Eff(H) Eff(Market) ∆Profit(A-H)
AA-slow 4 0.957 0.963 0.960 -0.003
AA-ultra 3 0.966 0.906 0.936 0.032
Table 3 displays the profit dispersion (equation 3)
of traders: the deviation of profits about the maximum
theoretical profit. We see that the profit dispersion of
agents is similar under both conditions, however the
profit dispersion of humans and hence the market as
a whole is lower under condition AA-slow. This sug-
gests that AA-ultra fast trader-agents produce greater
deviation in the profits of human competitors; an un-
desirable result.
5 DISCUSSION
As with our analysis of results in De Luca et al.
(2011), here we use the Robust Rank-Order (RRO)
test (Feltovich, 2003) to explore the significance of
the differences between the results from the AA-ultra
experiments and those from AA-slow.
Table 3: Profit dispersion.
Trials Disp(A) Disp(H) Disp(Market)
AA-slow 4 100 164 139
AA-ultra 3 105 236 185
We first explored the scores for Smith’s α metric
(equation 1) over replenishment cycles 2 to 7 of our
experiments (results from the initial Cycle 1 are not
analysed as they do not represent the steady-state be-
haviour of the CDA markets). The outcome of this
sequence of tests was that in each cycle, the α scores
for AA-slow CDA markets were significantly better
(i.e., lower) than those of the AA-ultra CDA markets.
The RRO test gives exact values for p, the confidence
level. In Cycles 2, 3, 4, and 7, the difference was sig-
nificant at p < 2.9%, In Cycle 6, the difference was
significant at p < 5.7%, and in Cycle 5, p < 11.4%.
This is an unequivocal result: in every cycle, the AA-
slow markets give significantly better equilibration re-
sults than the AA-ultra do.
Results for profit dispersion (equation 3) showed
no significant difference between profit dispersion
of agents in AA-ultra and AA-slow markets. How-
ever, for the four AA-slow markets, profit dispersion
for humans was significantly better (i.e., lower) than
those of the AA-ultra markets: p < 11.4%. Fur-
ther, for AA-slow, profit dispersion for the market
as a whole was significantly lower than for AA-ultra:
p < 5.7%.
Finally, we compared overall allocative efficiency
(equation 2) scores for the seven experiments, and
found that the efficiency scores for the four AA-slow
markets were significantly better (i.e., higher) than
those of the AA-ultra markets: p < 2.9%. That is,
when the agents had faster ‘reaction’ times, the mar-
kets were less efficient. In an attempt to understand
why efficiency is better in the AA-slow markets, we
compared the allocative efficiency scores of the AA-
slow trader-agents to those of the AA-ultra trader
agents across our seven experiments. The RRO test
found no significant difference (U = 0.0). Thus, it
seems that in fact altering the reaction-speed of the
trader-agents has no detectable effect (in our seven
experiments, at least) on the efficiency of the trader-
agents themselves.
However, when we used the same test to ex-
plore the efficiency scores of the human traders in
TOO FAST TOO FURIOUS - Faster Financial-market Trading Agents Can Give Less Efficient Markets
133

the seven experiments, we found that the human ef-
ficiency scores were significantly better when they
were trading against AA-slow agents (p < 2.9%).
From this, it is clear that the extra efficiency in
the AA-slow markets is due primarily to the fact that
the human traders are able to trade more efficiently
when the trader-agents’ sleep-cycle is running on
a timescale comparable to the thinking-and-reaction
times of humans.
Exactly why this is so is unclear, but we specu-
late here that it is due to the fact that when the trader-
agents are operating on slow timescales, their actions
in the market can be taken into account by the human
traders, and hence the human’s actions in the markets
is better-informed. When the trader-agents are operat-
ing on superhumanly fast timescales, either their pres-
ence in the markets is so fleetingly brief that they do
not figure in the human’s reasoning process, or possi-
bly their ‘flickering’ in and out of the market’s book
positively confuses the humans. Either way, the ev-
idence we have generated here in our seven experi-
ments involving a total of 42 human subjects points
to the conclusion that, if human traders are active in
the markets, it is better for the overall market if any
trader-agents active at the same time are running at
human-intelligible timescales. However, as markets
homogenise this effect is likely to reduce. If trader-
agents formed a greater proportion of the market, exe-
cuting, say, 90% of all trades, we would expect market
efficiency to increase. Further experiments are needed
to test this hypothesis.
Finally, it is important to note that the results we
have presented here would have been unintelligibly
different if we had used the “traditional” experiment
design where trading is broken into discrete periods
“days”) with full replenishment of maximum liquid-
ity at the start of each “day” and a progressive reduc-
tion in liquidity occurring across each day as traders
transact and drop out of the market, waiting for the
next simultaneous replenishment. If we had used that
traditional design, it is reasonable to expect that in all
the AA-ultra experiments at the start of each day there
would be a sudden flurry of activity where all the AA-
ultra traders quote into the market and transact with
each other where they are able to, all of that taking
place in the first second or two after the start of the
trading “day”, and then for the rest of that day the hu-
mans interact with one another, and/or with any of the
AA-ultras that didn’t manage to trade in the opening
frenzy. This is further, and we hope final, evidence
that it is time for the field to move on from the design
of experiment that Vernon Smith happened to choose
for his experiments reported in his 1962 paper. The
research we conduct in 2012 should aim to model the
real-world markets of 2012, and should avoid recy-
cling an experiment design from half a century ago.
6 CONCLUSIONS
In this paper we have presented results from seven
new experiments where human and software-agent
traders competed against one another in continuous
double auction market experiments, under controlled
laboratory conditions. Building on previous work that
we had published (De Luca & Cliff, 2011a, 2011b;
De Luca et al., 2011), we set out to explore the ex-
tent to which the setting for the “sleep cycle” pa-
rameter, s, affected the dynamics of the market. We
used Vytelingum’s (2006) AA trader-agent strategy
because that had previously been shown to be the
best-performing agent strategy for the CDA (De Luca
& Cliff, 2011b).
We explored a “slow” version of AA for which
s = 10.0 seconds, and an “ultra” fast version for which
s = 0.1 seconds. We ran three experiments involving
humans-vs-AA-ultra, and four evaluating humans-vs-
AA-slow. Each experiment had six human subjects
and six trading agents.
We found no statistically significant difference be-
tween the allocative efficiency scores of the AA-ultra
and AA-slow trader-agents. That is, varying the reac-
tion speed of the AA agents did not appear to affect
their efficiency.
When we compared aggregate market results from
the AA-ultra and AA-slow data-sets, we found a sta-
tistically significant difference in the equilibration be-
haviour, profit dispersion, and also the allocative effi-
ciency scores: all measures were better in the AA-
slow experiments and worse in the AA-ultra experi-
ments; that is, speeding up the agents made the mar-
kets perform worse.
This difference in performance of the two types
of CDA market is attributable to the behaviour of the
humans in the markets: when pitted against AA-slow
agents, humans are more efficient and have lower
profit dispersion than when competing with AA-ultra
agents. We speculate that this is because the humans
can accommodate the actions of the AA-slow agents
when formulating their trading strategies, whereas the
AA-ultra agents operate so fast that they either con-
fuse the humans, or their actions are simply ignored.
The design of our experiments differs from the
“traditional” design that has been used repeatedly for
50 years. In the traditional design, trading is bro-
ken into discrete trading periods with liquidity (stock
and money) replenished to its maximum at the start of
each such period. This is clearly an artificial structure,
ICAART 2012 - International Conference on Agents and Artificial Intelligence
134

unlike the reality of the real-world financial markets.
In the design we used here, there is only one continu-
ous trading period and liquidity is constantly replen-
ished in a drip-feed manner. If we had used the tradi-
tional, unrealistic, experiment design, there are good
reasons to believe that the superiority of slow-trader
markets would simply not have been revealed. Con-
firmation of this, however, will require further com-
parative experiments using the traditional framework.
ACKNOWLEDGEMENTS
Equipment costs for constructing De Luca’s Open Ex-
change (OpEx) system were met by a research grant
from EPSRC made to D. Cliff, number EP/I001603/1.
Primary financial support for D. Cliff’s research
comes from EPSRC grant EP/F001096/1; J. Cartlidge
is supported by EPSRC grant EP/H042644/1; C.
Szostek’s PhD research is funded by EPSRC via
the Bristol Centre for Complexity Sciences. M. De
Luca’s PhD research is partially supported by funds
from the University of Bristol Merchant Venturers’
School of Engineering. Thanks to Syritta Algorith-
mics Ltd for their assistance with funding the rewards
we used as incentives in our experiments. We are ex-
tremely grateful to all the participants of our experi-
ments at the University of Bristol.
REFERENCES
Angel, J., Harris, L., & Spratt, C. (2010). Equity trading in
the 21st century. Commissioned by SEC, UK.
Arthur, W. B. (1993). On designing economic agents that
behave like human agents. Evolutionary Economics,
3, 1–22.
Cliff, D., & Bruten, J. (1997). Minimal-intelligence agents
for bargaining behaviors in market-based environ-
ments. Tech. rep. HPL-97-91, Hewlett-Packard
Labs.
Cliff, D., & Preist, C. (2001). Days without end: On
the stability of experimental single-period continu-
ous double auction markets. Tech. rep. HPL-2001-
325, Hewlett-Packard Labs.
Das, R., Hanson, J., Kephart, J., & Tesauro, G. (2001).
Agent-human interactions in the continuous double
auction. In Nebel, B. (Ed.), 17th Int. Joint Conf. Ar-
tificial Intelligence (IJCAI-01), pp. 1169–1176 Seat-
tle, WA. Morgan Kaufmann.
De Luca, M., & Cliff, D. (2011a). Agent-human interac-
tions in the continuous double auction, redux: Us-
ing the OpEx lab-in-a-box to explore ZIP and GDX.
In Filipe, J., & Fred, A. L. N. (Eds.), 3rd Int. Conf.
Agents and Artificial Intelligence (ICAART-2011),
pp. 351–358 Rome, Italy. SciTePress.
De Luca, M., & Cliff, D. (2011b). Human-agent auction in-
teractions: Adaptive-aggressive agents dominate. In
Walsh, T. (Ed.), 22nd Int. Joint Conf. Artificial Intel-
ligence (IJCAI-11), pp. 178–185 Barcelona, Spain.
AAAI Press.
De Luca, M., Szostek, C., Cartlidge, J., & Cliff, D. (2011).
Studies of interactions between human traders and
algorithmic trading systems. Commissioned as part
of the UK Government’s Foresight Project, The Fu-
ture of Computer Trading in Financial Markets–
Foresight Driver Review–DR 13. Crown Copyright.
Feltovich, N. (2003). Nonparametric tests of differences
in medians: Comparison of the wilcoxon-mann-
whitney and robust rank-order tests. Experimental
Economics, 6, 273–297.
Foresight Project (2011). The future of computer trading in
financial markets: Working paper. UK Government
Office for Science. [Online] Available: http://
www.bis.gov.uk/assets/bispartners/foresight/docs/
computer-trading/11-1276-the-future-of-computer-
trading-in-financial-markets.pdf.
Gjerstad, S., & Dickhaut, J. (1998). Price formation in dou-
ble auctions. Games and Economic Behavior, 22(1),
1–29.
Gomber, P., Arndt, B., Lutat, M., & Uhle, T. (2011). High
frequency trading. Tech. rep., Goethe Universit
¨
at,
Frankfurt Am Main, Germany. Commissioned by
Deutsche B
¨
orse Group.
Grossklags, J., & Schmidt, C. (2003). Artificial software
agents on thin double auction markets: a human
trader experiment. In J. Liu et al. (Ed.), Proc.
IEEE/WIC Conf. Intelligent Agent Technology (IAT
2003), pp. 400–407 Halifax, Canada. IEEE Press.
Grossklags, J., & Schmidt, C. (2006). Software agents and
market (in)efficiency: a human trader experiment.
IEEE Trans. Systems, Man and Cybernetics, Part C
(Applications and Reviews), 36(1), 56–67.
Leinweber, D. (2009). Nerds on Wall Street. John Wiley.
Noriega, P., & Sierra, C. (Eds.). (1999). 1st Int. Workshop
Agent Mediated Electronic Trading (AMET-98), Vol.
1571 of Lecture Notes in Comput. Sci. Springer.
Perez, E. (2011). The Speed Traders. McGraw-Hill.
Smith, V. (1962). An experimental study of comparative
market behavior. J. of Political Economy, 70, 111–
137.
Smith, V. (2006). Papers in Experimental Economics (Re-
vised edition). Cambridge University Press.
Tesauro, G., & Bredin, J. (2002). Strategic sequential bid-
ding in auctions using dynamic programming. In
Castelfranchi, C., & Johnson, W. L. (Eds.), 1st Int.
Joint Conf. Autonomous Agents & Multiagent Sys-
tems, (AAMAS-2002), pp. 591–598 Bologna, Italy.
ACM.
Vytelingum, P. (2006). The Structure and Behaviour of the
Continuous Double Auction. Ph.D. thesis, Sch. Elec-
tron. and Comput. Sci., Univ. Southampton, UK.
Vytelingum, P., Cliff, D., & Jennings, N. (2008). Strate-
gic bidding in continuous double auctions. Artificial
Intelligence, 172, 1700–1729.
TOO FAST TOO FURIOUS - Faster Financial-market Trading Agents Can Give Less Efficient Markets
135
