CATEGORIZATION OF SIMILAR OBJECTS USING BAG OF
VISUAL WORDS AND SUPPORT VECTOR MACHINES
Przemysław G´orecki, Piotr Artiemjew, Paweł Drozda and Krzysztof Sopyła
Department of Mathematics and Computer Sciences, University of Warmia and Mazury, Olsztyn, Poland
Keywords:
Visual dictionaries, Classification, Bag of words, SVM, SIFT.
Abstract:
This paper studies the problem of visual subcategorization of objects within a larger category. Such categoriza-
tion seems more challenging than categorization of objects from visually distinctive categories, previously pre-
sented in the literature. The proposed methodology is based on ”Bag of Visual Words” using Scale-Invariant
Feature Transform (SIFT) descriptors and Support Vector Machines (SVM). We present the results of the ex-
perimental session, both for categorization of visually similar and visually distinctive objects. In addition, we
attempt to empirically identify the most effective visual dictionary size and the feature vector normalization
scheme.
1 INTRODUCTION
This paper is devoted to the problem of generic vi-
sual categorization within the same class of objects.
In particular, the goal is to subcategorize the images
depicting objects which belong to the same high level
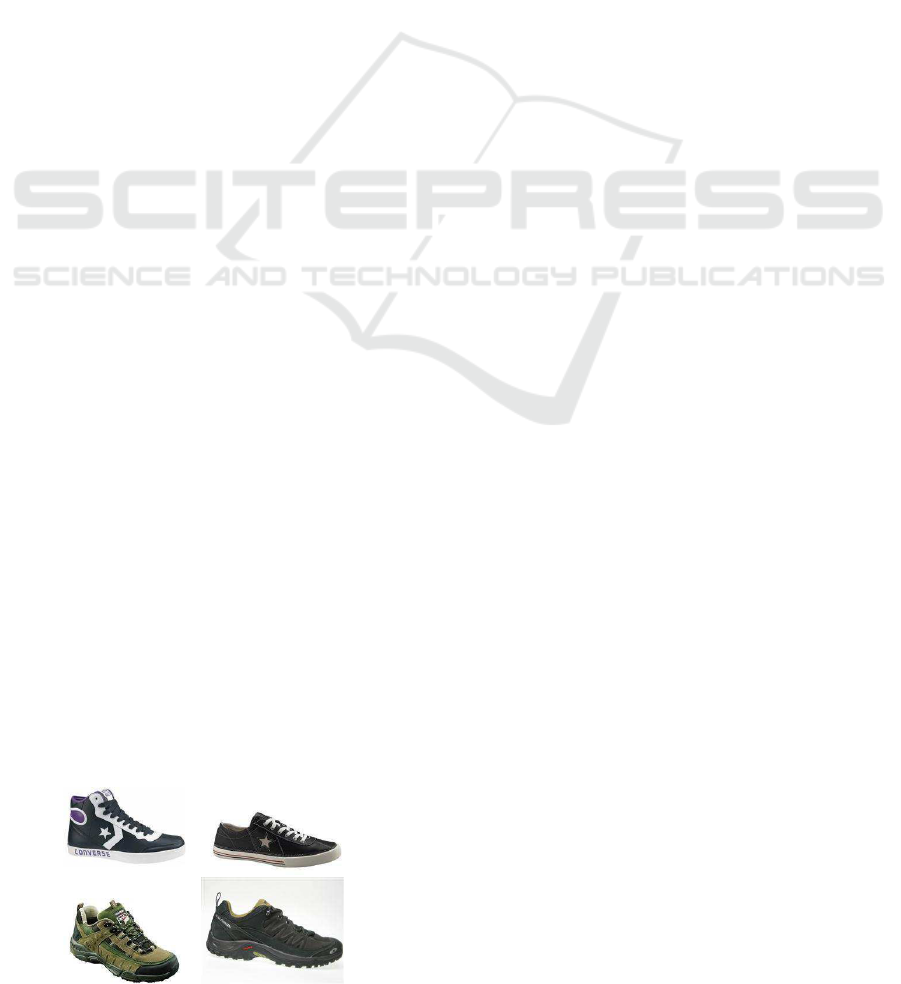
visual category. As an example, let us consider a set
of shoe images, such as those presented in Figure 1.
Then, the objective is to subcategorize the shoe
images by type (i.e. as sneakers or trekking shoes).
It can be noted that although both types of shoes
are generally similar in shape and appearance, human
observers can easily identify many fine details, which
are decisive for categorization.
In recent years, Bag of Visual Words (BoVW)
image representation method has received much at-
tention in solving generic visual categorization prob-
lems (Csurka et al., 2004). The approach is derived
from bag-of-words approach, successively applied in
Figure 1: A sample of shoe images, retrieved from Internet,
that can be subcategorized as sneakers or trekking shoes.
text categorization (Lewis, 1998; Joachims, 1998),
where the idea is to describe the text document using
the frequencies of the words occurrences. The image
can be described in a similar way using the frequently
occurring local image patches, so also known as ’vi-
sual words’.
The first step in representing an image using vi-
sual words is to detect and describe image keypoints
- small image patches that contain relevant local in-
formation about the image. The choice of keypoint
detector is important as it has a significant impact on
the successive phases of the categorization process.
Among many descriptors proposed in the lit-
erature, Scale-Invariant Feature Transform (SIFT)
(Lowe, 2004) and Speeded Up Robust Features
(SURF) (Bay et al., 2008) are reported to be the most
effective, since they provide keypoints invariant to
image rotation, scale, perspective and illumination
changes. For a comprehensive survey of keypoint de-
tectors see (Tuytelaars and Mikolajczyk, 2008; Miko-
lajczyk et al., 2005).
In the next step, a dictionary of visual words
is constructed by means of unsupervised clustering.
Each visual word is a subset of image patches that are
similar to each other. Hence, a visual word represents
some local pattern which is shared across many im-
ages. Typically, k-means algorithm or similar is ap-
plied to build the visual dictionary from image key-
points.
Given the dictionary, the representation of an image
is obtained by assigning its image patches to the cor-
231
Górecki P., Artiemjew P., Drozda P. and Sopyła K..
CATEGORIZATION OF SIMILAR OBJECTS USING BAG OF VISUAL WORDS AND SUPPORT VECTOR MACHINES.
DOI: 10.5220/0003714702310236
In Proceedings of the 4th International Conference on Agents and Artificial Intelligence (ICAART-2012), pages 231-236
ISBN: 978-989-8425-95-9
Copyright
c
2012 SCITEPRESS (Science and Technology Publications, Lda.)

responding visual words and then by building a his-
togram of these words. From this point, the image can
be categorized in a similar way to a text document.
To categorize the images, a multi-class classifier can
be employed, using visual word histograms as feature
vectors (Winn et al., 2005; Csurka et al., 2004; Cai
et al., 2010).
This paper is organized as follows. Section 2 de-
scribes the proposed methodology which consists of
keypoint identification, visual dictionary construction
and categorization using Support Vector Machines
(SVM) (Boser et al., 1992; Chang and Lin, 2011).
Section 3 presents the details of the experimental
sessions. Section 4 concludes the paper.
2 METHODOLOGY
The following section presents the details of the im-
age categorization process, based on BoVW represen-
tation. Our approach consists of three main phases.
Firstly, the SIFT algorithm was applied for key-
point identification in imagery datasets. Secondly,
these keypoints was exploited to create instances of
visual words by means of unsupervised learning tech-
nique.
It was achieved by the k-means clustering al-
gorithm. For each image the vector representation
was obtained with different normalization schemes
and the components of that vector correspond to
”visual words” from dictionary. During the last
phase, datasets were classified by means of the SVM
method.
2.1 Keypoint Identification
For keypoint identification the SIFT algorithm de-
scribed in (Lowe, 2004) was chosen. This method
is proven to be resistant against the changes in image
scale, rotation, illumination and 3D viewpoint (Kleek,
; Mikolajczyk and Schmid, 2005). Regardless of how
the image was transformed, any of the descriptors
found using the SIFT algorithm retains its original
features. This makes it possible to find correspond-
ing points in the images containing similar objects,
but in a different scale, perspective or with different
light intensity.
The process of key point identification is divided
into four phases. Initially, ”Scale-space extrema de-
tection” is performed. In this stage all scales and
image locations are searched for potential interest
points, with the use of a difference-of-Gaussian tech-
nique. In the stage named ”Keypoint localization”,
the keypoint candidates with the worst stability mea-
sure are discarded. During the third phase called ”Ori-
entation assignment”, each keypoint is enriched with
information about its relative orientation based on lo-
cal image gradients. Finally, keypoint descriptors,
which are robust on local distortion and change in il-
lumination, are created from the local image regions
around the keypoints. This phase is called ”Keypoint
descriptor”.
The result of the SIFT algorithm execution is a
set of keypoints which captures important details of
the image. Each keypoint contains information about
scale, orientation and location and its descriptor is
represented as a numerical vector. The size of the vec-
tor is fixed in advance and depends on the choice of
the local region size. The vector usually has 128 di-
mensions, which is determined by the choice of a 4x4
descriptor region. Depending on the image size and
complexity the number of obtained keypoints varies
from a hundred to a few thousand.
2.2 Visual Dictionary Construction
Due to the fact that many keypoints retrieved by the
SIFT algorithm are similar, it’s necessary to gener-
alize and group the points into clusters which repre-
sent ”visual words”. For this purpose, k-means, an
unsupervised learning algorithm, was used due to its
simplicity and satisfactory performance. The idea of
k-means lies in a division of the observation into pre-
defined number of sub-sets, so that the sum of the dis-
tances from each keypoint to the center of particular
cluster is minimized. This can be formalized using
the following formula:
argmin
S
k
∑
i=1
∑
x
j
∈S
i
x
j
− µ
i
2
, (1)
where (x
1
, x
2
, . . . , x
n
) are observation vectors, µ
i
is
mean of i-th centroid and k is the number of clusters.
As a result of clusterization process, k ”visual
words” are obtained, which allows the assignment of
the particular ”visual word” for each descriptor. An
important issue is the choice of parameter k, which
affects the performance and accuracy. If the number
of clusters is too small, the algorithm will assign dis-
tinctive keypoints to the same ”visual word”.
Thus, classification accuracy would be signifi-
cantly reduced. On the other hand, too big k leads
to over-representation, so that similar keypoints are
represented by different ”visual words”, which results
in a decrease of performance and accuracy. Tests for
different values of parameter k were performed, all
details are described in the experimental section.
ICAART 2012 - International Conference on Agents and Artificial Intelligence
232

2.3 Categorization
On the basis of image keypoint assignment to visual
words (clusters), the histogram of incidence is created
for each image from imaginary dataset. As a result, a
k-dimensional feature vector is obtained.
This allows us to unify the representation of the
images, reducing the problem of a visual categoriza-
tion process to a simpler task of feature vector classi-
fication.
However, the results of classification based solely
on the histograms are rarely satisfactory. Therefore,
the different forms of vector normalization and word
weighting can be applied to increase the classifica-
tion accuracy. In this paper, for the feature vector
x = (x
1
, . . . , x
k
), three schemes of normalization are
considered, in particular:
1. Max norm
kxk
∞
= max(|x
1
|, . . . , |x
k
|), (2)
2. Euclidean norm
kxk
2
=
k
∑
i=1
|x
i
|
2
1
2
, (3)
3. Manhattan norm
kxk
1
=
k
∑
i=1
|x
i
|. (4)
The normalized feature vector ˆx is given by:
ˆx =
x
kxk
, (5)
where kxk can be kxk
1
, kxk
2
, kxk
∞
.
The SVM (Boser et al., 1992; Chang and Lin,
2011) was used as a classification method. The SVM
is a binary classifier that searches for the optimal
hyperplane which separates observations from both
classes of training set by solving the quadratic opti-
mization task.
Given a set of instance-label pairs (x
i
, y
i
); i =
1, . . . , l; x
i
∈ R
n
;y
i
∈ {−1, +1}, SVM solves the fol-
lowing dual problem (6) derived from the primal
problem described in (Chang and Lin, 2011):
min
α
1
2
α
T
Qα− e
T
α, (6)
subject to
y
T
α = 0; 0 ≤ α
i
≤ C;i = 1, . . . ,l; (7)
where C > 0 is a penalty parameter that determines
the tradeoff between the margin size and the amount
of error in training, α is a vector of Lagrange mul-
tipliers introduced during conversion form the primal
to dual problem, e is the unit vector, Q is an l by l pos-
itive semidefinite matrix such that Q
ij
= y
i
y
j
K(x
i
, x
j
)
and K(x
i
, x
j
) = φ(x
i
)
T
φ(x
j
) is the kernel function,
which maps training vectors into a higher dimensional
space via function φ.
The problems which are non-linearly separable
can be solved by the SVM using the ”Kernel Trick”.
Apart form the linear, the most frequently used
kernels of the SVM are RBF and polynomial. Dur-
ing the experimental session the RBF kernel (8) was
chosen.
K(x
i
, x
j
) = exp(−γkx
i
− x
j
k
2
), (8)
where x
i
, x
j
are observations and γ > 0.
The label F(x) of the feature vector x can be pre-
dicted using the following equation:
F(x
new
) = sign
l
∑
i=1
y
i
α
i
K(x
i
, x
new
) + b
!
. (9)
The results of the SVM image classification with the
RBF kernel are described in the experimental section.
3 RESULTS OF EXPERIMENTS
The goal of the experimental session was to assess
the performance of the classification of visually sim-
ilar objects compared with the classification of visu-
ally distinctive objects. For this purpose, six datasets
were created by combining images depicting objects
from different visual categories. Each main category
consisted of 60 images downloaded from the Inter-
net. The datasets contained the following categories
of images:
1. tulips vs. roses - 120 images (26368 image key-
points),
2. sneakers vs. trekking boots - 120 images (19499
image keypoints),
3. men’s watches vs. women’s watches - 120 images
(75846 image keypoints),
4. flowers (dataset 1) vs. shoes (dataset 2) - 240 im-
ages (45867 image keypoints),
5. shoes (dataset 2) vs. watches and flowers (datasets
3 and 4) - 360 images (121713 157881 image key-
points),
6. flowers (dataset 1) vs. watches (dataset 3) - 240
images (10214 image keypoints).
The number of images for dataset 1–3 in each class
was even (i.e. dataset 1 contained 60 tulip and 60 rose
images) only dataset 5 contains unbalance number of
the objects in each class (120 vs 240). In addition, an
CATEGORIZATION OF SIMILAR OBJECTS USING BAG OF VISUAL WORDS AND SUPPORT VECTOR
MACHINES
233
50 100 200 500 1000 2000 5000
0.45
0.5
0.55
0.6
0.65
0.7
0.75
0.8
Number of Visual Words
Accuracy
none
man
max
eucl
(a) Classification of tulips vs. roses
50 100 200 500 1000 2000 5000
0.5
0.55
0.6
0.65
0.7
0.75
0.8
0.85
0.9
0.95
Number of Visual Words
Accuracy
none
man
max
eucl
(b) Classification of sneakers vs. trekking boots
50 100 200 500 1000 2000 5000
0.5
0.55
0.6
0.65
0.7
0.75
0.8
0.85
0.9
Number of Visual Words
Accuracy
none
man
max
eucl
(c) Classification of men’s vs. women’s watches
50 100 200 500 1000 2000 5000
0.45
0.5
0.55
0.6
0.65
0.7
0.75
0.8
0.85
0.9
0.95
Number of Visual Words
Accuracy
none
man
max
eucl
(d) Classification of flowers vs. shoes.
50 100 200 500 1000 2000 5000
65
70
75
80
85
90
95
Number of Visual Words
Accuracy
none
man
max
eucl
(e) Classification of shoes vs. watches and flowers.
50 100 200 500 1000 2000 5000
0.4
0.5
0.6
0.7
0.8
0.9
1
Number of Visual Words
Accuracy
none
man
max
eucl
(f) Classification of flowers vs. watches
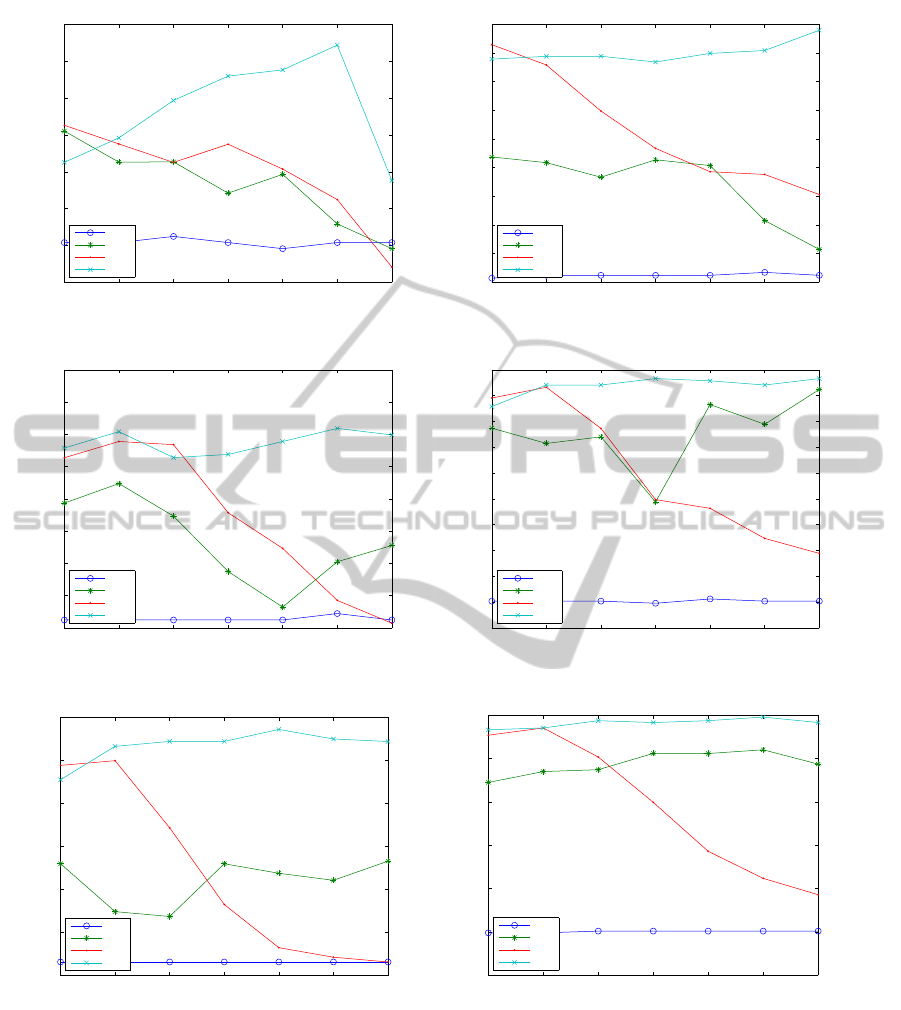
Figure 2: Final classification results for datasets 1 (a) – 6 (f), none = results for none normalization case, man = results for
Manhattan norm, max = results for max norm, eucl = results for Euclidean norm.
overall number of keypoints found by SIFT in each
dataset is reported in parentheses.
For each dataset, the visual dictionary was con-
structed by extracting keypoints from all images in
the dataset using SIFT and by clustering with the use
of k-means, as described in section 2.2. To identify
the most suitable dictionary size, the process of dic-
tionary construction was repeated for the following
values of k: 50, 100, 200, 500, 1000, 2000, 5000.
Additionally, for each of the dictionaries, datasets
were classified using various normalization tech-
niques (described in section 2.3) in order to identify
ICAART 2012 - International Conference on Agents and Artificial Intelligence
234

the most effective one for the categorization task.
SVM with RBF kernel (with defaults parameters)
was employed to classify the datasets. The accuracy
of the classification was estimated using 5-fold cross
validation. The results of the classification for all
datasets and all metrics, as well as none metric case,
are presented in Figure 2, which shows the depen-
dence between number of visual words and classifi-
cation accuracy.
It can be noted that the Euclidean normaliza-
tion outperforms all other normalization techniques in
terms of classification accuracy, especially for a big-
ger dictionary sizes from the interval[200, 5000]. The
exception to that rule is a fully comparable result for
200 visual words of max norm in case of classifying
men’s vs womens’s watches - see (c) in Figure 2. For
a smaller size of dictionary in range of 50,100 visual
words, max and Euclidean normalization works fully
comparable.
Detailed classification results for our best Eu-
clidean normalization are presented in Tables 1 and
2. Interestingly, when feature vectors are not normal-
ized, the classification is completely ineffective since
an average accuracy is close to 50%.
Table 1: Final classification results for datasets 1–3 using
Euclidean normalization.
No. of visual words
Dataset
1 2 3
50 61.27% 88.92% 77.88%
100 64.60% 89.40% 80.41%
200 69.67% 89.42% 76.40%
500 72.97% 88.41% 76.88%
1000 73.80% 89.91% 78.90%
2000 77.17% 90.42% 80.92%
5000 58.80% 93.95% 79.91%
Table 2: Final classification results for datasets 4–6 using
Euclidean normalization.
No. of visual words
Dataset
4 5 6
50 87.89% 87.75% 96.65%
100 92.05% 91.63% 97.70%
200 92.06% 92.2% 98.74%
500 93.30% 92.2% 98.32%
1000 92.87% 93.59% 98.74%
2000 92.05% 92.48% 99.58%
5000 93.30% 92.19% 98.32%
Regarding the most suitable dictionary size, for
most cases where k = 2000, the accuracy of classi-
fication is the highest for datasets 1, 3 and 6. It can
be noted that, for visually distinctive objects (datasets
4–6), the choice of k is not that important - any dictio-
nary larger than 500 visual words seems reasonable.
In contrast, for visually similar objects (datasets 1–3),
the most optimal dictionary size is 2000 words.
To compare classification results between visually
similar and distinctive datasets, k = 2000 and Eu-
clidean normalization were chosen. For this case, an
average classification accuracy for datasets 1–3 was
82.84% and an average classification accuracy for
datasets 4–6 was 96.37%. As expected, the classifi-
cation of visually similar objects turned out be more
challenging compared to visually distinctive ones,
and in our case the difference in classification accu-
racy was 13.53%.
4 CONCLUSIONS AND FUTURE
WORK
The main aim of the article was to compare classifi-
cation images belonging to the same domain and im-
age classification from various categories by means
of ”Bag of Visual Word” technique. The obtained re-
sults show that the former problem is harder to solve
and in the majority of cases classification accuracy is
lower than in the latter. In addition, studies on the im-
pact of the number of ”visual words” in dictionary on
the accuracy of classification were undertaken. Tak-
ing into account the tradeoffbetween the performance
and effectiveness, the optimal results for 2000 ”visual
words” were obtained for all datasets. However, for
these datasets with visual distinctive objects, the sat-
isfactory results were achieved using at least 500 ”vi-
sual words”. Additionally, the best method of normal-
ization among those studied in terms of classification
accuracy proved to be Euclidean normalization.
Bag of visual words opens up opportunities for
taking some techniques from classic Information Re-
trieval discipline, especially the variousmechanism of
dictionary building and the term weighting methods,
which we plan to investigate. Moreover, in the future
we are going to pay more attention to the spatial im-
age feature correlation and its impact on classification
accuracy.
ACKNOWLEDGEMENTS
The research has been supported by grant N N516
480940 from The National Science Center of the Re-
public of Poland.
CATEGORIZATION OF SIMILAR OBJECTS USING BAG OF VISUAL WORDS AND SUPPORT VECTOR
MACHINES
235

REFERENCES
Bay, H., Ess, A., Tuytelaars, T., and Van Gool, L. (2008).
Speeded-up robust features (surf). Comput. Vis. Image
Underst., 110:346–359.
Boser, B. E., Guyon, I. M., and Vapnik, V. N. (1992). A
training algorithm for optimal margin classifiers. In
Proceedings of the fifth annual workshop on Compu-
tational learning theory, COLT ’92, pages 144–152,
New York, NY, USA. ACM.
Cai, H., Yan, F., and Mikolajczyk, K. (2010). Learning
weights for codebook in image classification and re-
trieval. In CVPR, pages 2320–2327. IEEE.
Chang, C.-C. and Lin, C.-J. (2011). LIBSVM: A library
for support vector machines. ACM Transactions on
Intelligent Systems and Technology, 2:27:1–27:27.
Csurka, G., Dance, C. R., Fan, L., Willamowski, J., and
Bray, C. (2004). Visual categorization with bags of
keypoints. In In Workshop on Statistical Learning in
Computer Vision, ECCV, pages 1–22.
Joachims, T. (1998). Text categorization with support vec-
tor machines: learning with many relevant features. In
N´edellec, C. and Rouveirol, C., editors, Proceedings
of ECML-98, 10th European Conference on Machine
Learning, number 1398, pages 137–142. Springer
Verlag, Heidelberg, DE.
Kleek, M. V. Evaluating the stability of sift keypoints across
cameras.
Lewis, D. D. (1998). Naive (bayes) at forty: The indepen-
dence assumption in information retrieval. pages 4–
15. Springer Verlag.
Lowe, D. G. (2004). Distinctive image features from scale-
invariant keypoints. Int. J. Comput. Vision, 60:91–
110.
Mikolajczyk, K., Leibe, B., and Schiele, B. (2005). Lo-
cal Features for Object Class Recognition. In Tenth
IEEE International Conference on Computer Vision
(ICCV’05) Volume 1, pages 1792–1799. IEEE.
Mikolajczyk, K. and Schmid, C. (2005). A perfor-
mance evaluation of local descriptors. IEEE Trans-
actions on Pattern Analysis & Machine Intelligence,
27(10):1615–1630.
Tuytelaars, T. and Mikolajczyk, K. (2008). Local invariant
feature detectors: a survey. Found. Trends. Comput.
Graph. Vis., 3:177–280.
Winn, J., Criminisi, A., and Minka, T. (2005). Object cat-
egorization by learned universal visual dictionary. In
Proceedings of the Tenth IEEE International Confer-
ence on Computer Vision - Volume 2, ICCV ’05, pages
1800–1807, Washington, DC, USA. IEEE Computer
Society.
ICAART 2012 - International Conference on Agents and Artificial Intelligence
236
