
SEGMENTATION AND ANALYSIS OF RETINAL VASCULAR TREE
FROM FUNDUS IMAGES PROCESSING
Sandra Morales
1
, Valery Naranjo
1
, Jes
´
us Angulo
2
, Juan Jos
´
e Fuertes
1
and Mariano Alca
˜
niz
1,3
1
Instituto Interuniversitario de Investigaci
´
on en Bioingenier
´
ıa y Tecnolog
´
ıa Orientada al Ser Humano
Universitat Polit
`
ecnica de Val
`
encia, I3BH/LabHuman, Camino de Vera s/n, 46022 Valencia, Spain
2
Centre de Morphologie Math
´
ematique, Math
´
ematiques et Syst
`
emes, MINES Paristech, Paris, France
3
Ciber, Fisiopatolog
´
ıa de Obesidad y Nutrici
´
on (CB06/03), Instituto de Salud Carlos III, Madrid, Spain
Keywords:
Retinal vessel segmentation, Retinal vascular tree, Vessel caliber, Bifurcation angle.
Abstract:
From a fundus image, the system proposed in this paper automatically detects retinal vessels and measures
some geometrical properties on them such as caliber and bifurcation angles. Its goal is to establish objective
relations between different vessels, thus being able to determine cardiovascular risk or other diseases, as well
as to monitor their progression and response to different treatments. The proposed approach is mainly based on
mathematical morphology although also incorporates curvature evaluation for the detection of retinal vascular
tree. This method has been validated on a public database improving the results of previous published methods.
1 INTRODUCTION
Retinal vasculature is able to indicate the status of
other vessels of the human body. Classically, its study
is included in the standard screening of any patients
with cardiovascular risk and other diseases in which
the vessels may be altered inasmuch as it is a non-
invasive or minimally invasive procedure.
Nowadays, due to high resolution of digital fun-
dus images, they can be automatically processed pro-
viding invaluable help to clinicians in diagnosis and
disease prevention. Specifically, a system capable of
detecting the retinal vessels and measuring some geo-
metrical properties has been developed from a fundus
image. Vascular changes produced in systemic dis-
eases usually induce particular modifications in the
vessels, such as changes in the angle of intersection
between arteries and veins, and changes in the vessel
calibers. Based on these facts, the goal of the pro-
posed system is to establish objective relations be-
tween the different vessels, to determine cardiovas-
cular risk or other diseases, as well as to monitor
progress and response to different treatments. This
tool has been initially applied in a study carried out
by the Department of Pediatrics of General Hospital
of Valencia about the retinal microvascular architec-
ture of children with low birthweight, analyzing the
relationship between the measurements obtained in
these children and diseases such as hypertension and
cardiovascular problems in adult life, thus using their
results as a prognostic marker for this type of pathol-
ogy.
At first, a segmentation process to characterize
any retinal morphological changes is necessary. Af-
terwards, detected vessels must be labeled as a means
to be able to perform desired measures on them and
to quantify these changes.
The mainly methodology proposed in this paper
is, above all, focused on mathematical morphology
although also incorporates curvature evaluation to get
a correct detection of retinal vascular tree.
2 SEGMENTATION METHOD
Although fundus images are RGB images, in the
present work we draw on monochrome images ob-
tained from the green band which provides a im-
proved visibility of retinal blood vessels.
The segmentation method presented in this paper
is based on mathematical morphology and curvature
evaluation for the detection of retinal vascular tree.
Mathematical morphology (Soille, 2003) is a non-
linear image processing methodology based on min-
imum and maximum operations whose aim is to ex-
tract relevant structures of an image. This is achieved
by probing the image with another set of known shape
321
Morales S., Naranjo V., Angulo J., José Fuertes J. and Alcañiz M..
SEGMENTATION AND ANALYSIS OF RETINAL VASCULAR TREE FROM FUNDUS IMAGES PROCESSING.
DOI: 10.5220/0003704603210324
In Proceedings of the International Conference on Bio-inspired Systems and Signal Processing (BIOSIGNALS-2012), pages 321-324
ISBN: 978-989-8425-89-8
Copyright
c
2012 SCITEPRESS (Science and Technology Publications, Lda.)
called structuring element (SE).
First, a small opening, using a disc of radius 1 as
SE, is performed on the enhanced green component
image to fill in any gaps of the vessels which could
provoke errors in segmentation. To enhance the image
a local shade correction (Walter and Klein, 2002) is
applied.
Then, a dual top-hat, with a SE larger than the
biggest vessel, is applied with the goal of extracting
all of them and eliminating structures with high cur-
vature that are not vessels, as occurs in the optic disc.
After that, to highlight the vessels on the back-
ground, the next steps are followed. Principal curva-
ture is calculated as the maximum eigenvalue of the
Hessian matrix (Martinez-Perez et al., 2007). Subse-
quently, a linear opening by reconstruction is applied
to reconstruct the principal curvature from a supre-
mum of openings which were calculated using a line
of size 31 as SE every 15
◦
. This operation removes
any structure smaller than this SE in any orientation
obtaining a cleaner background.
Finally, to binarize the resulting image a k-means
clustering (MacQueen, 1967) is used with a k value
equals to 3. Two of the three obtained clusters are
defined as vessel. Three classes are requiered because
thick and thin vessels can be very different.
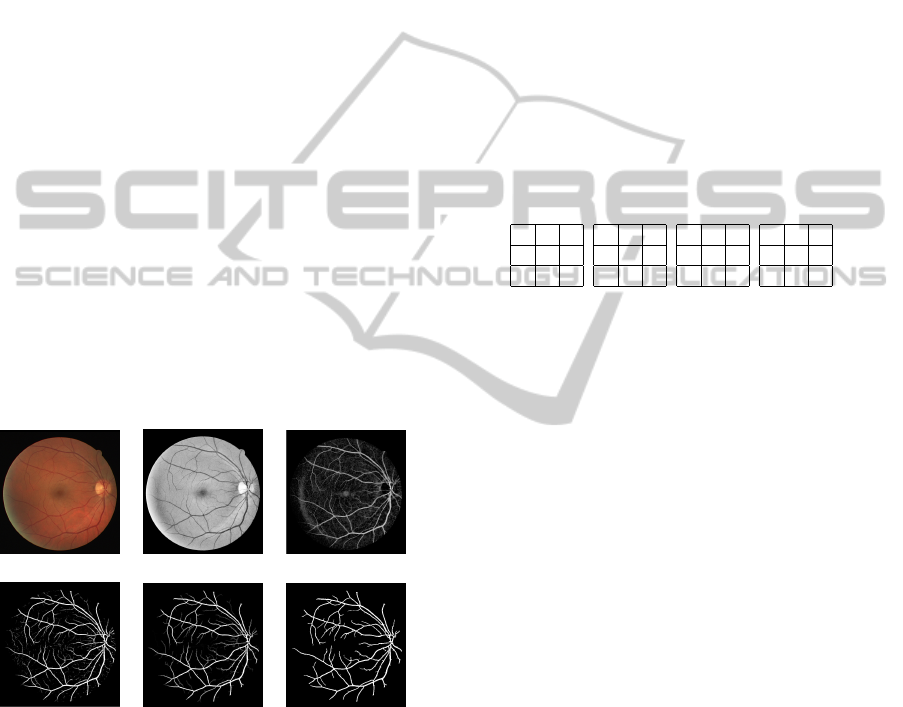
Figure 1 shows the resulting images of the men-
tioned method.
(a) (b) (c)
(d) (e) (f)
Figure 1: Segmentation steps: (a) Original fundus image,
(b) Green component enhancement, (c) Dual top-hat filter-
ing, (d) Principal curvature, (e) Opening by reconstruction
and (f) k-means clustering (segmented image).
3 RETINAL TREE LABELING
Retinal vascular tree labeling is focused on obtain-
ing the skeleton of vascular tree, detecting significant
points and a tracking process.
The skeleton of the vascular tree is obtained by
a thinning process from the segmented binary image
(Soille, 2003). After, a pruning process is applied to
eliminate possible spurs and to avoid multiple paths
that are inherent in a 8-connected boundary.
In a vascular tree skeleton there are three types of
significant points and all of them must be detected:
terminal, bifurcation and crossing points (Martinez-
Perez et al., 2002). To locate the terminal and bifur-
cation points the hit-or-miss transform is utilised. The
hit-or-miss transform is a binary morphological oper-
ation that can be used to look for particular patterns
in an image (Soille, 2003). Figure 2 shows the SEs
used to detect these points on a skeleton. 1’s define
the set of pixels that should match the foreground and
0’s the background. Notice that all of them must be
used in all its orientations, one every 90
o
. On the other
hand, to detect the crossing points it will be necessary
a manual intervention due to there are some of them
that are incorrectly defined as bifurcation points.
1
0 1
1 0 1
(a)
1
1
1 0 1
(b)
1
1 1
1
(c)
0 1 0
0 0 0
(d)
Figure 2: Structuring elements used to detect significant
points: (a-c) bifurcation points and (d) terminal points.
The tracking purpose is to analyze the direction of
every pixel of the skeleton and to identify which pix-
els belong to each branch. The method used is pro-
posed in (Martinez-Perez et al., 2002). The algorithm
is able to specify the direction of any skeleton point
from a starting point. In order to keep the relation in-
formation between the branches, a determinated num-
bering scheme is employed.
4 GEOMETRIC MEASURES
Certain geometric measurements of blood vessels can
help to establish whether they have undergone mor-
phological changes over time and facilitate diagnose
illness. We focus on next parameters due to the fact
that they have particular interest for the early hyper-
tension detection:
Vessel Caliber. Is equal to two times the average of the
geodesic distance calculated from the skeleton points
of the branch to the edge of the corresponding vessel.
(3a).
Bifurcation Angle. Angle formed by the daughter
branches for each bifurcation point. The branches are
fitted for straight lines by least-squares into a circular
window centered on these points (3b).
BIOSIGNALS 2012 - International Conference on Bio-inspired Systems and Signal Processing
322

(a) (b)
Figure 3: Measures: (a) Caliber and (b) Bifurcation angles.
5 RESULTS
To validate the segmentation, our method results
have been compared with a public database of hand-
segmented images. In DRIVE database (Staal et al.,
2004) original images and the images manually seg-
mented by two different specialists are included. The
first-observer images are taken as reference (gold
standard) to calculate similarity degree between them
and our segmentation. The segmented images by the
second observer also has been compared with the gold
standard in order to note that there are also differences
between both experts.
The performance of the method has been evalu-
ated based on three concepts: accuracy (Ac) and true
positive (TPF) and false positive (FPF) fractions. In
table 1 these results can be observed. In summary, the
average values obtanained by the proposed method
are: Ac=0.9417, TPF=0.6570 and FPF=0.0166.
On the other hand, in (Niemeijer et al., 2004) a
study about the accuracy of different vessel segmen-
tation methods was carried out on the same database.
This study compared several approaches: matched fil-
ter (Chaudhuri et al., 1989), scale-space analysis and
region growing (Martinez-Perez et al., 1999), math-
ematical morphology and curvature estimation (Zana
and Klein, 2001), verification-based local threshold-
ing (Jiang and Mojon, 2003) and pixel classification
(Niemeijer et al., 2004). Table 2 shows a comparison
between the aforementioned methods and ours.
We can conclude that our method has achieved a
higher accuracy ratio and its false positive fraction is,
even, lower than the second observer fraction.
Table 1: Comparison between the results of the proposed
method and the 2
nd
observer (average values and standard
deviations) regarding the gold standard.
Proposed method 2
nd
observer
Ac 0.9417 (0.0076) 0.9473 (0.0048)
TPF 0.6570 (0.0668) 0.7757 (0.0596)
FPF 0.0166 (0.0093) 0.0275 (0.0083)
Table 2: Accuracy (average and standard desviation) of sev-
eral methods on the same public database.
Ac
Proposed method 0.9417 (0.0076)
2
nd
observer 0.9473 (0.0048)
(Niemeijer et al., 2004) 0.9416 (0.0065)
(Zana and Klein, 2001) 0.9377 (0.0077)
(Jiang and Mojon, 2003) 0.9212 (0.0076)
(Martinez-Perez et al., 1999) 0.9181 (0.0240)
(Chaudhuri et al., 1989) 0.8773 (0.0232)
6 COMPARISON WITH OTHER
METHODS
In the literature there are numerous techniques for
the extraction of blood vessels, but not too focused
on the extraction of retinal vessels. Most edge de-
tection algorithms assess changes between pixels val-
ues by calculating image gradient magnitude and
then it is thresholded to create a binary edges im-
age (Martinez-Perez et al., 2007; Jiang and Mojon,
2003). Matched filters are filters rotated in differ-
ent directions in order to identify the cross section
of blood vessels (Hoover et al., 2000).Artificial neu-
ral networks use a ”weight” to determine probability
that some input data belonging to a particular output;
this system must be adjusted using known output data
(Sinthanayothin et al., 1999). Morphological pro-
cessing exploits vessels characteristics known a priori
(line connected segments) and combines morpholog-
ical operators to achieve the segmentation (Zana and
Klein, 2001; Walter and Klein, 2002).
Techniques based on edge detectors lack of
strength in distinguishing which are desired edges and
which are not, in our case, vessels and optic disc.
Matched filters have difficulty adapting to changes in
width and orientation of vessels. Techniques focused
on neural network are difficult to automate for any
image and need a lot of training images. And mor-
phological processing runs the risk of fragmenting the
vessels.
7 CONCLUSIONS AND FUTURE
WORK
From a fundus image, the implemented system auto-
matically detects blood vessels of a specific region of
the image. Moreover, it allows to measure bifurca-
tion angles found and to select branches to know their
caliber after a manual intervention, in case it was nec-
essary. These data facilitate expert medical diagnosis
SEGMENTATION AND ANALYSIS OF RETINAL VASCULAR TREE FROM FUNDUS IMAGES PROCESSING
323

and study of the progression of a disease.
The method proposed for the segmentation takes
advantage of some of the techniques mentioned in
the previous section, besides new contributions, to
achieve the correct segmentation and to avoid the dis-
advantages of using them separately. Specifically, it
is based mainly on morphological operators but also
used principal curvature information, allowing an en-
hanced detection of the vessels on to the background
of the image. This algorithm has been compared with
several methods and, apart from improving the accu-
racy ratio, it must be stood out that the optic disc edge
is not detected as vessel unlike the most edge detec-
tion methods. Figure 4 shows our method along with
the proposed in (Martinez-Perez et al., 2007). The
non-detection of this feature is crucial to avoid multi-
ple errors in the tracking process.
(a) (b) (c)
Figure 4: Segmentation comparison: (a) Proposed method,
(b) (Martinez-Perez et al., 2007) method and (c) Manually
segmented image belonging to the DRIVE database.
On the other hand, the included measures are ac-
curate and reliable but also dependent on a correct
image analysis and rectification of some significant
points by the user.
About future work lines, a clinical validation will
be carried out to determine the specificity of the sys-
tem to distinguish between healthy and ill patients.
Afterwards, the method will be applied to analyze
the retinal microvascular architecture of children with
low birthweight and to use it as a prognostic marker
of cardiovascular risk.
ACKNOWLEDGEMENTS
This work has been funded by the project IMIDTA/
2010/47 and partially by projects Consolider-C
(SEJ2006-14301/PSIC), ”CIBER of Physiopathology
of Obesity and Nutrition, an initiative of ISCIII” and
Excellence Research Program PROMETEO (Gener-
alitat Valenciana. Conselleria de Educaci
´
on, 2008-
157). We would like to express our deep gratitude
to Imex Clinic S.L., the Department of Pediatrics of
General Hospital of Valencia and the Fundaci
´
on Of-
talmol
´
ogica del Mediterr
´
aneo for its participation as
well as the DRIVE database.
REFERENCES
Chaudhuri, S., Chatterjee, S., Katz, N., Nelson, M., and
Goldbaum, M. (1989). Detection of blood vessels in
retinal images using two-dimensional matched filters.
Medical Imaging, IEEE Transactions, 8(3):263 –269.
Hoover, A., Kouznetsova, V., and Goldbaum, M. (2000).
Locating blood vessels in retinal images by piecewise
threshold probing of a matched filter response. IEEE
Transactions on Medical Imaging, 19:203–210.
Jiang, X. and Mojon, D. (2003). Adaptive local threshold-
ing by verification-based multithreshold probing with
application to vessel detection in retinal images. IEEE
Trans. Pattern Anal. Mach. Intell., 25:131–137.
MacQueen, J. B. (1967). Some methods for classification
and analysis of multivariate observations. In Proc. of
the fifth Berkeley Symposium on Mathematical Statis-
tics and Probability, volume 1, pages 281–297.
Martinez-Perez, M., Hughes, A., Stanton, A., Thom, S.,
Bharath, A., and Parker, K. (1999). Retinal blood
vessel segmentation by means of scale-space analy-
sis and region growing. In Medical Image Comput-
ing and Computer-Assisted Intervention MICCAI 99,
volume 1679 of Lecture Notes in Computer Science,
pages 90–97.
Martinez-Perez, M. E., Hughes, A. D., Stanton, A. V.,
Thorn, S. A., Chapman, N., Bharath, A. A., and
Parker, K. H. (2002). Retinal vascular tree morphol-
ogy: A semi-automatic quantification. In Biomedical
Engineering, volume 49.
Martinez-Perez, M. E., Hughes, A. D., Thom, S. A.,
Bharath, A. A., and Parker, K. H. (2007). Segmen-
tation of blood vessels from red-free and fluorescein
retinal images. Medical Image Analysis, 11:47–61.
Niemeijer, M., Staal, J., van Ginneken, B., Loog, M., and
Abramoff, M. (2004). Comparative study of retinal
vessel segmentation methods on a new publicly avail-
able database. In SPIE Medical Imaging, volume
5370, pages 648–656.
Sinthanayothin, C., Boyce, J. F., Cook, H. L., and
Williamson, T. H. (1999). Automated localisation of
the optic disc, fovea, and retinal blood vessels from
digital colour fundus images. British Journal of Oph-
thalmology, 83:902–910.
Soille, P. (2003). Morphological Image Analysis: Prin-
ciples and Applications. Springer-Verlag New York,
Inc., 2nd edition.
Staal, J., Abrmoff, M. D., Niemeijer, M., Viergever, M. A.,
and Ginneken, B. V. (2004). Ridge-based vessel seg-
mentation in color images of the retina. IEEE Trans-
actions on Medical Imaging, 23:501–509.
Walter, T. and Klein, J. (2002). A computational approach
to diagnosis of diabetic retinopathy. In 6th Conference
on Systemics, Cybernetics and Informatics (SCI).
Zana, F. and Klein, J. C. (2001). Segmentation of vessel-
like patterns using mathematical morphology and cur-
vature evaluation. IEEE Transactions on Image Pro-
cessing, 10:1010–1019.
BIOSIGNALS 2012 - International Conference on Bio-inspired Systems and Signal Processing
324
