
Perspectives of Internet based Road Network Traffic
Flow Modelling and Control
Apostolos Kotsialos
School of Engineering and Computing Sciences, Durham University
South Road, Durham, DH1 3LE, U.K.
Abstract. This paper is concerned with possible future internet applications
within the framework of traffic flow modelling and control. Two modelling re-
lated uses are described based on the assumption that vehicles in the near future
will be equipped with smart on-board devices that can communicate with each
other through reliable ad-hoc wireless networks. This capability opens new ways
of thinking about traffic flow and requires the explicit consideration of the drivers’
behaviour when more information is available to them pertaining to downstream
traffic conditions. Finally, a web-based application for supporting ramp metering
is discussed as well.
1 Introduction
The ubiquitous traffic light is probably the most important device related to road traffic
control. It was introduced at the beginning of the 20th century for improving the safety
of road junctions, by giving right of way to passing vehicles. A century later and with
the advent of transport telematics, the traffic light and its operation is still a hot topic
of research. The scope of course is much wider now, but the simple fact remains that
a device introduced a hundred years ago is still the effector of our most sophisticated
traffic control strategies. Why has this simple device endured a century of use? The
reason is that it is a simple and effective means of communication, highly tuned to
human cognition norms.
The advent of the internet and wireless communication networks has brought for-
ward a new communications medium which interfaces both with transport units/infra-
structure and drivers. Personalised devices are increasingly becoming connected and in-
teractive getting access in diverse databases and having significant computation power
for data processing and decision making support. This personalised device, in the form
of GPS, smartphones, tablets etc, can now become the new traffic control sensor and
effector. This technology has the potential to become the new “traffic light” and in that
sense the new Variable Speed Limit (VSL) sign and Variable Message Sign (VMS) as
well. The added feature is the personalised information and the custom demand for traf-
fic control decisions on the vehicle level. With the exception of special types of vehicles
(ambulances, buses etc) it is difficult for the traffic light at a junction to be aware of each
of the queued vehicles needs, as at most there can be some OD information estimate
available. Personalised devices can communicate this information effectively pre-trip
Kotsialos A. (2011).
Perspectives of Internet based Road Network Traffic Flow Modelling and Control.
In Proceedings of the 1st International Workshop on Future Internet Applications for Traffic Surveillance and Management, pages 55-66
DOI: 10.5220/0004473100550066
Copyright
c
SciTePress

and en-route. This gives rise to a whole new range of traffic control strategies which go
beyond the minimisation of an aggregate control objective, and go to the custom made
individual and collective traffic management decisions. Important questions regarding
the level of aggregation and emergent traffic flow behaviour need to be posed and an-
swered. Hence, for traffic control purposes, the internet can be viewed as an additional
extra system layer added to the classical Infrastructure-Vehicle-Driver (IVD) transport
system. The internet and wireless communication technologies facilitate the addition of
Information in that triplet, i.e. the IVD-Information (IVDI) transport system.
This calls for a revision of traffic flow models both at the micro and the macro
(hence also at the meso) level and that should be fed to traffic surveillance and control
applications. Traffic flow models should include information in a more fundamental and
structured way as one of the constituent elements of traffic. Especially Model Predictive
Control (MPC) for integrated control measures in mixed corridors, has to gain a lot in
terms of efficiency from this revision. Thus, the internet calls for a new generation of
traffic controllers over wide mixed corridors where information is a system component,
rather than an external input.
As connectivity becomes an essential and widely adopted feature of our societies,
similar to water and electricity network access, internet access for drivers, vehicles and
on-board devices will become the norm. We can envisage a distributed virtual traf-
fic control centre spread over wide geographic areas using robust, highly reliable and
redundant communications networks, and mobile computing power to support traffic
management in terms of surveillance and control. This can be achieved by adopting
hierarchical, decentralised and peer-to-peer architectures using networks of sensors and
also notions of networked control over limited bandwidth communication channels.
Hopefully, this effort will result to the introduction of new notions, ideas, concepts and
technologies that will last for the good part of this century.
This paper is structured as follows. Section 2 provides a brief overview of some
ideas about ways of using the internet for traffic modelling and control purposes. Sec-
tion 3 describes a possible application affecting microscopic car following dynamics;
macroscopic modelling is discussed in section 4. Section 5 discusses the use of web-
based applications affecting driver departure in support of ramp metering operations.
Section 6 concludes this paper.
2 Internet based Applications for Traffic Management
The internet is a diverse network of clients and servers communicating using different
protocols. Its most important feature is the networked structure supporting its robust-
ness. Within the framework of traffic management systems, the most obvious use of
internet for surveillance and control purposes is exploitation of the information dissem-
ination potential of cyber space. In this case, the general model is that of a driver receiv-
ing information and responding to it. The informed drivers make their choices based on
this, something which may be viewed as a limiting factor to the application of control
measures. Indeed, the prevailing paradigm with respect to traffic control applications is
that of a TCC being responsible for the operation of compulsory control measures in an
effort to regulate some crucial traffic variable(s). Responsibility and liability for these
56

operations are placed on the traffic authority. Drivers are required to comply with the
control measures’ operational decisions, e.g. in case of ramp metering they have to wait
at the on-ramp until they get a green light to enter into the mainstream; in case of com-
pulsory variable speed limits, they must observe the speed limit communicated to them.
The scope of internet based applications in this framework is limited as it is defined by
the needs of the information/communication infrastructure and software development.
However, there are other possibilities worth exploring by changing the way traffic
control measures operate. High connectivity and real-time information may be used for
designing the traffic control operations. This can be done by means of timely delivery
of information allowing or motivating drivers to behave in such ways as to optimise the
traffic flow process. This requires accepting the fact that drivers are intelligent agents
able to operate efficiently in changing environmental conditions. Hence, a new type
of control approach can be envisaged, that assigns more emphasis on driver behaviour
rather than just TCC issued compulsory suggestions or actions. Thus, information as
disseminated by internet based applications can be considered as a structural element
of modelling and control design of road network traffic.
The key feature in this approach is the support of emergence, i.e. the process by
which a desired global road network-wide macro-state emerges from the application
of local interactions in the micro-state. This is a potential of information intensive ap-
plications that needs to be tapped. By informing drivers with the appropriate pieces of
information individual decision making and driver behaviour can be steered towards es-
tablishing a desired global state. This scenario supports the “informed drivers” who are
responsible for their own decision; the traffic authority is responsible for facilitating the
efficient and reliable collection and dissemination of information, and the maintenance
of this infrastructure, rather than the control measures’ decision making.
Different applications can be envisaged based on this approach. Three such scenar-
ios are discussed here. The first one is based on classical microscopic car-following
dynamics. The second, is a comment on the analysis of macroscopic dynamics based
on non-local information. Finally, a third one is concerned with the possibility of using
the internet for managing the demand in conjunction with ramp metering.
3 Changing the Car-following Dynamics
In this section a possible application of ad-hoc wireless networks [1] is considered
for changing the behaviour of a traffic stream towards more efficient use of the road
capacity.
Let us consider a homogeneous traffic stream moving along a single-lane motorway
as shown in Figure 1, [2], [3], [4]. Modelling of this stream on the microscopic level
is usually done by considering the car-following dynamics theory developed in the 50s
and 60s. One of the most common general family of model are those developed by Gen-
eral Motors (GM) researchers and are based on the stimuli-response driver behaviour
description. In these models, drivers respond to external stimuli and the response is a
function of the drivers’ sensitivity and the stimuli’s strength, i.e.
response = f (driver sensitivity, stimulus strength) . (1)
57
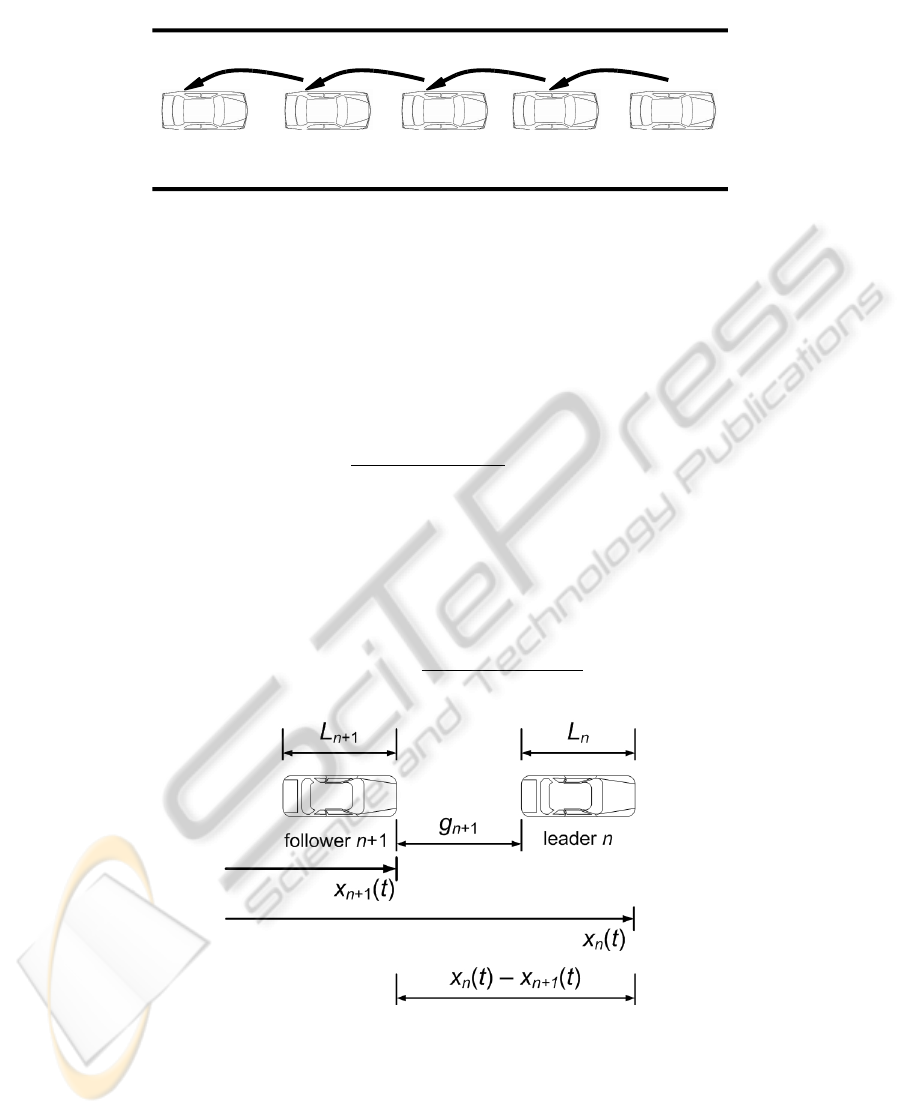
Fig. 1. Car-following with interactions on consecutive vehicles.
In the GM models, the response is always expressed as the vehicle’s acceleration
or deceleration. The general car-following model set can be viewed in Figure 2. The
leading vehicle has index n and the follower n +1. Vehicle n + 1 responds, i.e. changes
its acceleration profile, to changes in the state of the leader n. L
n
is the vehicles n’s
length and x
n
(t) is its position at time t. The gap between the follower and the leader is
g
n+1
and their distance at time t is considered to be x
n
(t) − x
n+1
(t). Then, the general
(`, m) car-following model reads
¨x
n+1
(t + ∆t) =
α ˙x
n+1
(t + ∆t)
m
[x
n
(t) − x
n+1
(t)]
`
[ ˙x
n
(t) − ˙x
n+1
(t)] (2)
where α is the driver n + 1 sensitivity to changes in the relative speed between vehicles
n and n + 1, ˙x
n
(t) − ˙x
n+1
(t) at time t and their distance. Driver n + 1 reacts with a
delay ∆t and this is influenced by the speed at the time of reaction t + ∆t. The pair
(`, m) are parameters that allow consideration of a whole family of models, but for our
purposes here the (` = 1, m = 0), i.e.
¨x
n+1
(t + ∆t) =
α [ ˙x
n
(t) − ˙x
n+1
(t)]
[x
n
(t) − x
n+1
(t)]
(3)
Fig. 2. Car-following model setup.
These car-following models have proved very useful and they are in constant im-
provement since they are at the core of most microscopic simulators. The pattern of
58

eqn. (1) is preserved, and essentially it models the interaction between two consecutive
vehicles in a traffic stream, Figure 1. The drivers’ visual sensor and perception of speed
allows them to react to the next downstream vehicle motion. Now, let us assume that
the same kind of information is given to the follower, through an on-board device, re-
garding the vehicle with minimum speed within range R from vehicle n + 1. Hence, it
is assumed that each vehicle in the traffic stream has an on-board device with a range R
that discerns the vehicle f at detectable distance x
f
(t) − x
n+1
(t) further downstream
and has the smallest speed of all vehicles downstream n + 1 within distance R. Hence,
driver n + 1 receives two stimuli of the same nature, but from different sources:
– a stimulus from the vehicle n immediately downstream through visual perception
and
– a stimulus from the on-board device for the downstream vehicle f with the mini-
mum speed within distance R.
Obviously, the design of such an on-board device is not a trivial task and requires the
study of drivers’ behavioral and cognitive features, but this is not within the scope of
this discussion. It is sufficient to assume that this information is transmitted via a robust
communication network in the form shown in Figure 3, where each vehicle sends its
location and speed to those preceding it. Furthermore, let us assume that the drivers’
reaction to both stimuli above follows the same model of eqn. (1). Then the acceleration
(drivers’ response) is given by
¨x
n+1
(t + ∆t) = min
α [ ˙x
n
(t) − ˙x
n+1
(t)]
[x
n
(t) − x
n+1
(t)]
,
α
f
[ ˙x
f
(t) − ˙x
n+1
(t)]
[x
f
(t) − x
n+1
(t)]
(4)
where a
f
the drivers’ sensitivity to the stimulus coming from the on-board device.
Fig. 3. Car-following with vehicle interactions with on-board devices.
Again, eqn. (4) models an idealised situation, since the traffic flow process is much
more complex. However, it does provide an initial insight into how to use information
for improving the use of road capacity without the direct implementation of a traffic
control measure.
In order to see that, let us conduct a simulation experiment using models (3) and (4)
for a 10 km road stretch with vehicles with the following parameters:
– vehicle maximum speed possible v
max
= 120 km/h;
– vehicle maximum acceleration γ
max
= 12, 960.0 km/h
2
;
– vehicle maximum deceleration γ
min
= 19, 440.0 km/h
2
;
59
– stimulus sensitivities α = α
f
= 29.412 km/h.
Now, assume that the lead vehicle of the traffic stream, i.e. the first vehicle that en-
ters the road, moves at maximum up to a point where it decelarates (with maximum
constant deceleration) for some reason over a period of time. After that, it moves with
constant speed for a time period after which, it begins to accelerate (with maximum
constant acceleration) until it reaches its maximum speed. Afterwards it moves with
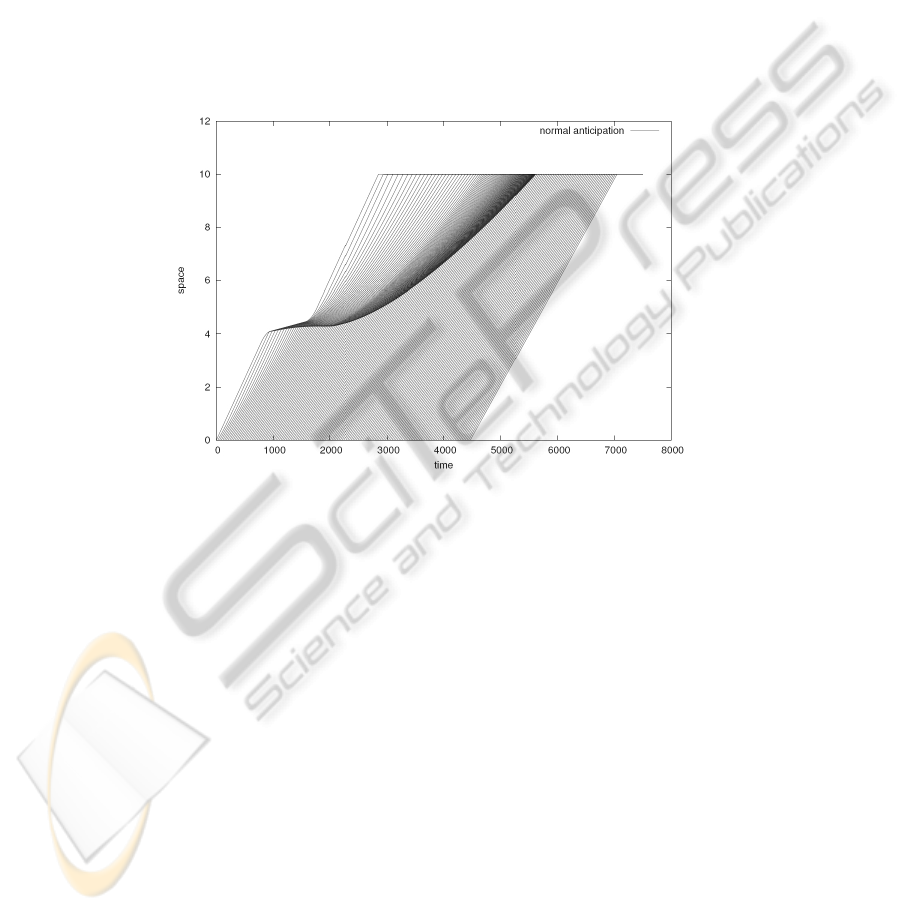
constant maximum speed, having the road empty in front of it. The result of this pat-
tern of motion of the stream lead vehicle for a length of 10 km can be seen in the
time-distance diagram in Figure 4. A number of shockwaves are created and high den-
sity areas can be discerned. This is a typical pattern formed predicted by car-following
theory.
Fig. 4. Time-distance diagram for normal car-following.
Let us assume now the scenario of Figure 3 and the application of eqn. (4) for a
range R = 16 meters. The results are shown in the time-distance diagram of Figure
5. The earlier warning produced by the on-board devices results to better utilisation
of the road facility, since more vehicles are served per unit of time, where service in
this framework is the arrival of a vehicle at point 10 km downstream the road. Figure
6 depicts the time-space diagram of model (4) when the range is set to 100 meters. In
this case, the efficiency of the resulting traffic stream is reduced, but the high concen-
tration areas, observed in Figures 4 and 5, are dispersed, which means an improvement
to safety. Figure 7 depicts the exponentially smoothed outflows at the end of the road.
It can be shown that for any traffic system, the minimisation of the total time spent by
vehicles in it, travelling and queueing, is equivalent to the maximisation of the time
weighted system outflows, [5]. Hence, the traffic stream’s efficiency of the three dif-
ferent scenarios is shown in Figure 7. The most efficient is the one where the peak in
outflows happens earlier, which clearly is the scenario with anticipation R = 16 me-
ters. The most inefficient is the scenario with R = 100 meters, but as mentioned it is
the safest.
60
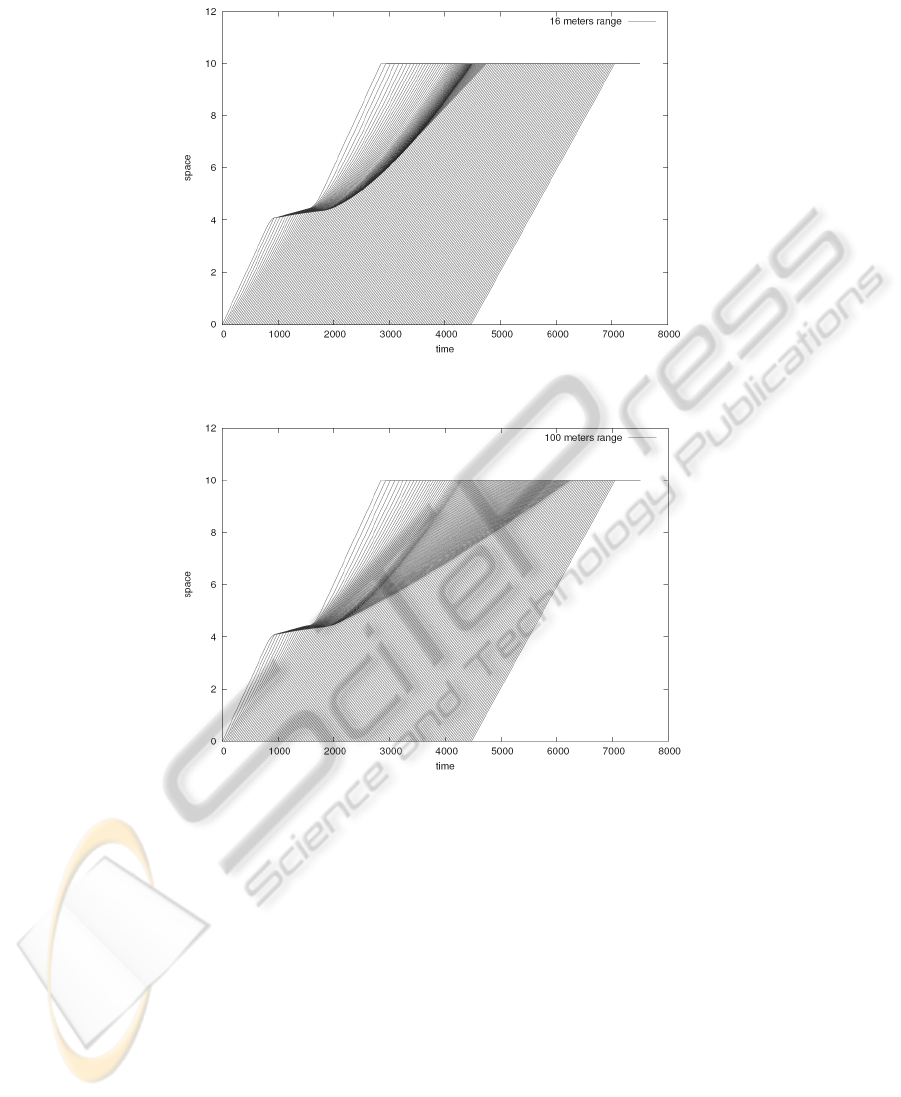
Fig. 5. Time-distance diagram for on-board based car-following with R = 16 m.
Fig. 6. Time-distance diagram for on-board based car-following with R = 100 m.
The main issue to be noted here is the capability provided by the on-board devices
for achieving a desirable traffic state, in terms of efficiency or safety, without the direct
mediation of the TCC, e.g. by providing compulsory speed advice to drivers. It is the
drivers themselves that do the decision making and based on that process the desired
traffic state emerges. The traffic authority need only provide the networking support
applications that will allow the setup of a robust, reliable and fast communication net-
work.
This kind of analysis has been based here on a lot of idealised assumptions, but
this line of reasoning can be extended to more realistic situations, where a lot of the
parameters characterising the system are stochastic variables rather than deterministic.
More detailed results will be reported elsewhere.
61
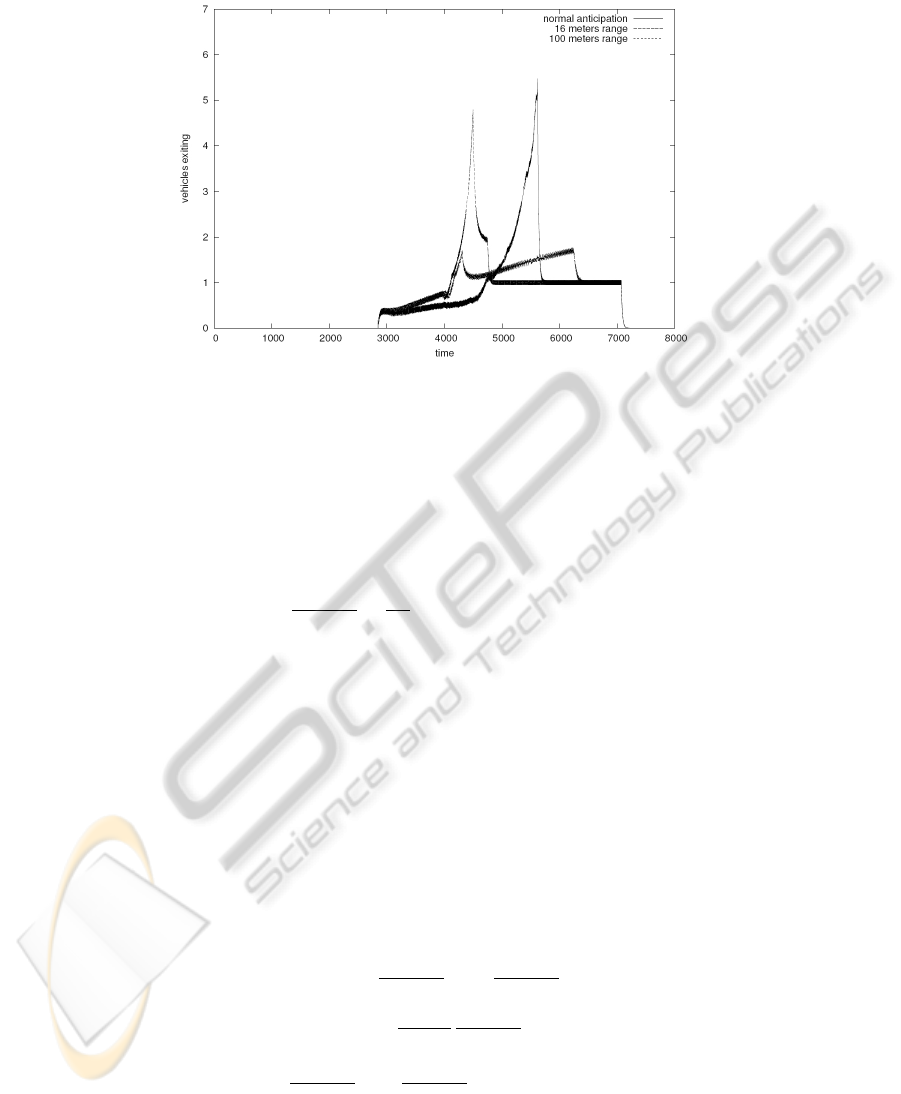
Fig. 7. Smoothed system outflows for the three scenarios.
4 The Impact of On-board Devices on Macroscopic Models
Macroscopic traffic flow models describe traffic in terms of vehicular density, average
speed and volume (flow). The vehicle conservation equation that lies in the core of
every macroscopic model reads [6], [7]
∂ρ(x, t)
∂t
+
∂
∂x
[ρ(x, t)v(x, t)] = 0. (5)
where ρ(x, t) and v(x, t) are the vehicular density and average speed at point x at time t,
respectively. When the traffic flow is in equilibrium at point x at time t, the relationship
between speed and flow is given by the fundamental diagram V [ρ(x, t)]. Second order
models use an empirical speed equation in conjunction with the conservation equation
(5). One of the possible forms of this equation reads [8], [9]
v(x, t + τ ) = V [ρ(x + ∆x, t)] (6)
Equation (6) states that the average driver will need some time τ to react to the stimulus
provided by traffic density downstream at distance ∆x. A similar assumption was made
for the microscopic models, but here the behaviour is averaged. A Taylor expansion
argument on both sides of (6) yields the following dynamic speed equation [9]
v(x, t) + τ
∂v(x, t)
∂t
+ τv
∂v(x, t)
∂x
=
V [ρ(x, t)] −
ν
ρ(x, t)
∂ρ(x, t)
∂x
⇒
∂v(x, t)
∂t
= −
∂v(x, t)
∂x
62
+
1
τ
[V [ρ(x, t)] − v(x, t)]
−
ν
τ
1
ρ(x, t)
∂ρ(x, t)
∂x
(7)
where due to microscopic considerations
∆x =
0.5
ρ
(8)
has been used and ν is a model parameter given by
ν = −0.5
∂V
∂ρ
> 0 (9)
which is constant when a linear fundamental diagram is assumed.
The key parameter that is of interest here is the determination of ∆x. In the original
approach, eqn. (8) gives sufficient small values to ∆x for the Taylor expansion theorem
to be valid. However, with the use of on-board devices in a scenario as that shown in
Figure 3, the distance ∆x in eqn. (6) can take much larger values. Hence, the Taylor
expansion argument is not straightforward anymore. New or revised models need to be
developed that will consider the impact of information from on-board devices to the
macroscopic description of traffic.
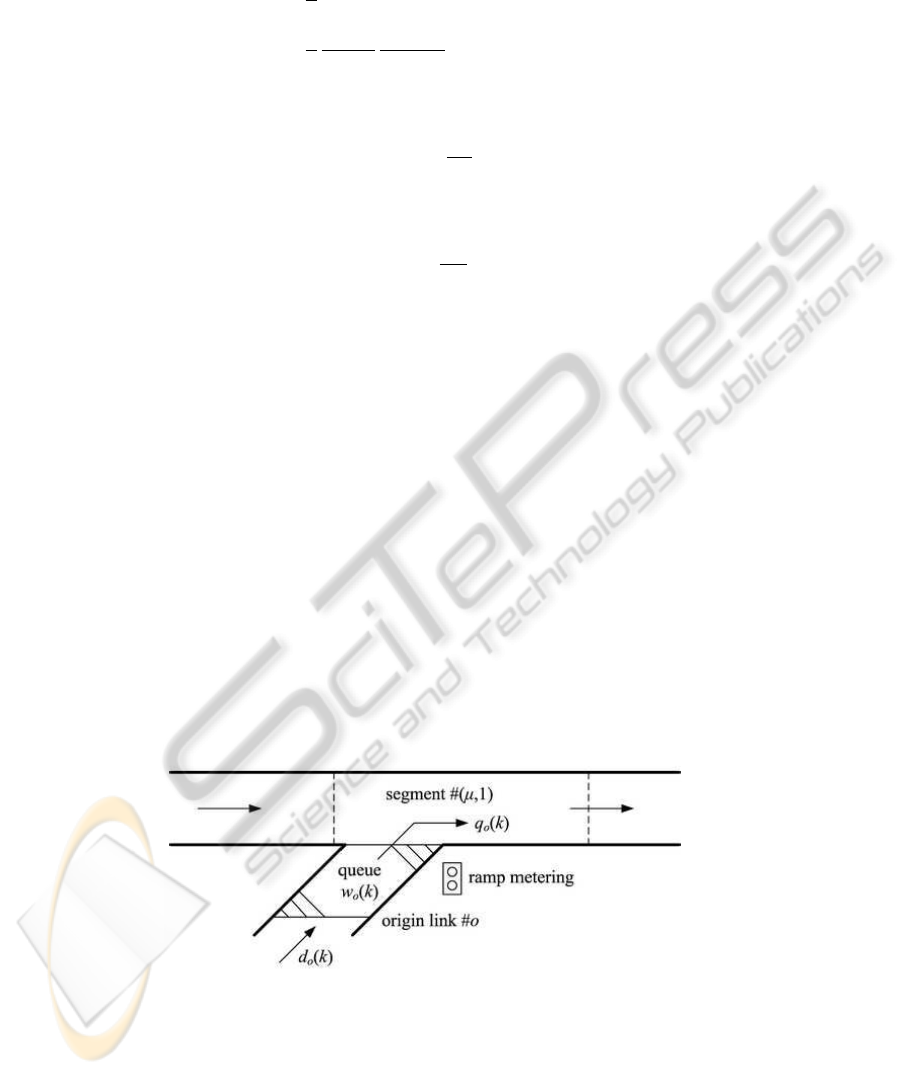
5 Using the Internet for Improving Ramp Metering Control
Ramp metering is one of the most effective control measures applied in motorway net-
works. Figure 8 depicts its basic principle of operation. An on-ramp o is used by demand
originating from the residential areas adjacent to the motorway d
o
(k) (veh/h) during pe-
riod k. Vehicles are queued into the on-ramp forming a queue of length w
o
(k) (number
of vehicles). A traffic light installed at entrance of the on-ramp to the motorway main-
stream regulates the inflow q
o
(k) (veh/hour) from the queue into the traffic stream of
the first segment of link µ.
Fig. 8. Ramp metering control measure setup.
One of the most efficient approaches to coordinated ramp metering is based on
discrete-time nonlinear optimal control. The general discrete time nonlinear optimal
63

control problem reads [10]
Minimise
J = ϑ [K] +
K−1
X
k=0
ϕ [x(k), u(k), d(k)] (10)
subject to
x(k + 1) = f [x(k), u(k), d(k)] , x(0) = x
0
(11)
u
i,min
≤ u
i
(k) ≤ u
i,max
∀i = 1, . . . , m (12)
where K is the time horizon, k the discrete time index, x the system’s state vector, u
the bounded control vector and d the disturbance vector, i.e. the uncontrolled inputs to
the process. ϑ and ϕ are smooth cost functionals. f is the controlled process’s model.
In the case of ramp metering of a motorway network, a discrete time nonlinear
macroscopic model of the whole network is developed based on a discretisation scheme
of the macroscopic equations, e.g. eqns. (5) and (7). The objective function selected
represents an appropriate cost criterion; the most commonly used is the TTS, which can
easily be expressed in terms of the model’s macroscopic variables [10]. The state vector
consists of the density and average speed of the segments into which the motorway
has been divided into and the queue lengths at the origins (on-ramps and motorway
entrances). The control vector consists of the ramp metering inflow rates allowed and
regulated by the traffic light at every on-ramp. Finally, the disturbance vector consists
of the demand originating from the adjacent residential area and the outflows of the
vehicles to their destination off-ramps.
This approach to ramp metering strategy design has been shown to be very effective
and tends to exploit the capacity of the on-ramps in an optimal way. Detailed investi-
gations have revealed that one of the most important parameters for the efficient use
of ramp metering is the storage capacity of the on-ramps, i.e. the maximum number of
vehicles that can be stored into the on-ramps at any given point in time [10]. This is
a crucial parameter for the surrounding surface road network as well, since small on-
ramps tend to spill vehicles into residential areas and therefore degrade environmental
conditions in sensitive areas. Hence, high demands d will result to higher queues. But if
a maximum queue constraint is imposed on the ramp metering strategy, then efficiency
will have to be sacrificed to the benefit of reduced interference of motorway with urban
street traffic (for reasons of equity as well).
The ramp metering strategy itself cannot do anything to change this condition, since
d is a disturbace, i.e. an uncontrolled input to the traffic flow process. It is exactly here
that internet applications can be used to support the operation of coordinated ramp
metering. It is relatively straightforward for a traffic authority to set up a web-based
service informing in real time drivers who want to use the motorway network and access
it via a specific on-ramp (or a set of possible on-ramps) about the travel conditions and
expected travel time as they are waiting home to depart. This information can be highly
customised to the individual needs. Such a service would result to drivers changing their
departure time from their homes, e.g. to the morning commute.
In terms of ramp metering control, a service like this exploits the storage capacity of
the residential areas. Instead of storing vehicles just in the limited space of the on-ramps,
64

an on-line application providing a motive to drivers to wait and depart later, stores
the demand further upstream the on-ramps without degrading environmental conditions
in residential areas. That increase in storage capacity will increase the efficiency of
ramp metering strategies. Furthermore, real time demand distribution could take place
by providing advice regarding which on-ramp should be used for the trip. Obviously,
this requires a highly reliable service and real-time information given to users and the
development of the appropriate interfaces, but this is something feasible with existing
technology without major problems.
6 Conclusions
In this paper a few ideas have been put forward regarding the future use of internet
for traffic flow modelling and control. Two modelling related uses have been described
based on the assumption that vehicles in the near future will be equipped with smart on-
board devices that can communicate with each other through reliable networks setting
up their own internet. This capability opens new ways of thinking about traffic flow and
requires the explicit consideration of the drivers’ behaviour when more information is
available to them pertaining to downstream traffic conditions.
A discussion was provided under idealised assumptions regarding the microscopic
dynamics of a traffic stream and how the information provided by such on-board de-
vices can be used to achieve the same effect as if there was a traffic control strategy
explicitly used. The second example was concerned with possible changes or revi-
sions in the macroscopic modelling of traffic, were again the impact of information
on driver behaviour needs to be considered, as it becomes an important feature. Finally,
the use of a classical web-based application has been described, that can work in con-
junction with and in support of ramp metering operations. By providing information
about travel times and traffic conditions and even suggestions, the time of departure can
be influenced so that in effect the residential areas are used as storage areas for vehicles,
similarly to the use of the on-ramp storage capacity from ramp metering strategies.
These ideas, briefly described here, can be further elaborated as they offer some
good research directions to be followed and pose significant challenges.
References
1. Sharif, B. S., Blythe, P. T., Almajnooni, S. M., Tsimenidis, C. C.: Inter-vehicle mobile ad
hoc network for road transport systems. IET Intelligent Transport Systems. 1 (2007) 47–56
2. Herman, R., Montroll, E. W., Potts, R. B., Rothery, R. W.: Traffic dynamics: Analysis of
stability in car following. Operations Research, 7(1) (1959) 86–106
3. Herman, R., Potts, R. B.: Single-lane traffic theory and experiment. In: Theory of Traffic
Flow. Proceedings of Symposium Held at Research Laboratories General Motors Corpora-
tion, Warren, Michigan, U.S.A., Elsevier (1961)
4. A. D. May: Traffic Flow Fundamentals Prentice Hall (1990)
5. Papageorgiou, M.: Application of Automatic Control Concepts to Traffic Flow Modelling
and Control. Springer, New York (1983)
6. Lighthill, M. J., Whitham, G. B.: On kinematic waves II: a traffic flow theory on long
crowded roads. Proc. of the Royal Society of London Series A, 229 (1955) 317–345
65

7. Richards, P. I.: Shock waves on the highway. Operations Research, 4 (1956) 42–51
8. Payne, H. J.: Models of freeway traffic and control. Simulation Council Proc., 1 (1971)
51–61
9. Papageorgiou, M., Blossville, J. M., Hadj-Salem, H.: Modelling of traffic flow on the Boule-
vard P
´
eriph
´
erique in Paris. Transportation Research B, 23(1) (1989) 29–47
10. Papamichail, I., Kotsialos, A., Margonis, I., Papageorgiou, M.: Coordinated ramp metering
for freeway networks. A model-predictive hierarchical control approach. Transportation Re-
search: Part C 18(3) ( 2010) 311–331
66
