BUILDING A BUSINESS PROCESS MAP USING BPM TOOLS
AND BPMN NOTATION
Francesc Xavier Berjano Tresserras
Mediterranean Consulting,Marinel.lo bosch 115-B, 08222 Terrassa, Barcelona, Spain
francesc@mediterranean-consulting.com
Keywords: BPMN notation, BPM, BPM open source tools, BPMI.
Abstract: This paper aims at discussing business process management tools and the BPMN notation, identifying
particular strengths of these tools and notation, supported by a case example, namely a project case on
business process re-engineering. We will explicitly consider the phases that we normally follow in realizing
such a project (project organization, key people, tasks, resources, deliverables and a project management
method). This will support our concluding about strengths of the above-mentioned tools and notation.
1 INTRODUCTION
This paper aims at discussing business process
management tools and the BPMN notation,
identifying particular strengths of these tools and
notation, supported by a case example, namely a
project case on business process re-engineering. We
will explicitly consider the phases that we normally
follow in realizing such a project (project
organization, key people, tasks, resources,
deliverables and a project management method).
This will support our concluding about strengths of
the above-mentioned tools and notation.
In general, companies need Business Process
Management (BPM) model(s), as a way of assuring
good organization. The process mapping related to
this is therefore essentially important. It appears like
a key activity in managing and organizing all
(business goal –driven) activities within a company.
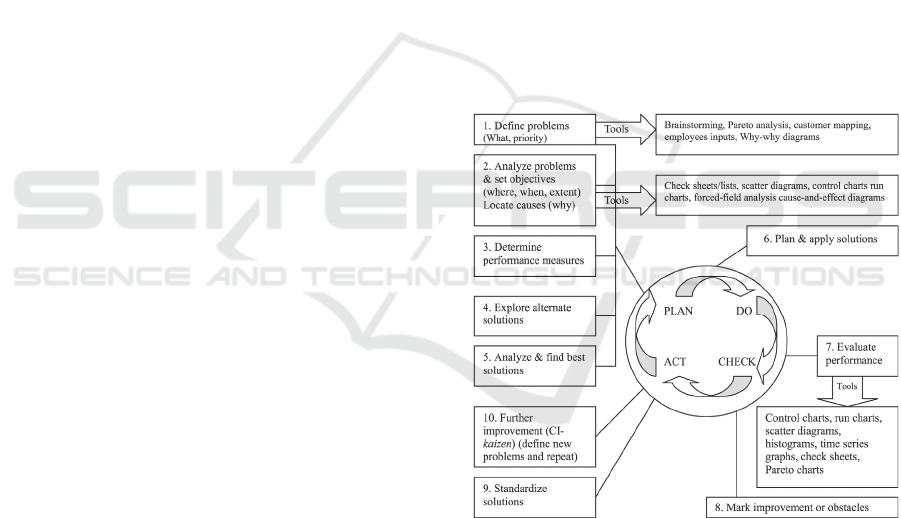
In considering BPM strategies in our work, we
are based on the PDCA interactive four-step
management process (PDCA stands for ‘plan–do–
check–act’); the PDCA process is typically used in
considering quality issues. It is also known as the
Deming circle (Walton & Edwards, 1988).
As suggested by Fig. 1, a problem definition
should come first, followed by analysis & objective
setting, measures determination, consideration of
alternative solutions, and identification of the best
solution. All this concerns the planning. Then
solutions need to be applied and evaluated, and
finally improvement actions and/or standardization
would need to be applied.
Figure 1: A typical PDCA model.
This is known in theory but applying adequate
management and establishing appropriate control in
practice remains a challenge.
As already mentioned, we aim in the current
paper at considering BPM tools + BPMN notation,
and identifying particular strengths of theirs with
regard to the above challenge.
The remaining of this paper is organizaed as
follows: Section 2 will briefly introduce and discuss
the BPMN notation; further on, Section 3 will
consider a business process re-engineering process;
185
Tresserras F.
BUILDING A BUSINESS PROCESS MAP USING BPM TOOLS AND BPMN NOTATION.
DOI: 10.5220/0004460101850188
In Proceedings of the First International Symposium on Business Modeling and Software Design (BMSD 2011), pages 185-188
ISBN: 978-989-8425-68-3
Copyright
c
2011 by SCITEPRESS – Science and Technology Publications, Lda. All rights reserved
Section 4 and Section 5 then discuss these in the
light of a case study – introducing the case is done in
Section 4 and tool consideration is done in Section
5; Section 6 contains the conclusions.
2 MODELING STRATEGY USING
BPMN NOTATION
Being a business process modeling standard, BPMN
was developed by Business Process Management
Initiative (BPMI), and is currently maintained by the
Object Management Group (BPMN Home, 2011).
With respect to this, it is interesting to consider
BPMN from a methodological perspective - origin
and which are the key elements, which it possesses.
It is interesting not only discussing this but also
establishing where to obtain more information and
which are the principal institutions linked with
BPMN.
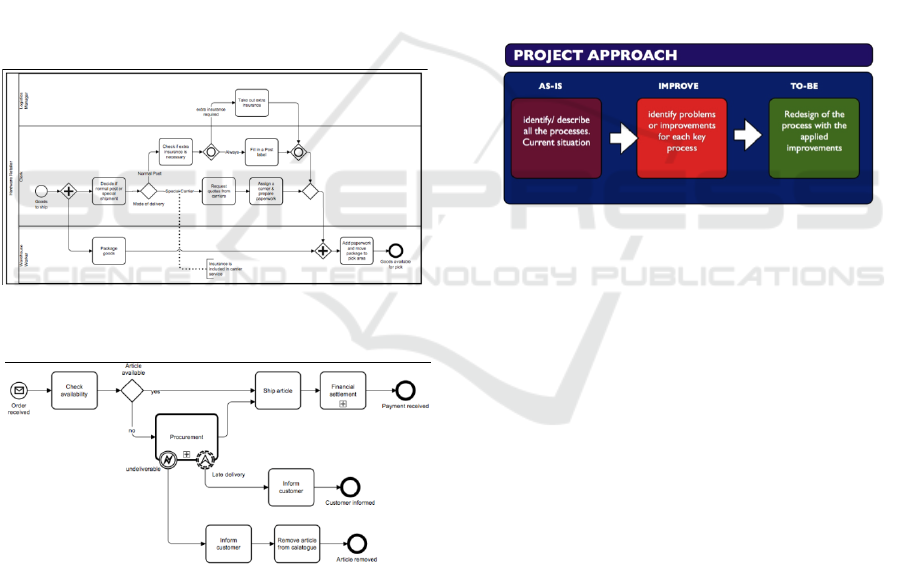
Figure 2: A shipment process of a hardware retailer (a
sample).
Figure 3: Order fulfilment and procurement (a sample).
Figure 2 and Figure 3 illustrate some important
features of BPMN and for more information
interested readers are referred to (BPMN Home,
2011).
For the sake of brevity, we will not discuss
BPMN in more detail in the current section.
3 PROCESS RE-ENGINEERING
PHASES
As according to Dietz (1994), the re-engineering of
business processes needs sound modeling and proper
notations, such that the re-designed (part of the)
business processes are guaranteed to fit in the
broader context.
As process improvement is concerned, the
typical process re-engineering phases are to be taken
in consideration, being reflected in addressing the
following points: project organization, key people,
tasks, resources, deliverables and project
management method.
For the sake of brevity, we will not go into
further detail here, presenting only (for partial
exemplification) the "Buldeza´s Project" that has
been realized in the northern Bulgarian city of
Pleven.
Figure 4: The approach followed in the “Buldeza’s
Project.
As seen from Fig. 4, the ‘to be’ situation is
reached by properly projecting improvements,
having an ‘as is’ situation as starting point.
The way we are modeling and the notations we
are using are thus of great importance for
appropriately introducing our intention in a real-
world business system.
4 DESCRIPTION OF THE
“BULDEZA’S” PROJECT
As already mentioned in the current paper, we will
discuss a case study – the “Buldeza’s” project.
4.1 Why a BPR Project
The company under consideration is undergoing
reorganization in its plant in Bulgaria (Pleven),
focused on the improvement of management
processes efficiency. The need for reorganization
has been motivated not only by the company’s
BMSD 2011 - First International Symposium on Business Modeling and Software Design
186
growth but also by a forecast concerning the support
of this increase in next years.
4.2 The Project
The project has been structured in the improvement
of three principal areas: production, confection and
store of raw material. Also initially, has been setup
the control of presence of the people, using an
integrated system with the headquarters in Spain.
In production area has been proceeded the
improvement of the manufacturing processes, as
well as a reorganization of the human resources.
There was established a performance control system
in plant. After realizing this step, one proceeded to
analyze the flow of confection and to establish
mechanisms to increase the performance as well as
the traceability of the garment inside the area. Later
been setup the logistic control integrated to
BULDEZA's central warehouse.
The system is based on a method of locations
and areas management, , where, since the receipt of
the raw material, a total traceability exists: the
spinning is identified in the warehouse and is
located in a specific position of the store sorted by:
qualilty of the spinning, color, and dyed.
4.3 Results
After finishing this project, the company has in
production area one performance control system in
plant diary, in different perspectives: machines,
articles, people or section.
The Warehouse of raw materialis integrated
with the production process, then when an order of
manufacture is emitted, the spinning is visualized
and the system tell us the number of kilos availabe
in the Warehouse and his exact position (X,Y).
For this reason, the time of search of the spinning
has diminished because now this information is
obtained automatically.
Definitively, nowadays the set of processes of
manufacture – confection are more efficient and
have allowed to optimize the resources and at the
same time to increase the productivity.
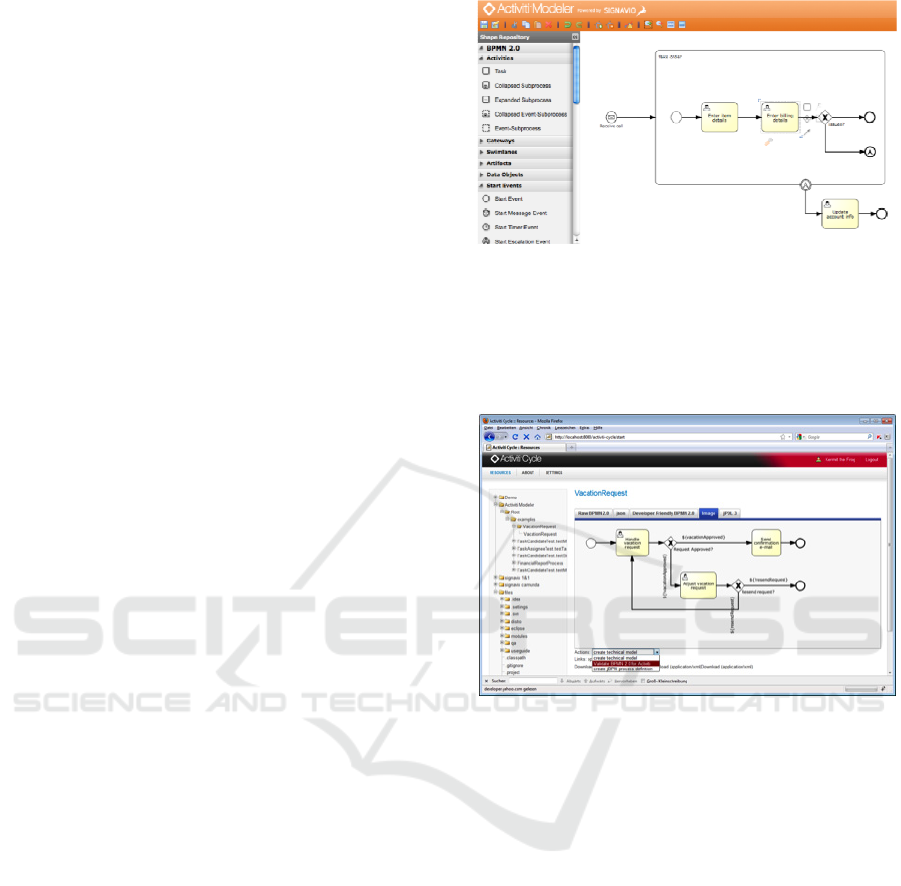
5 TOOLS USED
Both for the sake of managing the project and
introducing improvements, it is necessary to apply
modeling tools and graphical notations in directions
discussed already in the paper; Fig. 5 and Fig. 6 are
just illustrating this.
Figure 5: Tools used (Take Order).
As it is seen from these figures, the tools have
potential for supporting the management with regard
to possible (re-)design of business processes,
simulating them, and visualizing their execution.
Figure 6: Tools used (Vacation Request).
This potential has been demonstrated in the case
study considered.
6 CONCLUSIONS
Business Process Modeling Notation (BPMN) is a
graphical representation for specifying business
processes in a business process model. BPMN was
developed by Business Process Management
Initiative (BPMI), and is currently maintained by the
Object Management Group since the two
organizations merged in 2005. On the other hand,
there are business process modeling tools available
on the market, based on BPMN, that could be
helpful in realizing process generation using an easy
and understandable process map. These tools can be
grouped by functions such as: modeling,
documentation, simulation and execution (in
essence, BPM tools take graphical process
descriptions as input). A process is composed of
BUILDING A BUSINESS PROCESS MAP USING BPM TOOLS AND BPMN NOTATION
187

activities that are connected with transitions.
Processes represent an execution flow. The graphical
diagram of a process is used as the basis for the
communication between non-technical users and
developers. This all makes BPM tools and the
BPMN notation useful at the management level of
companies, as a way for mastering complexity and
leading businesses properly.
REFERENCES
BPMN Home (2011), http://www.bpmn.org.
Dietz, J. L. G. (1994): Modelling Business Processes for
the Purpose of Redesign. In: Business Process Re-
Engineering.
Walton, M., Edwards, W. (1988). The Deming
Management Method. Berkley Publishing Group, New
York (USA).
BMSD 2011 - First International Symposium on Business Modeling and Software Design
188
