
NEURODYNAMICS OF EMOTIONAL JUDGMENTS
IN THE HUMAN BRAIN
K. Hiyoshi-Taniguchi
1,2
, F. B. Vialatte
3,1
, M. Kawasaki
4
, H. Fukuyama
2
and A. Cichocki
1
1
Laboratory for Advanced Brain Signal Processing, RIKEN Brain Science Institute, Wakō, Saitama, Japan
2
Human Brain Research Centres, Kyoto University Graduate of Medicine, Kyoto, Japan
3
Laboratoire SIGMA, ESPCI ParisTech, Paris, France
4
RIKEN BSI-TOYOTA Collaboration Center, Riken, Japan
Keywords: Emotion, Multi-modal, EEG.
Abstract: The purpose of this study is to clarify multi-modal brain processing related to human emotions. This study
aimed to induce a controlled perturbation in the emotional system of the brain by multi-modal stimuli, and
to investigate whether such emotional stimuli could induce reproducible and consistent changes in EEG
signals.
We exposed two subjects to auditory, visual, or combined audio-visual stimuli. Audio stimuli consisted of
voice recordings of the Japanese word ‘arigato’ (thank you) pronounced with three different intonations
(Angry - A, Happy - H or Neutral - N). Visual stimuli consisted of faces of women expressing the same
emotional valences (A, H or N). Audio-visual stimuli were composed using either congruent combinations
of faces and voices (e.g. H x H) or non-congruent (e.g. A x H). The data was collected with EEG system
and analysis was performed by computing the topographic distributions of EEG signals in the theta, alpha
and beta frequency ranges.
We compared the conditions stimuli (A or H) vs. control (N), and congruent vs. non-congruent.
Topographic maps of EEG power differed between those conditions on both subjects. The obtained results
suggest that EEG could be used as a tool to investigate emotional valence and discriminate various
emotions.
1 INTRODUCTION
Human communication is based both on face and
voice perception, therefore facial expression and
tone of voice is important to understand emotions.
Such multi-modal brain processes are difficult to
investigate. The brain is a complex machine, and
unfortunately no optimal method exists to
understand fully its mechanisms – especially when
one intends to use non-invasive measurements. In
order to understand the mechanisms of emotion, one
has to ask first where these mechanisms would be
expected to be located inside the brain.
Anatomically, a huge literature emphasizes the role
of sub-cortical areas in emotion processing.
However, these areas do not work independently one
from another, and consequently emotion processing
necessarily involves large-scale networks of neural
assemblies, in cortico-subcortical transient
interactions, where the time evolution of the network
is a key factor (Tsuchiya, and Adolfs, 2007).
There is considerable evidence that multisensory
stimuli presented in spatial or temporal proximity
are bound by the brain into a unique perceptual
gestalt (Van den Stock, et al., 2008). What would
happen if subjects were exposed to contradictory
visual and auditory stimuli? Such contradiction is
termed as a “McGurk effect” (McGurk and
MacDonald, 1976, see
Figure 1) – the visual and
auditory stimuli do not carry the same message.
Subjects confronted to these emotional stimuli, and
asked to provide feedbacks on their internal
perceptions while their neural activities are recorded,
are confronted to the difficulty of binding
contradictory emotional features.
2 AIM
The purpose of our pilot study was to induce a
controlled perturbation in the emotional system of
461
Hiyoshi-Taniguchi K., B. Vialatte F., Kawasaki M., Fukuyama H. and Cichocki A..
NEURODYNAMICS OF EMOTIONAL JUDGMENTS IN THE HUMAN BRAIN.
DOI: 10.5220/0003723104610464
In Proceedings of the International Conference on Neural Computation Theory and Applications (Special Session on Challenges in Neuroengineering-
2011), pages 461-464
ISBN: 978-989-8425-84-3
Copyright
c
2011 SCITEPRESS (Science and Technology Publications, Lda.)
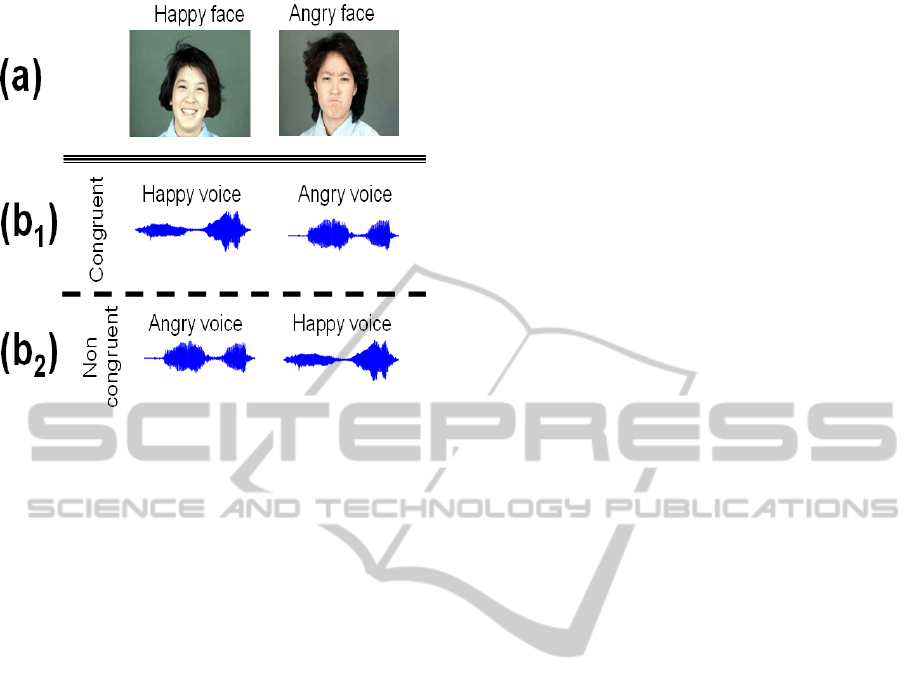
Figure 1: McGurk effect. Visual stimuli (a) are combined
with audio stimuli (b). Subjects will expect congruent
stimuli (b
1
), where visual and auditory clues are
concordant (e.g. happy face and happy voice). Non-
congruent stimuli (b
2
), where visual and auditory clues are
discordant (e.g. happy face and angry voice), will induce
distortions in either the visual or auditory perception (this
distortion is termed as a “McGurk effect”.
the brain by multi-modal stimuli, and to control if
such stimuli could induce reproducible changes in
EEG signal. Through the investigation of this
‘abnormal’ perceptual condition, we intend to reveal
the mechanisms of normal emotional judgment (how
one can distinguish the valence of emotions in a
given stimulus). The use of different valence stimuli
(neutral, aggressive, appeasing, etc.) will be
compared.
3 METHOD
We exposed two right handed, male subjects to
auditory, visual, or combined audio-visual stimuli.
Stimuli were presented for 2 sec, the subjects was
asked to answer afterwards within a 3 sec window,
and then had 5 sec of rest (one trial = 10 sec). Audio
stimuli consisted of voice recordings of the word
‘arigato’ (thank you) pronounced with three
different intonations (Angry - A, Happy - H or
Neutral - N). Visual stimuli consisted of faces of
women expressing the same emotional valences (A,
H or N), taken from the JACfee and JACNeuf
Japanese-Caucasian photo databases (Biehl et al.
1997). Audio-visual stimuli were composed using
either congruent combinations of faces and voices
(e.g. HxH) or non-congruent (e.g. AxH). The
experiment consisted in three different sessions:
• In the first session, the subjects were
exposed to visual stimuli only. Their task
was to judge if the face was neutral, angry,
or happy. 60 stimuli were presented in a
pre-decided random order, and so that two
consecutive emotions were always
different.
• In the second session, the subjects were
exposed to visual stimuli only. Their task
was to judge if the voice was neutral,
angry, or happy. 60 stimuli were presented
in a pre-decided random order, and so that
two consecutive emotions were always
different.
• In the third session, the subjects were
exposed to the combined audio-visual
stimuli. Their task was to judge if the
percept was neutral, angry, or happy. 60
stimuli were presented in a pre-decided
random order, and so that two consecutive
emotions were always different, and so that
the same number of trials occurred for all
possible pairs of stimuli.
In each of the three sessions, the task of the subjects
was to judge if the face was neutral, angry, or happy,
and to provide this response with a keyboard.
The data was collected with a 64-channel
Biosemi EEG system with active electrodes in a
shielded room. Sampling rate was fixed at 1024 Hz,
notch filter at 50 Hz and analog bandpass filter
between 0.5 and 100 Hz. The topographic
distributions of EEG signals (relative power) in the
theta (4-8 Hz), apha (8-12 Hz) and beta (12-25 Hz)
ranges was afterwards computed using the Welch
periodogram method (Welch, 1967) on the trials of
the third session.
4 RESULT
We compared the conditions stimuli (A or H) vs.
control (N), and congruent vs. non-congruent.
Topographic maps of EEG power differed between
those conditions on both subjects. Generally, the
difference is maximized for HxH vs. HxA (Figure
2), in other words, the non-congruent stimuli are
“more different” than the neutral stimuli. Significant
changes are observed in the alpha range in the
frontal and right temporal areas; and in the left
parietal area in the theta range (Figure 2, Figure 3).
These changes are specific to the McGurk effect
NCTA 2011 - International Conference on Neural Computation Theory and Applications
462
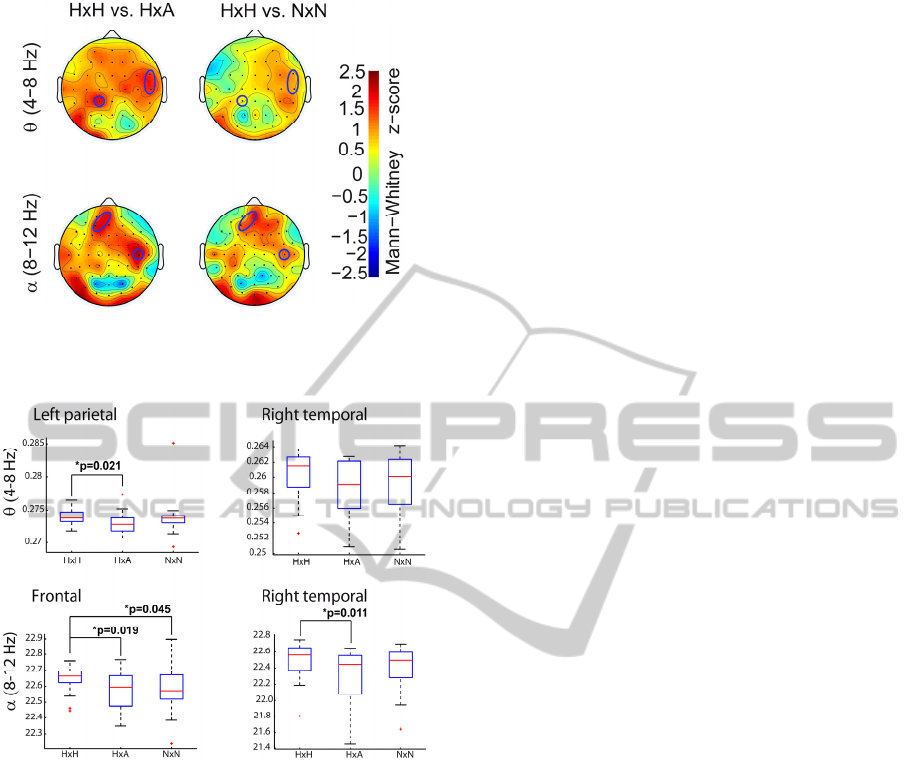
Figure 2: Illustration of the difference between HxH and
HxA conditions (Mann-Whiteny z-score) in the theta (4-8
Hz) and alpha (8-12 Hz) ranges.
Figure 3: Boxplot of theta (4-8 Hz) relative power in the
left parietal and riught temporal area, and alpha (8-12 Hz)
relative power in the frontal and right temporal areas (blue
ellipses of figure 2) for each condition.
(congruent vs. non-congruent), they are not observed
on the HxH vs. control topographic map.
5 DISCUSSION
It was shown recently that the emotions elicited, and
the EEG topographies observed in emotion studies,
are influenced by the task given to the subject in the
experiment (Grandjean and Scherer, 2008).
Therefore, our results are not general observations of
emotional mechanisms, and should be considered in
the context of the experimental task (emotional
judgment). One could model emotional experience
as a confluence of two dimensions, valence and
arousal (Feldman Barrett, et al., 2007). Many current
theories of emotion now place the appraisal
component of emotion at the forefront in defining
and studying emotional experience. However, most
contemporary psychologists who study emotion
accept a working definition acknowledging that
emotion is not just appraisal but a complex
multifaceted experience with the following
components:
• Cognitive appraisal (Scherer, 1999). Only
events are judged or appraised to have
significance for our goals, concerns, values,
needs, preferences, or well-being elicit
emotion. This is the cognitive aspect of
emotional valence.
• Subjective feelings. The appraisal is
accompanied by feelings that are good or
bad, pleasant or unpleasant, calm or
aroused. This is a more perceptual aspect of
emotional valence.
• Physiological arousal (e.g. Schachter and
Singer, 1962).. Emotions are accompanied
by autonomic nervous system activity.
• Expressive behaviours (Ekman and Friesen,
1978; Martin et al., 1988). Emotion is
communicated through facial and bodily
expressions, postural and voice changes.
• Action tendencies. Emotions carry
behavioural intentions, and the readiness to
act in certain ways.
We investigated emotional judgement, i.e. cognitive
appraisal of emotional stimuli. Our exploratory
experiment indicates that EEG could be used as a
tool to investigate emotional valence. The main
effect observed is that the Mc Gurk effect (non
congruent stimuli) seems to enhance the difference
of brain EEG topography, as compared to more
classical emotional stimuli. Additional data will be
collected to confirm our first observations.
REFERENCES
Biehl, M., Matsumoto, D., Ekman, P., Hearn, V.,
Heider ,K., Kudoh, T., Veronica, T., 1997. Matsumoto
and Ekman's Japanese and Caucasian Facial
Expressions of Emotion (JACFEE): Reliability Data
and Cross-National Differences, Journal of Nonvernal
Behavior, 21(1):3-21.
Ekman, P., Friesen, W. V., 1978. Manual for facial action
coding system. Palo Alto: Consulting Psychologists
Press.
Feldman, Barrett, L., Mesquita, B., Ochsner, K. N., Gross
J.J., 2007. The Experience of Emotion. Annual Review
of Psychology, 58, 373-403
NEURODYNAMICS OF EMOTIONAL JUDGMENTS IN THE HUMAN BRAIN
463

Grandjean, D., Scherer, K. R, 2008. Unpacking the
Cognitive Architecture of Emotion Processes.
Emotion, 8(3):341–351.
Martin, L. L., Stepper, S., Strack, F., 1988. Inhibiting and
facilitating Conditions of the Human Smile: A
Nonobtrusive Test of the Facial Feedback Hypothesis.
Journal of Personality and Social Psychology. 54(5),
768-777.
McGurk, H., MacDonald, J., 1976, Hearing lips and
seeing voices. Nature, 264(5588):746–748.
Schachter ,S., Singer, J. E., 1962. Cognitive, Social, and
Physiological Determinants of Emotional State.
Psychological Review, 69(5), 379-399.
Scherer, K. R., 1999. Appraisal theories. In T. Dalgleish,
& M. Power (Eds.). Handbook of Cognition and
Emotion (pp. 637–663). Chichester: Wiley.
Tsuchiya, N, Adolphs, R., 2007, Emotion and
consciousness. Trends Cogn Sci. 11(4):158-67
Van, den, Stock J., Grèzes, J., de, Geldera, B., 2008,
Human and animal sounds influence recognition of
body language. Brain Research, 1242(25):185-190.
Welch, P. D, 1967. The Use of Fast Fourier Transform for
the Estimation of Power Spectra: A Method Based on
Time Averaging Over Short, Modified Periodograms.
IEEE Trans. Audio Electroacoustics, AU-15:70-73.
NCTA 2011 - International Conference on Neural Computation Theory and Applications
464
