
AUTOMATED APPROACH FOR WHOLE BRAIN
INFARCTION CORE DELINEATION
Using Non-contrast and Computed Tomography Angiography
Petr Maule
1
, Jana Klečková
1
and Vladimír Rohan
2
1
Department of Computer Science and Engineering, University of West Bohemia, Pilsen, Czech Republic
2
Department of Neurology, The University Hospital in Pilsen, Pilsen, Czech Republic
Keywords: Automated Infarction Core Segmentation, Brain Ischemia, Perfusion Blood Volume, Volumetric Maps,
Acute Stroke.
Abstract: This article proposes automated approach for whole brain infarction core delineation while using only non-
contrast computed tomography and computed tomography angiography. The main aim is to provide
additional information measuring infarction core volume while exceeding certain level is contraindication of
early recanalization. Process of generation of Perfusion Blood Volume maps is described first followed by
description of process of infarction core delineation. Verification of correctness is based on comparison
against follow-up examinations. Discussion and future works summarizes weaknesses of the method and
steps for improvement.
1 INTRODUCTION
Acute stroke is the third leading cause of death and
first leading cause of disability in population over 60
years old. When we use computed tomography the
best localization and stoke visualization can be
reached by perfusion examination (CTP). This kind
of examination has limitations depending on the
device and settings restrictions. Radiation dose is
another factor which must be taken into account.
CTP is generally limited in width of the acquired
area. Early recanalization is a treatment of choice in
acute stage of ischemic stroke. This kind of
treatment can be used at those patients who did not
exceed certain level of infarction core. Evaluation of
actual infarction core tissue volume is not possible
from CTP in many cases because of limited acquired
width while the volume must be summed over all the
brain tissue. Our study is concerned in the detection
of the necrotic tissue and computation of its volume.
To cover whole area of the brain we use different
examinations – computed tomography angiography
(CTA) and non-contrast computed tomography
(NCCT). This article deals with assumption that
there exists certain level of density increase between
CTA and NCCT (due to contrast material) where all
voxels with lower increase are considered as the
necrotic core. Study (Wintermark, 2006) present
optimal level in range 2.0 ml/100g to 2.3 ml/100g
using CTP method.
The method proposed here tries to find the way
for fully automated detection and delineation of the
infarction core. It is based on studies (Hamberg,
1996) and (Hunter, 2003). To ensure objectivity of
results we compare findings with follow-up non-
contrast CT examination where the final infarction
core area has significant density decrease compared
to the non-contrast CT acquired at the time of patient
admission.
Following sections describe each step of the
processing and the final section summarizes results
and mentions our future plans.
2 INPUT EXAMINATIONS
Our study contained examinations of 32 patients
with acute ischemia. For each patient we had 2 pairs
of examinations. One pair acquired at the time of
admission and the follow-up was acquired one day
after. Each pair consisted of non-contrast CT
examination and CT angiography.
All examinations were performed using a dual-
source CT (Somatom Definition, Siemens
433
Maule P., Kle
ˇ
cková J. and Rohan V..
AUTOMATED APPROACH FOR WHOLE BRAIN INFARCTION CORE DELINEATION - Using Non-contrast and Computed Tomography Angiography.
DOI: 10.5220/0003651704250429
In Proceedings of the International Conference on Knowledge Discovery and Information Retrieval (KDIR-2011), pages 425-429
ISBN: 978-989-8425-79-9
Copyright
c
2011 SCITEPRESS (Science and Technology Publications, Lda.)

Healthcare, Forchheim, Germany). First, an
unenhanced brain CT using a spiral technique with
the following parameters was performed in all
patients: collimation 2× (32 × 0.6 mm) with
simultaneous acquisition of 64 slices by means of a
z-flying focal spot (double z-sampling),
reconstruction slice width 6 mm without overlap,
and—in addition—0.75 mm with a reconstruction
increment of 0.5 mm. A medium-smooth head
kernel (H25) was used for all reconstructions.
All CT angiography, ranging from the aortic arch
to the vertex of the head, was performed in a dual-
energy (DE) mode using 140-kV tube voltage for
measurement system A and 80-kV tube voltage for
measurement system B. Collimation was again 2×
(32 × 0.6 mm) with simultaneous acquisition of 64
slices by means of a z-flying focal spot (double z-
sampling). The examinations were performed after
application of an iodine contrast medium (60 ml) of
400 mg/ml at a flow of 4 ml/s with subsequent saline
flush using 50 ml of saline solution.
For each examination, we reconstructed two
image data sets, one at 140 kV and one at 80 kV. A
medium-smooth head kernel (H25) was used for all
dual-energy reconstructions.
From all these examinations we have chosen 18
patients who had significant findings on the follow-
up non contrast examination. From this group we
have chosen 6 patients because of infarction core
location in a white matter where the method has
better results (see Discussion). Examinations of
those six patients underwent following processing.
3 METHOD DESCRIPTION
3.1 Overview
We have developed prototype software processing
input examinations resulting in binary volumetric
maps where each voxel represents information
1=infarction core, 0=non infarction core. Whole
process can be described by these parts:
Registration
Segmentation
Subtraction
Infarction core delineation
Method requires a pair of examinations - NCCT
and CTA. First these examinations are registered to
each other. After this step segmentation follows by
removing non-brain areas and large vessels. The
same way we process both examinations and
afterwards we subtract non-contrast examination
from angiography thus we get values of density
enhancement caused by the contrast material in
Hounsfield's units. Infarction core delineation
follows using a threshold value. The aim of our
study is to find the best threshold value which will
lead to best fit with the findings of the follow-up
findings. The best threshold value is found by ROC
analysis described later.
3.2 Registration
Method requires a pair of examinations - NCCT and
CTA. First these examinations are registered to each
other. We use open source software ITK (Yoo,
2002) for registration process. First we convert all
source examinations to 2 mm slice thickness to
avoid memory complexity problems of using 1 mm
or less of slice thickness. Reconstructions in 2 mm
slice thickness are generated also by the ITK
software.
We use rigid registration with Mattes Mutual
Information image to image metric, multi resolution
pyramidal approach and versor rigid transformation
optimizer with stopping criteria of 200 iterations.
Result of the registration is angiography
examination registered to non-contrast examination
thus voxels of both examinations correspond to each
other.
3.3 Segmentation
Segmentation step just removes “non-important”
areas like skull bones, large vessels and other non-
brain areas like eyes, ears, etc. from both NCCT and
CTA examination. Large vessels are removed by
thresholding leaving just voxels with density
between 20-80 HU.
3.4 Subtraction
Simple subtraction on voxel by voxel basis does not
provide satisfactory results because of high ratio of
noise. Denoising pre-processing is required despite
of missing information about this step in literature.
Denoising process is crucial step and have high
influence on detection of infarction core. We tried
denoising by a method of averaging neighborhood
area. The method computes average density for all
voxels in a cuboid area with the voxel as the center
of the area and dimensions m, n, o where m, n, o are
dimensions along axes x, y and z. All voxels get
new density equal to the average density of the area.
Subtraction follows after the denoising process
(Figure 1). It is based on voxel by voxel basis.
KDIR 2011 - International Conference on Knowledge Discovery and Information Retrieval
434
3.5 Infarction Core Delineation
The goal of this step is to automatically find the area
corresponding to the necrotic tissue area. The
procedure starts with the subtracted volume where
voxels contain information about local density
increase caused by the contrast material. Infarction
core can be characterized by a low density increase –
let's call separating threshold as τ. All values below
the threshold are considered to be infarction core
and all voxels above the threshold are marked as
non-infarction core. Not all voxels having the value
below the threshold are in fact infarction core. We
may assume that infarction core is the largest
continuous area formed by voxels with values below
the threshold. Thus we can find all the continuous
areas, measure their dimensions as a count of voxels
of the group and keep just the largest group.
Nevertheless the process of finding infarction
core is not that simple. Large groups of voxels
below the threshold can be found also at the bottom
parts of brain and head, including under-brain areas
which can be present because of non-perfect brain
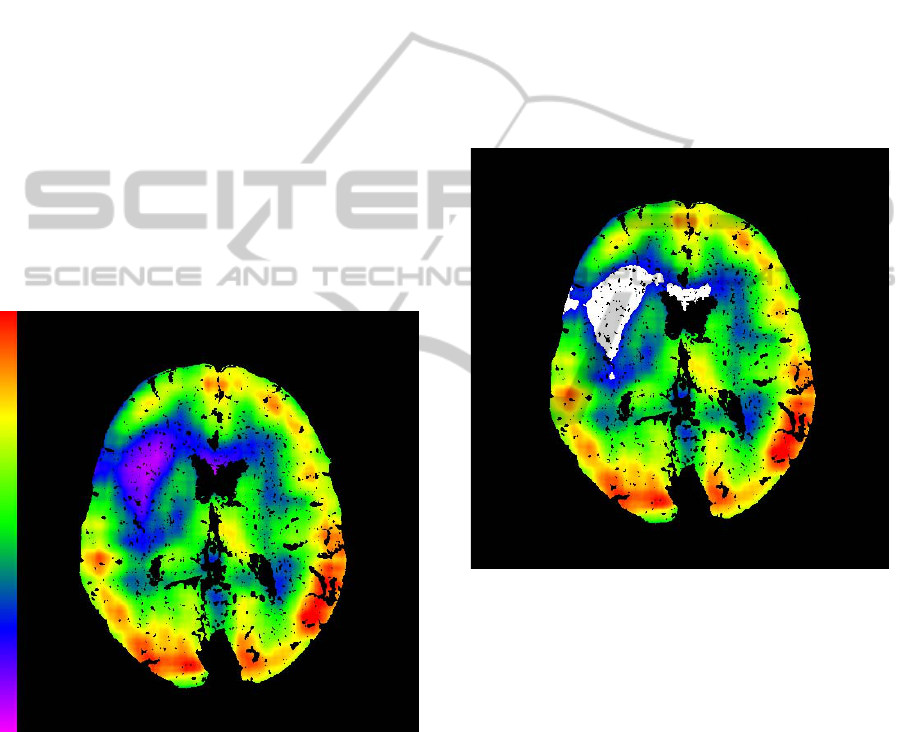
Figure 1: Subtraction on voxel by voxel basis, perfused
blood volume map.
area segmentation. To get rid of these groups we
calculate average density of each group and all
groups having average density below -2 we remove
from detection of infarction core.
Having the largest continuous area of pixel below
the threshold τ we can mark all voxels belonging to
this group as those belonging to the infarction core
area (Figure 2). All other voxels outside this group
we can mark as non-infarction core.
3.6 Follow-up Examinations
We processed follow-up examinations in same way
using only non-contrast follow-up examination
(NCCT2) and non-contrast examination acquired at
the time of patient admission (NCCT1). After pre-
processing we made subtraction and manually we
found threshold for infarction core. NCCT2 has
significant density decrease in areas of real
infarction core and we can mark real infarction core
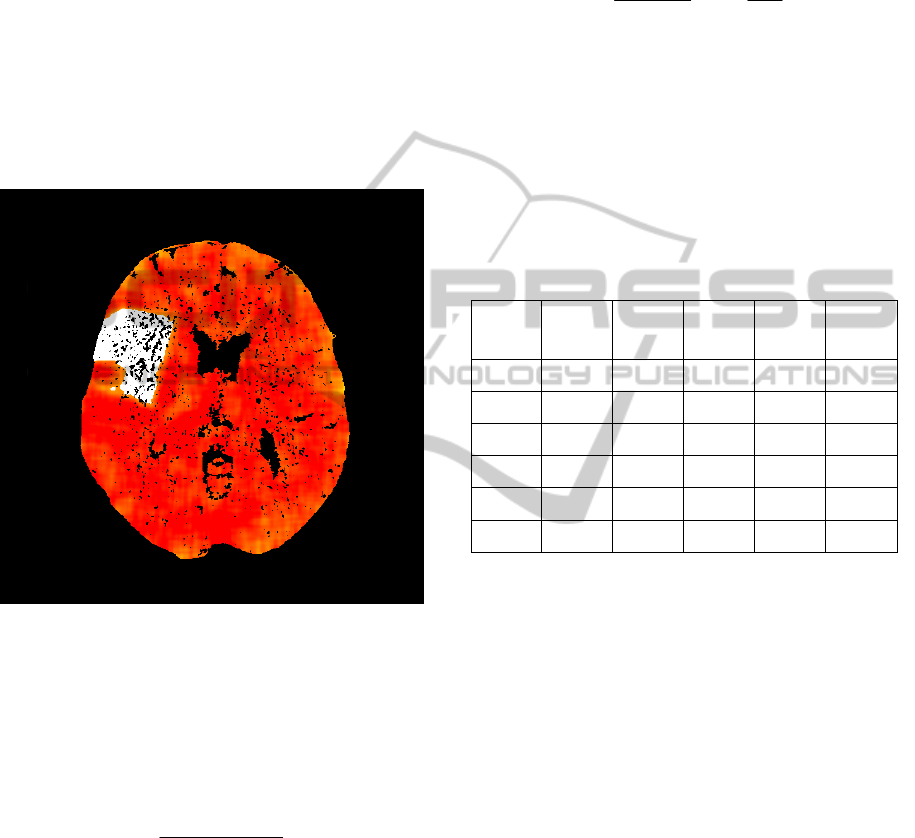
as shown on Figure 3. Follow-up findings were
confirmed by clinician. We can use these findings
for our method correctness verification and also for
tuning parameters to produce best match. We found
best parameters using ROC analysis separately for
each patient.
Figure 2: Method Result - Infarction Core Delineation
(White Area).
4 ROC ANALYSIS
We have already described method of processing
examinations and also way of preparing data for
verification and tuning parameters process. We
made ROC analysis for each patient separately. We
set ROC analysis variables to dimensions of the
considered area (for pre-processing) and threshold
value for infarction core delineation. The variable
for threshold value is for ROC analysis in
Hounsfield units. We limited values range as
follows:
Dimensions m, n, o – we set m=n with range (2-
8 mm) and range of o (2-14 mm), dimensions
AUTOMATED APPROACH FOR WHOLE BRAIN INFARCTION CORE DELINEATION - Using Non-contrast and
Computed Tomography Angiography
435
are taken symmetrically, so whole considered
area has size of 2*m, 2*n, 2*o.
Threshold values range from 0 to 5 HU with
step 0.5 HU.
We use Matthews correlation coefficient to measure
similarity between our method results and follow-up
findings. ROC analysis outputs for all patients
separately is summarized in Table 1.
5 ABSOLUTE VOLUME
EVALUATION
Figure 3: Follow-up examination with marked infarction
core (white).
To convert threshold values (relative density
increase in Hounsfiled's units) to absolute numbers
in mL/100g (column PBV in Table 1) we use
equations from (Hamberg, 1996). First we compute
correction factor CF using Equation 1.
1
10.85*
WB
WB
Hct
CF
H
ct
−
=
−
(1)
Hct
WB
means large-vessel hematocrit. We use value
0.4 which comes as average value (for man and
woman). Next value which we must find is ΔHU
Blood
which means an average density increase in large
vessels. We need to find this value in an automatic
way. First we find all brain tissue voxels with
densities in range from 40 HU to 50 HU in NCCT1.
For all these voxels we find corresponding voxels in
angiography examinations, but only those having
increases more than 300 HU aiming to select only
increases of the large vessels. Finally we take
median from all these increases and we call it as
ΔHU
Blood
. Having ΔHU
Blood
value, we can use
Equation 2:
100
**
1.05
Blood
HU
CBV CF
HU
Δ
=
Δ
(2)
where ΔHU is density increase in any place of the
map as described in the part of our method
description. Constant 1.05 is density of brain tissue
in g/100ml (Sabatini, 1991). If we put ΔHU value of
the threshold we get absolute threshold value in
mL/100g.
Table 1: ROC Analysis Results, m, o,= dimensions of area
used for denoising, τ = infarction core threshold, PBV =
threshold τ in absolute values, Matthews = correlation
coefficient.
Patient
m [mm] o [mm] τ [HU]
PBV
[mL/
100g]
Mat-
thews
1 8 8 4,5
1,15 0,48
2 5 8 5
1,64 0,42
3 5 11 2
0,5 0,37
4 4 8 4,5
1,17 0,28
5 3 8 4,5
1,4 0,23
6 2 14 3,5
1,17 0,16
6 RESULTS
We processed examinations of 6 patients resulting in
volumetric maps with additional information which
voxels correspond to infarction core and which not.
We made an ROC analysis for each patient
separately to find the best tuning of parameters and
thus getting the best match against follow-up
infarction core findings. The best match is supposed
to reflect high ratio of similarity expressed by
Matthew's coefficient.
We had group of 32 patient where only 16 of
them had significant finding on follow-up
examinations. From these 16 patients our method
correctly determined infarction core only at 6
patients with precision from 16% to 48%.
Results are not yet sufficient enough for method
to be used in clinical practice. But the method seems
like a good starting point for automated infarction
core delineation.
KDIR 2011 - International Conference on Knowledge Discovery and Information Retrieval
436

7 DISCUSSION
Although results are not sufficient there are many
new ideas which can lead to provide better results in
future. The main point is that the method provide
satisfactory results in the white brain matter. White
matter can be generally characterized by a lower
density increase due to injected contrast material
than in gray matter. White matter ischemic areas
have even lower increase and such areas is easier to
find by thresholding with threshold below the
normal increase for the white matter.
Ischemia in the grey matter is another point.
Ischemic area are optically well visible on our
pefusion maps but automatic process of infarction
core delineation fails to mark them. The reason is
that there is significant density decrease in cortical
gray matter areas compared to non-ischemic cortical
gray matter areas but the decrease is not enough to
fall down below normal values for the white matter.
Thus making threshold value higher above the
normal white matter increase leads to marking larger
area containg also normal (non ischemic) areas of
the white matter.
Having threshold values lower then normal
density increase of white matter leads to selection of
smaller infarction core areas than on the follow-up
findings. That is why Matthew's coefficient gives the
highest values at relatively low level and ROC
analysis does not find better combination of
parameters to produce better match.
8 FUTURE WORK
We believe that we can improve our results by
introduction of symmetry as mentioned in (Hunter,
2003). Symmetry information can lead to detect
ischemic areas also in cortical gray matter despite of
any threshold used by current method. The
technique of symmetry can provide information like
local density decrease compared to the other side.
We may put this decrease some kind of weight and
use it as another criterion available when deciding
whether the voxel belongs to the infarction core.
ACKNOWLEDGEMENTS
The work presented in this paper is supported by
The Czech Science Foundation project 106/09/0770
dealing with brain perfusion modelling.
REFERENCES
Hunter, G. J. et al., 2003. Whole-Brain CT Perfusion
Measurement of Perfused Cerebral Blood Volume in
Acute Ischemic Stroke: Probability Curve for
Regional Infarction. Radiology 2003; 227:725–730
Kloska, S. et al., 2007. Color-coded perfused blood
volume imaging using multidetector CT: initial results
of wholebrain perfusion analysis in acute cerebral
ischemia Eur Radiol. 2007 Sep; 17(9):2352-8.
Schramm, P., et al., 2002. Comparison of CT and CT
Angiography Source Images With Diffusion-Weighted
Imaging in Patients With Acute Stroke Within 6 Hours
After Onset. Stroke. 2002; 33:2426-2432
Yoo T. S., Ackerman M. J., Lorensen W. E., Schroeder
W., Chalana V., Aylward S., Metaxes D., Whitaker R.,
2002. Engineering and Algorithm Design for an Image
Processing API: A Technical Report on ITK - The
Insight Toolkit. In Proc. of Medicine Meets Virtual
Reality, J. Westwood, ed., IOS Press Amsterdam pp
586-592.
Hamberg L. M., Hunter G. J., Kierstead D., et al, 1996.
Measurement of cerebral blood volume with
subtraction three-dimensional functional CT. AJNR
Am J Neuroradiol 1996; 17:1861–69
Wintermark M., Flanders A. E., Velthuis B., Meuli R., van
Leeuwen M., Goldsher D., et al., 2006. Perfusion-CT
Assessment of Infarct Core and Penumbra. Stroke
2006; 37: 979-85.
Sabatini U., Celsis P., Viallard G., Rascol A., Marc-
Vergens J-P, 1991. Quantitative assessment of cerebral
blood volume by singlephoton emission computed
tomography. Stroke 1991; 22: 324–330.
AUTOMATED APPROACH FOR WHOLE BRAIN INFARCTION CORE DELINEATION - Using Non-contrast and
Computed Tomography Angiography
437
