
THE RESEARCH ON HUMAN FACTORS IN URBAN TRAFFIC
BASED ON THE CAUSAL RELATIONSHIP
Xiaoqian Du and Juanqiong Gou
School of Economics and Management, Beijing Jiaotong University, Haidian district, 100044, Beijing, China
Keywords: Urban transport, Human factors, Causal analysis, Fish bone diagram.
Abstract: In the traffic system consisting of three parts: human, vehicle and road, the people play a leading role and
have a major impact on traffic. From a sociological point, we can summarize the human factors that affect
the transportation, construct the causality diagram of urban traffic and human factors, and propose the idea
of analyzing the causal relationship and the mechanism between people and traffic by using causality. We
hope that through these studies we can provide some reference for the government department’s decision-
making to improve the urban transport.
1 INTRODUCTION
In recent years, under the situation of rapid
urbanization and economic development, China has
gradually increased transport development, which is
reflected in the transport infrastructure, transport,
traffic information and other aspects. However,
subsequent issues have been highlighted, these
problems mainly in the heavy traffic congestion,
frequent traffic accidents and other aspects.
At present, many scholars are researching on the
causes of traffic problems; the city government has
also introduced various traffic policies, trying to
ease the worsening traffic situation. But the effect is
poor. Beijing, Shanghai and other cities appear
frequent emergency of traffic jams. One important
reason is that the existing research on influence
factors of urban traffic is not comprehensive. That
made the real transport policy difficult to remedy.
There are many factors for urban traffic
congestion, such as motor vehicle ownership, road
layout, traffic facilities, traffic management, etc.
However, the human factor is a crucial factor that
cannot be ignored (Fan Xiaoke, 2007) .According to
the system theory point of view, in the transport
system consisting of the people - vehicle -road, the
people played a leading role. Either as participants in
traffic, or as a manager, human factors have a
significant impact on traffic. A recent survey
showed that: the impact of human factors on the
transport accounted for more than 30% (Fan Xiaoke,
2007), such as: motor vehicle occupied by non-
motor vehicle lanes, vehicle lane change or turn
around freely; jaywalking, free across the fence, bus
and taxi occupy the driving road when they stop,
individual car owners experience little friction,
buck-passing and so on. China is the most populous
country in the world, the effect of human factors on
traffic, relative to developed countries, is more
obvious, so under the special circumstances, the
research on human factors in urban traffic is very
important and urgent.
The paper departures from the practice of urban
traffic. It is to explore the impact on traffic and the
mechanism between human factors and traffic.
Through these studies we hope to provide some
reference for the formulation of transport policy.
2 RESEARCH METHODS
2.1 Existing Methods
(1) Analytic Hierarchy Process (AHP)
The AHP, which is short for "Analytic Hierarchy
Process", was first proposed by the America
operations research expert T.L.Satty in the 1970s in
the 20th century. This method was originally used in
the service sector. It is a Method of multi-objective
decision analysis that combined the qualitative
557
Du X. and Gou J..
THE RESEARCH ON HUMAN FACTORS IN URBAN TRAFFIC BASED ON THE CAUSAL RELATIONSHIP.
DOI: 10.5220/0003585805570562
In Proceedings of the 13th International Conference on Enterprise Information Systems (PMSS-2011), pages 557-562
ISBN: 978-989-8425-56-0
Copyright
c
2011 SCITEPRESS (Science and Technology Publications, Lda.)

analysis and quantitative calculation. The basic ideas
of the AHP method to solve problem are as follows
(Teng Shaoguang, 2005): Firstly, we decompose the
problem to be different factors according to the
nature of the problem and objectives to be achieved.
Secondly, we stratified the factors to be a
hierarchical structure model according to the
relationship between factors. Thirdly, we analyze the
problem in accordance with the level of the factors.
Last, we get the importance weights of the lowest
level of factors by reference to the highest (which is
the total goals) level of factors.
Teng Shaoguang used the AHP method to
construct a hierarchical structure of the factors that
influence the public traffic in his paper
“Comprehensive analysis of AHP for the factors
affecting the public transport". He proposed to
analyze the importance of various factors by the
AHP method t. At last he got the relative importance
of various factors and ranked them (Wang Hongyu,
2009).
(2) Structural Decomposition Analysis
The SDA, which is short for "Structure
Decomposition Analysis", was first proposed by
Leonfief the research on analysis of the American
input-output charts. SDA's basic idea is to divide the
change of one target variable into several changes of
different elements so that we can identify the degree
of the influence of the various elements. Besides, we
can also carry on the decomposition step by step
according to the need. Ultimately, we can
distinguish the influence degree of the target
variable of the various factors (Zhu Xianghua,
2008).
Both of the two methods above can quantify the
qualitative issue. We can use these two methods to
get the relative importance of the factors. It is
helpful to grasp the key factors, but the relationship
and the mechanism between these key factors are
not clear. It is negative for us to find the source of
the problem. So we have to introduce the causal
analysis method.
2.2 Method of Causality Analysis
At the process of exploring and understanding the
world, we always want to answer the 'why' question.
That is, we want to find the factors and information
to explain the phenomenon. Because of searching
the relatively constant causal mechanism under the
phenomenon, we have the possibility to get and
accumulate our knowledge. In general, the
development of social science research is always
around the "discovery issue", "understand the
problem" and "solve the problem ". As we know,
only the "discovery issue" is not enough to the
progressing of our society. And we should find the
factors under the phenomenon as the entry to solve
the problem. Given the validity of causal analysis
and Based on the conclusions of the causal analysis,
we can predict the future events that may occur
under what conditions and find the means of
controlling them, which provide the method to
develop strategies and to improve our society.
Therefore, causal analysis is the key to the social
science research (Wang Tianfu, 2006).
2.2.1 Introduction to Causality Diagram
Causal analysis is demonstrated through the
Causality Diagram, also known as the special causal
diagram, Fish Bone Figure and Tree Figure.
Causality Diagram is a mapping method to produce
the cause of the problem through the gradual in-
depth study. Causality Diagram establishes the
priorities of the cause of the problem based on the
causality relationship, and display them in the event
generation process, so as to make an intuitive
understanding of the problem for the project
managers. Causality Diagram is a method to find the
basic reason of the problem, each "fishbone"
represents the cause of the problem. A problem is
often caused by a variety of reasons, which can be
showed with the graph of trunk, large branches, the
branches and twigs according to their importance.
So we can understand the problems at a glance and
system. The Causality Diagramcan helps
policymaker’s analysis of the nature of the problem
in-depth, develop strategies and achieve the purpose
of pre-control.
The Causality Diagram applies for analysing the
causes of traffic problems, which has intuitive and
logical features and so on. What’s more, it can
analyze accident overall, analyze individual reasons
and even the specific case.
2.2.2 Making Causality Diagram
(1)Working group including Responsibility Person
for this issue and other human who have the
relations with it, Responsibility Person should have
rich instruction and leadership experience, Joint
effort from us should be taken to create the friendly,
equal, relaxed environment.
(2)The person in charge of the project will identify
ICEIS 2011 - 13th International Conference on Enterprise Information Systems
558

the causes of the problem, and then write on the
blackboard or a triangle box in the right of the White
paper. Meanwhile, draw a horizontal line in its tail
that is known as the backbone of the fish.
(3)Members of the working groupneed to draw the
lines which form45 angle with backbone, and they
are called big bones that is used explain the main
reason causing the problem.
(4)Further refinement of the cause of the problem,
and then draw the middle bone, small bone and so
on, as far as possible all the reasons listed.
(5)Schemata of causality need to be modified to
optimize the order
(6)According to the schemata of causality (Refer to
Picture 1) for discussion.
Figure 1: Causality Diagram.
The schemata of causality cannot solve problems
presented by numerical values, rather by the
arrangement of the level of cause and effect to
indicate the relationship. Therefore, it can well
describe the qualitative issues. When making the
schemata of causality of traffic problems, the
designer should pool the wisdom of the masses and
try to find the reasons causing the traffic accidents
whether large or small objectively and
comprehensively, then markers in the map.
Social research methods generally include
qualitative and quantitative research. Qualitative
research mainly uses interviews or documents and
materials by narrative techniques. Although the
number of samples is small, the information
involved when solving the research problems is
extensive and thorough. On the other hand,
quantitative research uses statistical analysis
methods by taking social survey data. The data of
the quantitative research is highly targeted though
the sample size is large. This research method
usually focuses on several specific aspects of some
object of study, and it hopes to draw some general
conclusions. The traffic is a complex system
consisting of many social factors which are difficult
to quantify, therefore, based on the large number of
documents and materials, we do only qualitative
research to the socio-cultural factors of traffic
problems by using Schemata of Causality.
3 THE CAUSAL RELATIONSHIP
BETWEEN URBA N
TRANSPORT AND HUMAN
FACTORS
3.1 Determine the Human Factors in
Urban Transportation
Transportation is “the blood circulation system” and
the bottleneck of Social and economic system. There
is of great theoretical and practical significance in
the research of transportation. So, transport
problems and the impact factors of traffic attract
many scholars’ attention (Liu Zhiping, 2005).
The current study of traffic distributes in
industrial theory, economics, urban studies, ecology,
geography, environmental science research.
However, the existing research is based on the
transport system, its elements and related
engineering studies, Traffic, especially the social
characteristics of urban traffic is of little concern.
Zhang Huimei said that: The traffic, as a
human instinct behaviour, has a human itarian
and social nature, and it is the content of human
life. In addition, he considered the current study
patterns cannot effectively ensure the sound
operation of traffic in the social systems, and it is
necessary to do social science research on transport
phenomenon (He Yuhong , Xing Yuanmei ,2004).
At present, some scholars began to study the
traffic problem from a sociological point of view.
Some scholars have proposed some solutions and
established precise mathematical models, but they
are all simulated in the ideal state. These models can
apply in the early case of less traffic in the city, but
the modern transport system is a complex system
with large random and many influence factors. So,
many scholars have studied traffic problems by
systems approach.
Wang Jian, from Southeast University, analyzed
the impact factors of passenger transportation in the
paper of "prediction of big city ’passenger
transportation structure" from the macro, meso and
micro level. These factors include economic
development, transport policy, transport and travel
THE RESEARCH ON HUMAN FACTORS IN URBAN TRAFFIC BASED ON THE CAUSAL RELATIONSHIP
559
characteristics, and etc (Wang Jian, 2006).
Gu Xiaomin, from ChangAn University,
analyzed the factors affecting the traffic capacity in
the paper of "Factors of urban road capacity "mainly
from the point of view of the transportation
infrastructure, traffic management and traffic
participants (Gu Xiaomin, 2009).
Wang Hongyu , in the paper of " Study of
Beijing Urban Transport " , analyzed the traffic
problems in Beijing from the perspective of car
ownership, mode of transportation, road layout,
traffic management, traffic participants’ quality and
level of civilization (Wang Hongyu, 2009).
Yuan Hongwei considered that in the road traffic
system, component of people, vehicles, roads and
environmental, people are the only independent
variable of the four elements. Therefore, people are
the core of the Transport system, and the studies of
traffic problems should focus on human factors
(Yuan Hongwei, 2006).
From these studies, we can extract the main
factors affecting the traffic: transport infrastructure,
human consciousness, the quality of traffic
participants (including education), transport culture,
transportation management, and traffic behaviour
and so on.
3.2 The Analysis of the Causal
Relationship between Traffic and
Human Factors
We've already introduced the main research
methods, proposed by current domestic scholars, on
traffic problems, such as Analytic Hierarchy
Process, Structure Decomposition Analysis. There
are also some scholars began to study the traffic
problems with causal analysis method.
On the basis of accessing to a large number of
documents and experts, Ye Xinna extracted the
reasons for causing a traffic accident and analyzed
the causes of traffic accidents by causal analysis
diagram and AHP in her paper of “Analysis of the
causes of Traffic Accidents based on causal analysis
diagram and AHP"(Ye Xinna, Yuan Hongchuan,
2008).
Pan Hai analyzed the common and basic cause
and effect diagram of transport system in the paper
of “The basic causal relationship four transport
system” .He also gave a new cause and effect
diagram of our transport system based on the current
situation and a lot of literature at home and abroad.
Based on the previous research, we believe that
the traffic is not only a transport and access systems,
but also a social system. Now people generally
agreed that traffic is made up of three parts: People,
vehicles and road, which is referred to 3S system.
People have a very significant effect on traffic.
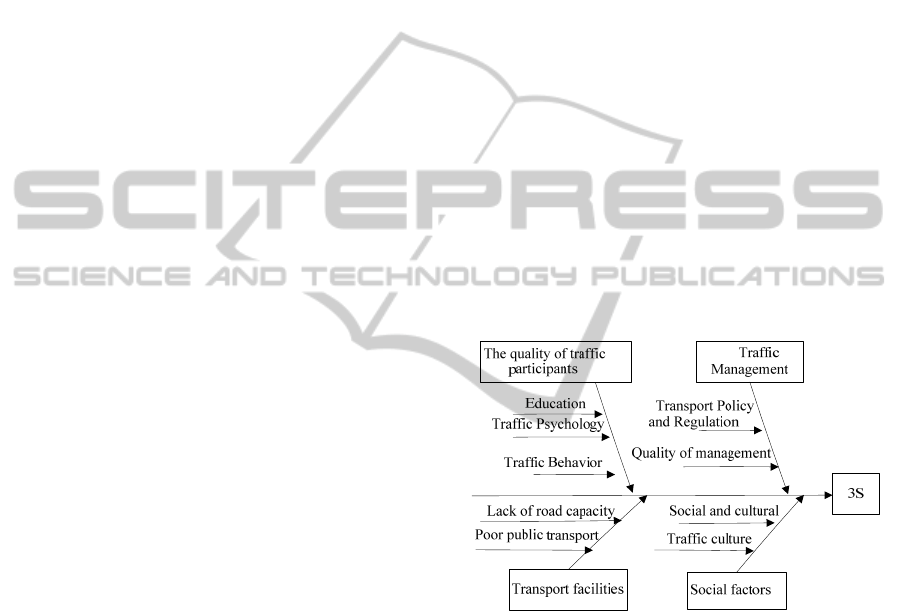
According to the method of fish bone diagram,
we have to draw the cause and effect diagram
between urban traffic and human factors. The “fish
head” of fish bone diagram said the problems to be
solved, that is, the problems the transport system
composed of people, vehicles, and road faced.
According to the foregoing, we can summarized the
cause of transportation problems as four categories
from a sociological point of view .That is the quality
of the traffic participants, traffic management,
Transport facilities and social factors. Each category
includes a number of possible factors, such as
education level, lack of road capacity, layout is
unreasonable, transport policies and regulations are
incomplete and so on. The reasons for the 4 class
and its related factors are distributed at the trend of
fish bones in order to form a fish bone analysis
chart. As figure 2 shows:
Figure 2: Cause and effect diagram of traffic factors.
It can be seen from the diagram that traffic
participants, traffic management, Transport
infrastructure, and social factors have an important
effect on the transportation system. But the
traditional fish bone diagram can only show the
causal relationship between the results and the
various elements, but cannot explain the relationship
between elements. So, we do some changes on the
traditional fish bone diagram in order to show the
causal relationship between each of the elements.
Arrows in the figure represent the direction of
causation, all influence are positive. Describing the
causal mechanism means the results of the action
process. We can divide Cause and effect diagram
ICEIS 2011 - 13th International Conference on Enterprise Information Systems
560
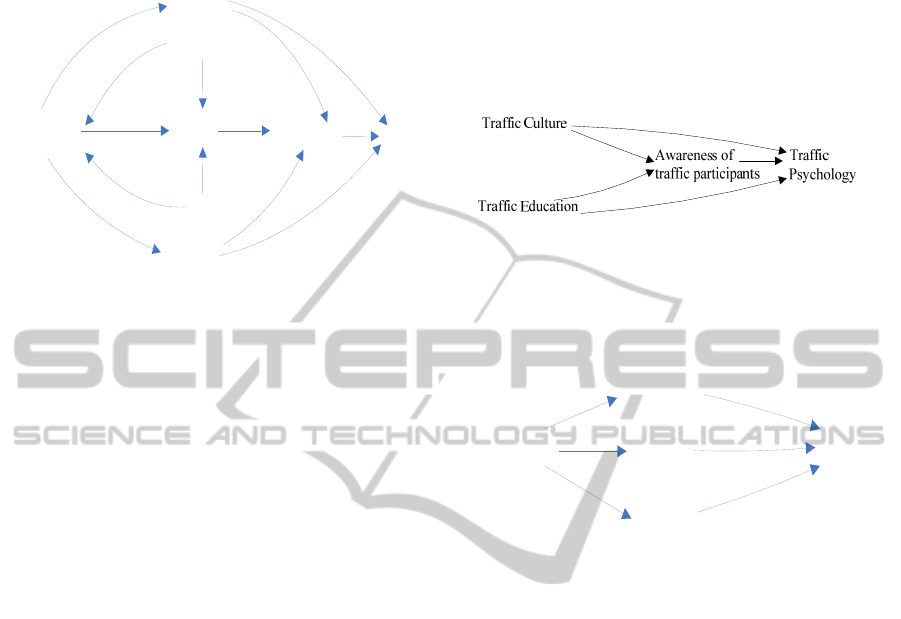
into is a number of causal chain, and choose two
chains to illustrate.
Transportfacilities
Awarenessof
Traffic
Traffic
Management
Trafficculture
Traffic
Psychology
Traffic
Education
Behaviour
3S
Figure 3: Improved cause and effect diagram of traffic
factors.
3.2.1 The Psychological Factors in Traffic
For a society, culture is the most powerful force of
habit. A media has published a story that A English
teacher in China across the street spend more than a
month. Every time the foreigner who took to the
streets faced the traffic whiz and had felt
overwhelmed, I do not know how to cross the road
safely. No matter whether there is a zebra crossing,
cars are rarely stopped; At the junctions with traffic
lights, regardless of red light or green light,
pedestrians often ignore, which made him cannot
decide whether to go.
In the first month, the foreigner across the road
all by the help of his girlfriend .However more than
a month later, the foreigner has been adapted to this
way of crossing the road, do the same as people
stroll the streets. This shows the level of culture and
cultural awareness of participants will affect traffic,
poor traffic culture is difficult to breed naturally
good traffic civic awareness, resulting in herd, the
bad luck of traffic psychology.
The level of education will also affect of
consciousness and psychology of traffic
participants. By collecting information and
observation we found that people with high levels of
education tend to have better traffic awareness and
traffic psychology.
Weak sense of traffic is bound to have adverse
psychological effects on the traffic. The poor
awareness of traffic is recognized as a fact by all. A
lot of people take traffic rules as child's play. For
example, we often run a red light. Red light running
has become a common social phenomenon, but the
frightening thing is that people mostly don’t feel
ashamed, and do not feel anything wrong. Some
large trucks don’t stop but sped away when they
meet the red light. Weak sense of traffic will
inevitably lead to bad traffic psychology, and thus
lead to bad traffic behaviour.
Figure 4: The psychological factors in traffic.
3.2.2 Influencing Factors of Traffic
Behaviour
Awareness of
Traffic
Participants
Traffic
Management
Traffic
Psychology
Transportfacilities
Traffic
Behaviour
Figure 5: The traffic behaviour in traffic.
Participants of Traffic include transportation
planners, decision makers, managers and
pedestrians. Traffic awareness of the participants
will be able to affect traffic behaviour through the
impact on traffic psychology, traffic management
and transport facilities, and ultimately affect the
entire transport system.
As everyone knows that many defects in
planning project decision mainly bring about
crowded traffic. Meanwhile, government policy-
makers are lack the knowledge about town planning
and predictability in some cities. For example, AS
parking phenomenon are not take into account, now
very many vehicles use parking spaces, which
disrupt the normal traffic order. It certainly reflects
that the transportation planners and decision-makers
should raise traffic awareness.
In addition, the occupation of roads and
sidewalks problems has not effectively solved. Many
new roads were soon occupied by kinds of vendors,
markets and vehicles parks in many cities, which
make lacking of roads worse and mainly leading to
many negative traffic behaviours.
THE RESEARCH ON HUMAN FACTORS IN URBAN TRAFFIC BASED ON THE CAUSAL RELATIONSHIP
561

To have good traffic behaviour, traffic
participants must improve traffic awareness, foster
good traffic psychology, develop the proper
transport planning and improve traffic management.
4 SUMMARIES AND OUTLOOK
Based on previous research, we summarized the
human factors of traffic from a sociological point of
view. such as: human consciousness, the quality of
participants in transportation, traffic culture, Traffic
management, and traffic behaviour and so on .Then
we figure out the causal relationship between human
factors and traffic by the Causal Analysis method.
Under the existing Hardware facilities of traffic,
we can largely alleviate the traffic problems through
the improvement and adjustment of these factors.
Though traffic hardware is important, the human
factor is equally important. Only control and
improve the both, can we really prescribe the right
medicine, and fundamentally solve the traffic
problems.
Due to Limited time and the capacity of author,
This paper only made a preliminary analysis on
urban transport from a qualitative point of view, but
doesn’t do further research from a quantitative point
of view. There still remain some deficiencies and
areas for improvement in this paper, and we will
improve it in theory Research and practical
application.
REFERENCES
Gu Xiaomin. 2009. Factors of Urban Road Capacity.
Chang An University of China.
Liu Zhiping. 2005. Urban Traffic Management and
Control System .Shandong University of China.
Teng Shaoguang. 2005. Comprehensive Analysis of
Influencing Factors by AHP on Public Transport .
Journal of urban public transport.
Wang Jian. 2006. The Prediction of City Passenger
Transportation Structure. Southeast University of
China.
Wang Hongyu. 2009. Beijing Urban Transport Research.
Central University for Nationalities.
Yuan Hongwei.2006. Psychology based on Pedestrian
Traffic Unsafe Behavior. Beijing Jiao tong University
of China.
Zhu Xianghua. 2008. Analysis Method of Urban
infrastructure investment results. Beijing Jiao tong
University of China.
He Yuhong, Xing Yuanmei. 2004. Traffic sociology.
Journal of Theory Monthly.
Wang Tianfu. 2006. Causal Analysis in Social Research.
Journal of Sociology.
Causality analysis. Badu Encyclopedia.
Http://baike.baidu.com/view/2399078.htm
Fan Xiaoke. 2007. Research on Urban Traffic Congestion.
Journal of China Public Security.
Ye Xinna, Yuan Hongchuan. 2008. AHP based on
causality analysis charts and Causes of Traffic
Accidents Law.
APPENDIX
This paper was supported by “the Fundamental
Research Funds for the Central Universities
(2009JBM030)”.
ICEIS 2011 - 13th International Conference on Enterprise Information Systems
562
