
SUCCESSFUL IMPLEMENTED THEORIES FOR REFERENCE
CLASS FORECASTING IN INDUSTRIAL FIELD
Dan Benţa, Lucia Rusu and Marius Ioan Podean
Faculty of Economics and Business Administration, Babeş-Bolyai University of Cluj-Napoca, Cluj-Napoca, Romania
Keywords: Risk management, Reference Class Forecasting, Utility function, Prospect theory, Implementation.
Abstract: Risk management process integration in project management plans is necessary to succeed in complex
projects. We structured our work in a conceptual background section and in our approach and results section
for a correct state of the problem and clearly present our implementation. The aim of this paper is to present
a deep literature review in terms of risk management roots and Reference Class Forecasting theories.
Results and analyzes from our industrial field are presented. This paper is the result of collaboration
between university and industrial field.
1 INTRODUCTION
Risk in plain usage is something going wrong and a
deviation from original plan. The Risk Management
Standard from Institute of Risk Management (PRM-
PMI®, 2009) defined risk as the combination of the
probability of an event and its consequences, with
risk management being concerned with both positive
and negative aspects of risk. Risk is gradually losing
the stigma of only being concerned with the negative
or downside. We now recognize the risk of us not
meeting our goals, a risk of missing an opportunity,
a risk of not recognising that something good is
happening. This is the positive, upside of risk,
evident in the widely used ‘risk/return’ tradeoff. If
there is no risk, there is often little return, and there
is often a higher return when the risk is higher
(Collier, 2009).
In this work we present risk management roots
and theories behind reference class forecasting.
Experimental results from our experience and
implementation are also presented.
After a brief overview of risk management
theories and roots, we present our approach and
implementation in a real business environement. In
our case, Reference Class Forecasting theories as
part of risk management field, helped in prognosis of
a current project based on past experiences in order
to deliver the project in predefined costs, time and
quality.
Our research focuses on probability theory and
makes a brief overview of utility theory (Bernoulli,
1954), (Hogarth, 1987) and prospect theory
(Kahneman, 1979a), (Kahneman, 1979b) as main
roots and influences for risk management.
As projects are unique in time and trajectory,
another main aspect of risk management is the
uncertainty which is inevitable in a project; from
this reason, a proactive risk management is the key
to succeed in complex projects.
In first part of this paper we provide conceptual
background and theories behind our work. Next
section is for our approach and implementation.
Finally, relevant conclusions and future work are
presented.
2 CONCEPTUAL BACKGROUND
In (Garvey, 2009), authors identify that probability
theory is the formal study of events whose outcomes
are uncertain. Its origins trace to 17th-century
gambling problems. Games that involved playing
cards, roulette wheels, and dice provided
mathematicians with a host of interesting problems.
The solutions for many of these problems
yielded the first principles of modern probability
theory. Today, probability theory is of fundamental
importance in science, engineering, and business
(Garvey, 2009).
2.1 Utility Function
In our previous work (Podean et al, 2010), we
43
Ben¸ta D., Rusu L. and Podean M..
SUCCESSFUL IMPLEMENTED THEORIES FOR REFERENCE CLASS FORECASTING IN INDUSTRIAL FIELD.
DOI: 10.5220/0003514200430046
In Proceedings of the International Conference on e-Business (ICE-B-2011), pages 43-46
ISBN: 978-989-8425-70-6
Copyright
c
2011 SCITEPRESS (Science and Technology Publications, Lda.)

comprehensively described a structured
methodology that focuses on minimizing and
mitigating project specific delay risks and
highlighted that based on utility function, milestones
during project and/or the end of projects or
programme may be categorized in what are called
soft-deadline and hard-deadline (Podean et al, 2010).
In contrast with the soft-end projects, the hard-
end projects posses a decrease of utility function
with a vertical asymptote character around the
deadline for project completion. In extreme
situations, the utility function itself may fall under
zero (projects may generate losses to both
constructor and customer). Existing risk analysis
methodologies observe risks from monetary terms.
The typical risks are correlated with an increase in
final project costs. In order to estimate hard-deadline
milestones and/or end of projects or programme is
critical to employ the time dimension rather than the
typical cost-based risk analysis. Economists
distinguish between cardinal utility and ordinal
utility, the last being a rank-comparison of: options,
contracts, projects, execution quality etc. In risk
assessment activities, customer made already a
decision that company “YZ” is executing the
project. Therefore, the cardinal utility function over
time is more appropriate, while ordinal utility may
captures only ranking and not strength of
preferences (Podean et al, 2010).
2.2 Prospect Theory
The prospect theory was defined by Daniel
Kahneman and Amos Tversky (Kahneman, 1979a),
(Kahneman, 1979b) and is the basic theory in
Reference Class Forecasting.
Reference Class Forecasting for a particular
project requires the following three steps (Flyvbjerg,
2007):
Identification of a relevant reference class of
past, similar projects. The class must be broad
enough to be statistically meaningful, but
narrow enough to be truly comparable with
the specific project;
Establishing a Probability distribution for the
selected reference class. This requires access
to credible, empirical data for a sufficient
number of projects within the reference class
to make statistically meaningful conclusions;
Comparing the specific project with the
reference class distribution, in order to
establish the most likely outcome for the
specific project.
Those theories, that helped Kahneman win the
2002 Nobel Prize in Economics, are based on
some well-observed deviations from rationality,
including the following (Damodaran, 2008),
(Kahneman, 1979a), (Kahneman, 1979b):
Framing: Decisions often seem to be affected by
the way choices are framed, rather than the
choices themselves;
Nonlinear Preferences: If an individual prefers
A to B, B to C, and then C to A, she is violating
one of the key axioms of standard preference
theory (transitivity). In the real world, this type
of behavior is common;
Risk Aversion and Risk Seeking: Individuals
often simultaneously exhibit risk aversion in
some of their actions while seeking out risk in
others;
Source: The mechanism through which
information is delivered may matter, even if the
product or service is identical. For instance,
people will pay more for a good, based on how it
is packaged, than for an identical good, even
though they plan to discard the packaging
instantly after the purchase;
Loss Aversion: Individuals seem to feel more
pain from losses than from equivalent gains.
Individuals will often be more willing to accept a
gamble with uncertainty and an expected loss
than a guaranteed loss of the same amount, in
clear violation of basic risk-aversion tenets.
In his paper, (Flyvbjerg, 2007) agrees that when
contemplating what planners can do to improve
decision making, we need to distinguish between
two fundamentally different situations: (1) planners
and promoters consider it important to get forecasts
of costs, benefits, and risks right, and (2) planners
and promoters do not consider it important to get
forecasts right, because optimistic forecasts are seen
as a necessary means to getting projects started.
Kahneman and Tversky (Kahneman, 1979a),
(Kahneman, 1979b) replaced the utility function,
which defines utility as a function of wealth, with a
value function, with value defined as deviations
from a reference point that allows for different
functions for gains and losses. In keeping with
observed loss aversion, for instance (Damodaran,
2008), the value function for losses was much
steeper (and convex) than the value function for
gains (and concave) as presented in Figure 1.
The implication is that how individuals behave
will depend on how a problem is framed, with the
decision being different if the outcome is framed
relative to a reference point to make it look like a
gain as opposed to a different reference point to
ICE-B 2011 - International Conference on e-Business
44
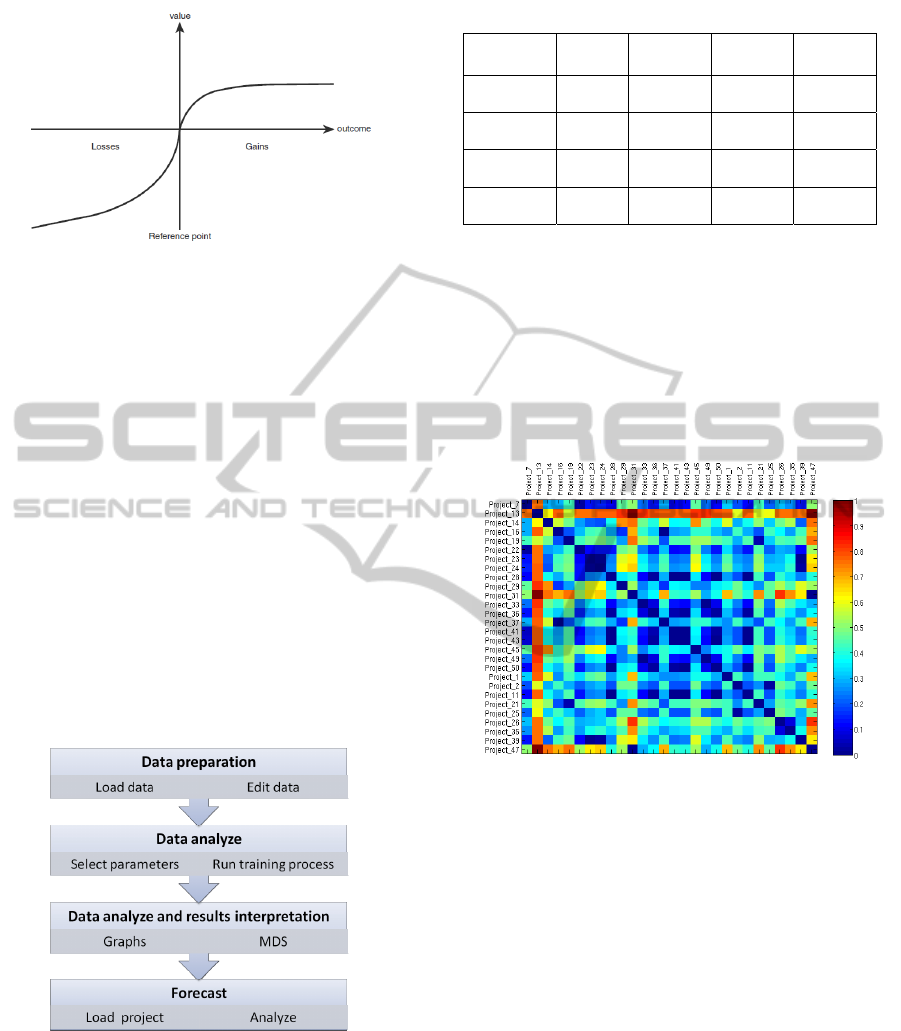
Figure 1: A Loss Aversion Function (Damodaran, 2008).
convert it into a loss. Stated in terms of risk aversion
coefficients, Kahneman and Tversky assumed that
risk aversion coefficients behave differently for
upside than downside risk (Damodaran, 2008).
3 OUR APPROACH
AND RESULTS
Starting from Reference Class Forecasting theories
we developed a software application to estimate
delays in complex projects. We applied our
approach in industrial field, in energy sector. We
analyzes past projects, identify relevant features for
implemented projects and based on past experience
we provide realistic paths for a current project.
The application workflow is presented in the
following paragraphs.
Figure 2: Our application workflow.
We developed a modular UNIX based
application with high portability. Application
workflow is presented in Figure 2. In first step of the
application the user is allowed to load dataset with
projects and features. Our template for dataset is
presented in Table 1.
In this first step, minor modifications in dataset
Table 1: Dataset structure template.
Project
Name
Char1 Char2 … CharM
Project1 1x1 1x2 … 1xM
Project2 2x1 2x2 … 2xM
… … … … …
ProjectN Nx1 Nx2 … NxM
can be performed in order to have a clear dataset.
Next step is for data analyze where the training
process starts after a selection of max number of
neighbors and number of iterations of a random
assessment when using singular features. The
training process starts and relevant results and
graphics are presented. In our case, the algorithms
behind were implemented in Matlab and a relevant
graphic is presented in Figure 3.
Figure 3: Dissimilarity matrix.
Dissimilarity matrix displays the distance
between each two projects. The matrix is generated
after all features analyses and after identification of
most relevant features. In our case, a project was
defined by a set of hundreds of features and we
identified significant features for projects to correct
manage them.
After data analyze and results interpretation step,
the application generates the Multidimensional
scaling (MDS) representation (Figure 4) with
projects grouped in on-time and delayed, and
provides tools to load a new “unknown” project to
compare and based on delays features it can be
positioned on closest class.
SUCCESSFUL IMPLEMENTED THEORIES FOR REFERENCE CLASS FORECASTING IN INDUSTRIAL FIELD
45

Figure 4: Multidimensional Scaling representation.
4 CONCLUSIONS
We consider our approach essential in order to
deliver projects in predefined costs and to avoid
delays by identifying relevant features that may
influence the project in a negative manner.
This approach supports Project and Risk
Management department to analyze and forecast
risks in future or existing projects in terms of delays.
Our approach improves the existing methodology by
introducing a feature selection learning step and this
tool is well designed to find the closest k
observations in the training set and to predict the
class of the "unknown" project profile by majority of
vote (the winning label of the neighbors).
A Reference Class Forecasting approach helps
project managers and stakeholders to estimate
potential risks and costs in a more realistic way and
to provide alternative paths.
Based on past experiences, this analyse provides
assistance in decisions on whether to implement or
not a project.
Results and interpretation for results are
presented in a detailed manner. We consider an
efficient approach that can be applied and adapted in
different fields.
We have developed a complex application for
risk management using reference class forecasting
that fits in the company structure and behaviour.
As subject for our future work, we intend to use
this approach in different fields. We also performed
several tests in financial sector and in large
investments projects to provide realistic paths, to
clearly identify things that can go wrong and to
highlight relevant features for a project to succeed.
ACKNOWLEDGEMENTS
This paper was supported by Romanian National
Authority for Scientific Research under the grant no.
PN2 92-100/2008 SICOMAP.
REFERENCES
Bernoulli, D., 1954. Exposition of New Theory on the
Measurement of Risk, Econometrica, 22, pp.23-36.
Collier, P. M., 2009. Fundamentals of Risk Management
for Accountants and Managers, Tools and Techniques,
Elsevier, ISBN–13: 978-0-7506-8650-1.
Damodaran, A., 2008. Why Do We Care About Risk?,
Strategic risk management. A Framework for risk
management, USA, New Jersey: Pearson Education,
Inc., pp.11-35.
Flyvbjerg, B., 2007. Eliminating Bias through Reference
Class Forecasting and Good Governance, Concept
Report No 17 Chapter 6, Concept-programmet.
Garvey, P. R., 2009. Elements of Probability Theory in
Analytical methods for risk management: a systems
engineering perspective, USA: Taylor & Francis
Group, LLC, pp.13-39.
Hogarth, R. M., 1987. Judgement and choice: The
psychology of decision. (2nd edition). Chichester,
England: John Wiley & Sons.
Kahneman, D., Tversky, A., 1979. Prospect theory: An
analysis of decisions under risk, Econometrica, 47, pp.
313-327.
Kahneman, D., Tversky, A., 1979. Intuitive Prediction:
Biases and Corrective Procedures, Studies in the
Management Sciences: Forecasting, 12, Amsterdam,
North Holland: S. Makridakis and S. C. Wheelwright,
Eds.
Podean, M.I., Benta, D., Mircean, C., 2010. Overlapping
boundaries of the project time management and
project risk management, Informatica Economică vol.
14, no. 4/2010, pp.156-163, Bucharest: INFOREC
Association.
PRM-PMI®, 2009. Practice standard for Project Risk
Management, Project Management Institute, Inc.
ICE-B 2011 - International Conference on e-Business
46
