
MODELING AND ANALYSIS OF A POWER LINE
COMMUNICATION NETWORK SUBJECT TO CHANNEL
FAILURE
Shensheng Tang
Dept. of Engineering Technology, Missouri Western State University, St. Joseph, MO 64507, U.S.A.
Yi Xie
Dept. of Elec. and Comm. Engineering, Sun Yat-Sen University, Guangzhou, 510006, China
Keywords: Power line communication (PLC), Performance modeling, Markov Process, Channel failure.
Abstract: Power line communication (PLC) is a promising technique for information transmission using existing
power lines. We analytically model a finite-source PLC network subject to noise/disturbance and evaluate
its call-level performance through a queuing theoretic framework. The proposed PLC network model
consists of a base station (BS), which is located at a transformer station and connected to the backbone
communication networks, and a number of subscriber stations that are interconnected with each other and
with the BS via the power line transmission medium. An orthogonal frequency division multiplexing
(OFDM) based transmission technique is assumed to be used for providing the transmission channels in a
frequency spectrum. The channels are subject to failure during service due to noise/disturbance. When a
channel is in failure, its associated call will wait at the channel until the channel is recovered. We model this
process and determine the steady-state solution and derive several performance metrics of interest.
Numerical and simulation results are presented for the purpose of performance evaluation. The proposed
modeling method can be used for evaluation and design of future PLC networks.
1 INTRODUCTION
Power line communication (PLC) is a promising
technique for information transmission using
existing power lines. PLC technologies can be used
in an inside-building low voltage environment, a
short-distance medium voltage environment, or a
long-distance high voltage environment. Mixed
high-voltage, medium-voltage, and low-voltage
power supply networks could be bridged to form
very large networks for communications, as
alternative telecommunication networks.
The great advantage of PLC is that the power
lines exist in every home and every room. For
example, a computer would need only to plug a BPL
“modem” into any outlet in an equipped building to
have high-speed Internet access. Therefore, huge
cost of running wires such as Ethernet in many
buildings can be saved. However, there are still lots
of challenges for implementation in reality. Since
the power line network has originally been designed
for electricity distribution, rather than for data
transfer, the power line as communication channel
has various noise and disturbance characteristics,
resulting in an unreliable channel. Many factors,
such as channel attenuation, white noise, RF noise
from nearby radio transmitters, impulse noise from
electrical machines and relays, may cause the
channel unreliability.
In practice the impact of RF noise on a channel
can be reduced significantly with OFDM.
(Stantcheva, Begain, Hrasnica, and Lehnert, 2000).
Based on the measurements reported in
(Zimmerman and Dostert, 2002), the noise in the
power line communication channels is categorized
in five types, where the last type (i.e., asynchronous
impulsive noise) is the most unfavorable one and
makes more difficulties to the power line channels.
184
Tang S. and Xie Y..
MODELING AND ANALYSIS OF A POWER LINE COMMUNICATION NETWORK SUBJECT TO CHANNEL FAILURE.
DOI: 10.5220/0003475101840189
In Proceedings of the 13th International Conference on Enterprise Information Systems (ICEIS-2011), pages 184-189
ISBN: 978-989-8425-55-3
Copyright
c
2011 SCITEPRESS (Science and Technology Publications, Lda.)

The power spectral density of this type of noise can
reach values of more than 50dB above the
background noise.
Much research PLC has been developed in the
past a few years. The focused topics include MAC
(medium access control) protocols (Hrasnica and
Haidine, 2000), noise and channel modeling
(Zimmerman and Dostert, 2002), (Katayama,
Yamazato, and Okada, 2006), modulation and
multiple access techniques (Haring and Vinck,
2000), (Amirshahi, Navidpour, and Kavehrad,
2006), or modem design (Yu, Yu, and Lee, 2003). In
(Hrasnica and Haidine, 2000), some reservation
MAC protocols were proposed for the PLC network
which provides collision free data transmission. A
simulation model was developed for the study of the
PLC MAC layer that includes different disturbance
scenarios. In (Zimmerman and Dostert, 2002), it was
examined that the impulsive noise introduces
significant time variance into the powerline channel.
Spectral analysis and time-domain analysis of
impulsive noise were presented in details. In
(Katayama, Yamazato, and Okada, 2006), a
mathematically tractable model of narrowband
power line noise was introduced based on
experimental measurements. With the assumption of
Gaussian noise with instantaneous variance of a
periodic time function, the cyclostationary features
of power line noise can be described in close form.
The performance of the OFDM transmission
scheme corrupted by impulsive noise was analyzed
in (Haring and Vinck, 2000). It showed that the
Gaussian noise OFDM receiver in an impulsive
noise environment causes strong performance
degradation, and proposed an iterative algorithm to
mitigate the influence of the impulsive noise. In
(Amirshahi, Navidpour, and Kavehrad, 2006), the
bit error rate performance of the OFDM system
under impulsive noise and frequency selective
fading was analyzed and closed form formulas were
derived. In (Yu, Yu, and Lee, 2003), a PLC modem
applicable to central monitoring and control systems
was designed by using a multicarrier CPFSK
modulation with adaptive impedance matching.
All the above research was done at the link level
or component level. Very little research studied the
performance at the system level. In this paper, we
study the call-level performance of PLC networks at
the system level through through a queuing theoretic
framework. The proposed PLC network model
consists of a base station (BS), which is located at a
transformer station and connected to the backbone
communication networks, and a number of
subscriber stations (SSs) that are interconnected with
each other and with the BS via the power lines. An
OFDM based transmission technique is assumed to
be used for providing the transmission channels in a
frequency spectrum, which is divided into a set of
narrowband subcarriers (or subchannels). The
subchannels are subject to failure during service due
to the noise/disturbance on the power lines.
When a channel is in failure, its associated call
will wait at the channel until the channel is
recovered (i.e., the noise/disturbance is gone), then
the call continues its service. The failure events in
different subchannels are independent due to the flat
fading characteristic in each divided subchannel.
The remainder of the paper is organized as
follows. Section 2 presents the system description.
Section 3 develops a two-dimensional Markovian
model for performance analysis. Section 4 derives
several performance metrics of interest. Section 5
presents numerical and simulation results. Finally,
the paper is concluded in Section 6.
2 SYSTEM DESCRIPTION
Consider a PLC access network in the range of a
low-voltage power supply network, as shown in Fig.
1. It consists of a BS that is connected to a backbone
telecommunication network and a number of SSs
that are interconnected with each other and with the
BS via the power lines. The transformer station
distributes power to the covered low-voltage power
supply network and receives power from a medium-
voltage or high-voltage power supply network.
When an SS is located near the BS, the
communication can be organized directly between
the SS and the BS. Otherwise, one or more repeaters
(RPs) may be required inside the network to
compensate for signal attenuation.
Figure 1: A PLC network architecture.
MODELING AND ANALYSIS OF A POWER LINE COMMUNICATION NETWORK SUBJECT TO CHANNEL
FAILURE
185

The BS is an access point for communications
between an SS of the PLC network and a user of an
external network, and for communications between
the SSs inside the PLC network. The signal
transmission directions in a PLC network include
downlink — from the BS to the SSs and uplink —
from an SS to the BS. In the downlink, the BS sends
a transmission signal to all the SSs in the PLC
network. In the uplink, a signal sent by an SS can
not only be received by the BS, but also be received
by all other SSs. Hence, the PLC access network
holds a logical bus topology, where a set of SSs are
connected via a shared communication media —
power line, called bus. This type of network may
have problems when two or more SSs want to
transmit at the same time on the same bus. Hence,
some scheme of collision handling or collision
avoidance is required for communications, such as
carrier sense multiple access (CSMA) or an access
control by the BS. The latter is assumed here.
The OFDM is recommended by ITU-T G.hn as
the modulation scheme for PLC networks due to the
fact that it can cope with frequency selectivity (or
time dispersion) — the most distinct property of
power line channel, without complex equalization
filters. Moreover, OFDM can perform better than
single carrier modulation in the presence of
impulsive noise, because it spreads the effect of
impulsive noise over multiple subcarriers. The
available spectrum is divided into a set of
narrowband subcarriers (or subchannels), which are
overlapping in frequency and orthogonal in time.
We assume that these channels are all traffic
channels, without including any control channels.
The signalling control is assumed to be ideal and is
not discussed here.
As mentioned in Section 1, the impulsive noise
introduces significant time variance into the power
line channel, which indicates a high likelihood of bit
or even burst errors for digital communications over
power lines. The statistics of the measured
interarrival times of impulsive noise above 200ms
follows an exponential distribution. For this sake, in
(Hrasnica and Haidine, 2000), the channel was
modelled by a Markovian chain with two states, T
on
and T
off
, represented by two exponentially
distributed random variables, where T
on
denotes the
absence of impulses and the channel is available for
utilization, and T
off
denotes the duration that the
channel is disturbed by an impulse and no
information transmission is possible.
The BS knows about the occupancy status of the
channels. The BS allocates the available channels to
the requested calls from the SSs. When a requested
call arrives, it will enter the system if there is a
channel available; otherwise, it will be rejected.
Note that the channels are subject to failure
during service due to the noise/disturbance. The
failure events in different channels are independent
and identically-distributed (i.i.d.). When a channel is
in failure, the associated call will wait at the channel
until the channel is recovered. Once the failed
channel is recovered, the waiting call will continue
its service immediately.
3 PERFORMANCE ANALYSIS
For the above PLC network with N SSs and m traffic
channels, we assume that the arrival process of an
individual idle SS is a Poisson process with rate λ.
The channel holding time of a call is exponentially
distributed with mean 1/μ. We further assume that
each call occupies one channel for simplicity.
Due to noise/disturbance, the channel may be
subject to failure. We assume that the occurrence of
channel failures follows a Poisson process with rate
α, i.e., the interarrival time of the failure events
follows exponentially distributed with mean 1/α. In
each failure event, it is assumed that the remaining
duration (i.e., the recovery time) is exponentially
distributed with mean 1/β.
Let X(t) denote the number of failed channels at
time t. Similarly, let Y(t) be the number of calls
being served at time t. The process (X(t),Y(t)) is a
two-dimensional Markov process with state diagram
shown in Fig. 2 and state space
S = { (i, j) | 0 ≤ i ≤ m, 0 ≤ j ≤ m-i }.
Figure 2: The state diagram of the PLC network.
ICEIS 2011 - 13th International Conference on Enterprise Information Systems
186

We denote the transition rate from state
),( ji
to
)','( ji
by
','
,
ji
ji
T
and specify the different transition
rates as follows.
⎩
⎨
⎧
−<≤−≤≤−−
=
+
.,0
,0,10,)(
1,
,
otherwise
imjmijiN
T
ji
ji
λ
(1)
⎩
⎨
⎧
−≤≤−≤≤
=
−
.,0
,1,10,
1,
,
otherwise
imjmij
T
ji
ji
μ
(2)
⎩
⎨
⎧
−≤≤−≤≤
=
−+
.,0
,1,10,
1,1
,
otherwise
imjmij
T
ji
ji
α
(3)
⎩
⎨
⎧
−≤≤≤≤
=
+−
.,0
,0,1,
1,1
,
otherwise
imjmii
T
ji
ji
β
(4)
Let π(i, j) denote the steady-state probability that
the PLC network is at state (i, j). The global balance
equations of the system are given as follows:
,0,0
,)1)(1,1()1)(1,(
)1)(1,1()1)(1,(
])())[(,(
imjmi
jjijji
ijijiNji
ijjiNji
−<≤<≤
++−++++
+−+++−−−=
+++−−
απμπ
βπλπ
β
α
μ
λ
π
(5)
,,0
,)1)(1,1()1)(1,1(
)1)(1,(])()[,(
imjmi
ijijji
jiNjiijji
−=≤≤
+−++++−+
+−−
−
=++
βπαπ
λ
π
β
α
μ
π
(6)
where
0
ˆ
)1,( =−i
π
,
0
ˆ
),1( =− j
π
, and
0
ˆ
),(
=
ji
π
if
m
j
i >+
.
The above equations contain (m+1)(m+2)/2
unknowns, i.e., the probabilities
),( ji
π
with
mi ≤≤0
and
imj
−
≤≤0
. But there are only
m(m+1)/2 independent equations in the above
equations. Thus, (m+1) more equations are required
to solve the problem.
Observing the structure of Fig. 2, it is found that
only the first row exists if α = 0 and β = 0.
Therefore, we can determine a set of particular
solutions, π(0, j), j = 1, 2, …, m, as follows.
.,,2,1),0,0(),0( mj
j
N
j
j
"=
⎟
⎟
⎠
⎞
⎜
⎜
⎝
⎛
⎟
⎟
⎠
⎞
⎜
⎜
⎝
⎛
=
π
μ
λ
π
(7)
The final equation is provided by the
normalization condition:
.1),(
00
∑∑
=
−
=
=
m
i
im
j
ji
π
(8)
Equations (5), (6), (7), and (8) are sufficient to
evaluate the state probabilities π(i, j), 0 ≤ i ≤ m, 0 ≤ j
≤ m - i.
4 PERFORMANCE METRICS
4.1 The Probability That All Channels
Are Not Available
The probability that all channels are not available
(either in service or in failure), denoted by P
ex
, is the
sum of the state probabilities with i + j = m, 0 ≤ i ≤
m. This event is seen by an external observer.
.),(
0
∑
=
−=
m
i
ex
imiP
π
(9)
4.2 The Probability That an Arriving
Call Sees All Channels Not
Available
The probability that an arriving call sees all channels
not available (either in service or in failure), denoted
by P
in
, is the probability that the initiating SS finds
all channels not available when placing a call
request. This metric is similar to P
ex
except that the
observer is an internal source. Note that the
proposed model is a finite source system, the
PASTA property does not hold. By using the arrival
theorem (Kobayashi and Mark, 2009), the P
in
is
obtained by replacing N with N -1 in (9).
,),(
0
]1[
∑
=
−
−=
m
i
Nin
imiP
π
(10)
where
),(
]1[
ji
N −
π
means the steady state probability
at (i, j) when the total number of SSs in the network
is N-1. Following this notation, the equation (9) can
be re-written as
.),(
0
][
∑
=
−=
m
i
Nex
imiP
π
4.3 The Mean System Throughput
The mean system throughput, denoted by T
sys
, is
defined as the mean number of calls being served
per unit time. Thus, we have
.),(
1
0
][
1
∑∑
−
=
−
=
=
m
i
N
im
j
sys
jijT
πμ
(11)
4.4 The Mean Number of Channels in
Failure
The mean number of channels in failure, denoted by
N
cf
, is defined as the mean number of failed channels
in steady state. Thus, we have
MODELING AND ANALYSIS OF A POWER LINE COMMUNICATION NETWORK SUBJECT TO CHANNEL
FAILURE
187
.),(
1
][
0
∑∑
=
−
=
=
m
i
N
im
j
cf
jiiN
π
(12)
4.5 The Mean Number of Calls Being
Served
The mean number of calls being served, denoted by
N
bs
, is defined as the mean number of calls in service
in steady state. Thus, we have
.),(
1
0
][
1
∑∑
−
=
−
=
=
m
i
N
im
j
bs
jijN
π
(13)
5 NUMERICAL RESULTS
In this section, we present the numerical results in
the following configuration: N = 40 or 60, m = 10.
The arrival rate λ changes from 1 to 8. The other
parameters μ, α, and β are set separately with
variable values in each figure. Note that all
parameters are given in dimensionless units, which
can be mapped to specific units of measurement.
To validate our analysis, we also developed a
discrete-event simulator for the proposed model. The
simulation was implemented in MATLAB. For
convenient illustration, we only show one group of
simulation results as a comparison. In the illustrated
figures, an excellent match between the analysis and
simulation can be observed. Each simulated data
point was averaged over 5,000 trials and the
associated 95% confidence intervals were computed.
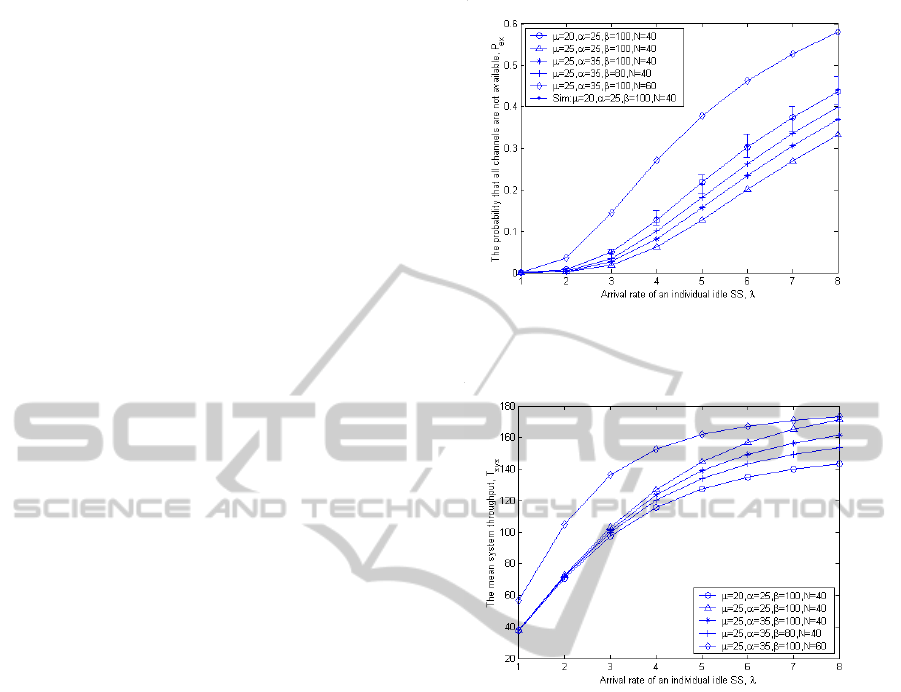
Fig. 3 shows how the probability P
ex
changes
with respect to various parameters. We observe that
P
ex
increases with the increase of call arrival rate λ
or the service time 1/μ. As λ increases, the system is
easier to get full channel occupancy. As the service
time increases, the system becomes more difficult to
release a channel. In our parameter configuration,
we also observe that P
ex
displays different trends
with respect to α and β. The increase of the channel
failure rate or the required recovery time delays the
channel availability to the initiating call requests.
In Fig. 3, we also observe that P
ex
increases with
the increase of the network population N. When N
increases, the total call arrivals to the system per unit
time will increase and the system will be easier to
get full channel occupancy. The performance of P
in
is similar to that of P
ex
. Due to space limitation, we
omit the figures here.
Fig. 4 shows how the mean system throughput
T
sys
changes with respect to various parameters. We
observe that T
sys
increases with the increase of λ, μ,
or N. As λ, μ, or N increases, the mean number of
Figure 3: The probability that all channels are not
available.
Figure 4: The mean system throughput.
calls entering the system or the mean number of
calls processed per unit time will be increased. We
also observe that T
sys
decreases with the increase of
channel failure rate or the required recovery time. A
more frequent channel failure event or a longer
required recovery time will negatively affect the
performance of the system throughput.
Fig. 5 shows how the mean number of failed
channels N
cf
changes with various parameters. We
observe that N
cf
increases with the increase of λ or N,
and decreases with the increase of μ. As λ or N
increases, more calls occupy the channels per unit
time, leading to more channels subject to failure.
Note that in our model, it is assumed that the
channels are subject to failure during service. We do
not consider the failure events for idle channels due
to no calls being served (although there is a little
impact to an initiating call that happens to access an
idle channel being in failure). As μ increases, a call
completes its service in shorter duration, reducing
the chance for a call to encounter a channel failure
event. We also observe that N
cf
increases with the
ICEIS 2011 - 13th International Conference on Enterprise Information Systems
188
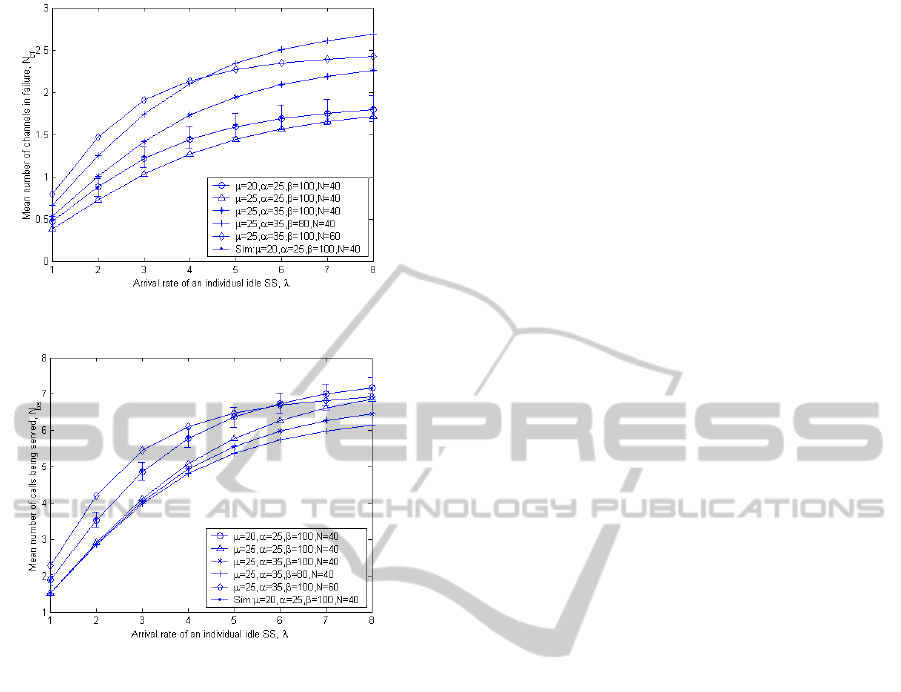
Figure 5: The mean number of channels in failure.
Figure 6: The mean number of calls being served.
increase of channel failure rate or the required
recovery time. The reason is obvious.
Fig. 6 shows how the mean number of calls being
served N
bs
changes with various parameters. We
observe that N
bs
increases with the increase of λ or
N, and decreases with the increase of μ. This agrees
with our intuition. As λ or N increases, a snapshot in
steady state will capture more calls being served. On
the other hand, the larger μ means the faster
processing rate, leading to less calls in service
captured by a snapshot. We also observe that N
bs
decreases with the increase of channel failure rate α
or the required recovery time 1/β. As α is increased
or β is decreased, a snapshot in steady state will
capture less calls being served.
6 CONCLUSIONS
We analytically modeled a PLC network with finite
population and evaluate its performance at the call-
level through a queuing theoretic framework. The
call subject to channel failure holds at the channel
until the channel is recovered. The channels
obtained from an OFDM based transmission
technique are subject to failure during service due to
noise/disturbance. We determined the steady-state
solution of the proposed model and derived several
performance metrics of interest. Numerical and
simulation results are presented to show the impact
of system parameters on the performance metrics.
The proposed modeling method and the derived
metrics can be used for evaluation and design of
future PLC networks.
REFERENCES
Stantcheva, M., Begain, K., Hrasnica, H., Lehnert, R.,
2000. Suitable MAC protocols for an OFDM based
PLC network. 4
th
Int’l Symposium on Power-Line
Communications and its Applications.
Zimmerman, M., Dostert, K., 2002. Analysis and
modeling of impulsive noise in broad-band powerline
communications. IEEE Trans. on Electromagnetic
Compatibility, vol. 44, pp. 249–258.
Hrasnica, H., Haidine, A., 2000. Modeling MAC layer for
powerline communications networks. 4th Int’l
Symposium on Power-Line Communications and its
Applications.
Katayama, K., Yamazato, T., Okada, H., 2006. A
mathematical model of noise in narrowband power
line communication systems. IEEE J. Selected Areas
in Comm., vol. 24, pp. 1267–1276.
Haring, J., Vinck, H., 2000. OFDM transmission corrupted
by impulsive noise. 4th Int’l Symposium on Power-
Line Communications and its Applications.
Amirshahi, P., Navidpour, S., Kavehrad, M., 2006.
Performance analysis of OFDM broadband
communications system over low voltage powerline
with impulsive noise. IEEE ICC’06, pp. 367–372.
Yu, J., Yu, H., Lee, Y.-H., 2003. Design of a power-line
modem for monitoring and control systems. 7th Int’l
Symposium on Power-Line Communications and its
Applications.
Kobayashi, H., Mark, B.L., 2009. System modeling and
analysis: foundations of system performance
evaluation. Upper Saddle River, NJ: Pearson.
MODELING AND ANALYSIS OF A POWER LINE COMMUNICATION NETWORK SUBJECT TO CHANNEL
FAILURE
189
