
A NON-LINEAR QUANTITATIVE EVALUATION APPROACH
FOR DISPARITY ESTIMATION
Pareto Dominance Applied in Stereo Vision
Ivan Cabezas and Maria Trujillo
School of Systems Engineering and Computer Sciences, Universidad del Valle, Ciudadela Universitaria, Cali, Colombia
Keywords: Computer vision, Stereo correspondence, Disparity estimation, Pareto dominance, Pareto optimal set.
Abstract: Performance evaluation of vision algorithms is a necessary step during a research process. It may supports
inter and intra technique comparisons. A fair evaluation process requires of a methodology. Disparity
estimation evaluation involves multiple aspects. However, conventional approaches rely on the use of a
single value as an indicator of comparative performance. In this paper a non-linear quantitative evaluation
approach for disparity estimation is introduced. It is supported by Pareto dominance and Pareto optimal set
concepts. The proposed approach allows different evaluation scenarios, and offers advantages over
traditional evaluation approaches. The experimental validation is conducted using ground truth data.
Innovative results obtained by applying the proposed approach are presented and discussed.
1 INTRODUCTION
A quantitative evaluation of disparity estimation
avoids the subjectivity of visual inspection on
results. State-of-the-art on quantitative evaluation
approaches can be divided into estimation errors –
using ground truth– based and prediction error
based. Estimation errors based are knows as ground
truth based approaches since they relies on
measuring errors by comparing disparity estimations
against ground truth data. The methodology for
evaluating quantitatively disparity estimation
proposed at Middlebury (Scharstein and Szeliski,
2002, 2003) is a standard. Moreover, they have
made available, to the research community, ground
truth data along with a methodology for evaluating
stereo algorithms. The methodology is based on
percentages of estimation errors –bad matched
pixels–, which are measured based on ground truth
data, formed by a set of real images with different
geometric characteristics, error threshold , and
evaluation criteria. Percentage errors are compared
and ranked. The overall performance is expressed in
a single value: an average ranking over all error
criteria. It is possible to determine a set of top
performer algorithms based on this ranking.
Nevertheless, the cardinality of this set is a free
parameter.
Other authors (Kostliva et al., 2007; Neilson and
Yang, 2008) have also discussed about ground truth
based evaluation approaches. Kostliva et al. pointed
out that Middlebury’s methodology is focused on
dense stereo algorithms, assuming a uniform
behaviour of algorithms under evaluation with
respect to an imagery test bed. They propose an
evaluation methodology based on Receiver
Operating Characteristic –ROC– and focus on
studying changes on results accuracy –error rate–
and density –sparsity rate– in relation to different
parameter settings. However, the ROC curve and
others measures, defined upon it, are computed on
just one stereo image. The evaluation turns
probabilistic when the imagery test bed involves
more than one stereo image. Moreover, Kostliva et
al. approach requires a weight setting in relation to
the importance of each stereo image present in the
test bed.
In (Neilson and Yang, 2008) is stated that an
evaluation approach based on applying algorithms
just to a few stereo images and declare the technique
with the lowest error rate as superior lacks of
statistical significance. Consequently, the declared
superiority of a particular algorithm turns out to be
unreliable. Moreover, they emphasise that error
measures from different stereo images, or from
different error criteria, should not be combined.
704
Cabezas I. and Trujillo M..
A NON-LINEAR QUANTITATIVE EVALUATION APPROACH FOR DISPARITY ESTIMATION - Pareto Dominance Applied in Stereo Vision.
DOI: 10.5220/0003374607040709
In Proceedings of the International Conference on Computer Vision Theory and Applications (VISAPP-2011), pages 704-709
ISBN: 978-989-8425-47-8
Copyright
c
2011 SCITEPRESS (Science and Technology Publications, Lda.)
They propose a ground truth based evaluation
methodology using a statistical significance test
combined with a greedy clustering to rank stereo
algorithms. In this way, algorithms of statistically
similar performance are assigned to the same rank.
On the other hand, a prediction error evaluation
approach can be used in the lack of disparity ground
truth data. It relies on measuring prediction errors of
a rendered view against a real image (Szeliski, 1999;
Szeliski and Zabih, 2000). There are two alternatives
to generate such a view: forward and inverse
predictions. However, in both cases, error measures
will reflect not only quality of disparity estimation
but also quality of a rendered view. Moreover, this
evaluation approach is related to specific application
domains on which the output is a rendered view and
there are human observers as final users. In this
scenario, the capability of bringing a visual comfort
sensation to observers turns out to be more
important than the accuracy of the estimation.
The prediction error evaluation approach
proposed in (Leclerc et al., 2000) relies on
measuring 3D reconstruction errors computed
independently from multiple views. That approach
defines a self-consistency property as a 3D
triangulation agreement. However, a precise
estimation of intrinsic and extrinsic camera
parameters is assumed. Moreover, a stereo algorithm
may be self-consistent but inaccurate, since self-
consistency is a necessary but not a sufficient
condition (Szeliski and Zabih, 2000).
Summarising, both evaluation approaches are
based on linear functions and rely on the use of a
single value as an indicator of comparative
performance. However, realistic camera models as
well as image formation process are of non-linear
nature. This fact rise concerns about validity –or
convenience– of performing a linear evaluation in a
non-linear process.
In this paper a non-linear quantitative evaluation
approach is introduced. It is formalised based on
Pareto dominance relation and Pareto optimal set
(Veldhuizen and Lamont, 1999). It can be used with
or without disparity ground truth data, also by
integrating ground truth and rendered views. An
advantage of the proposed approach relies on that it
allows a clear and concise interpretation of
evaluation results. The experimental evaluation
shows alternative compositions of Middlebury’s top
performer algorithms set under different evaluation
scenarios.
The paper is structured as follows. Section 2
contains a general description of an evaluation
methodology. In Section 3 the proposed approach is
formalised. Experimental evaluation is presented
and discussed in Section 4. Final remarks and future
work are stated in Section 5.
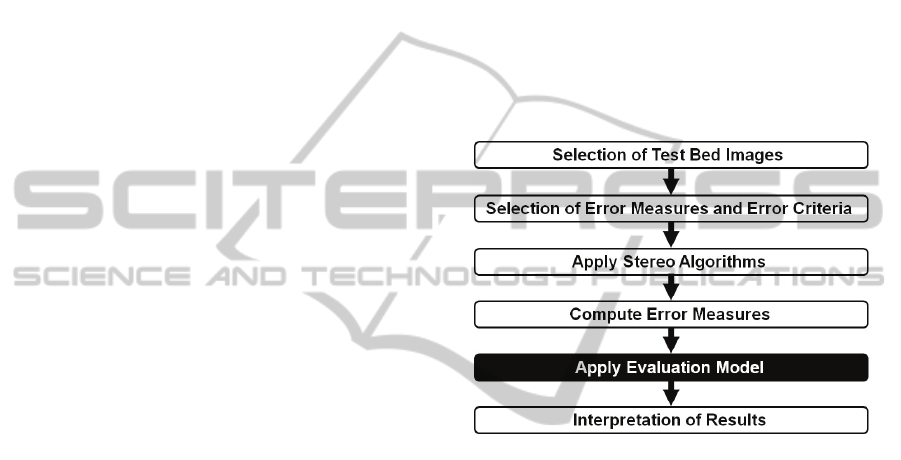
2 QUANTITATIVE EVALUATION
A quantitative evaluation methodology for disparity
estimation may involve different elements such, as:
an imagery test bed, a set of error measures, a set of
error criteria, and an evaluation model. It is depicted
in Figure 1. The evaluation model is a relevant
element, and is the focus of the proposed approach.
Some of the elements involved in an evaluation
methodology are briefly described below.
Figure 1: Process diagram of an evaluation methodology
for disparity estimation.
2.1 Imagery Test Bed
In ground truth based approaches, an imagery test
bed is a set of stereo images –
– and disparity
ground truth data –
. Where
contains high
accuracy disparity information. In prediction error
based approaches, an imagery test bed is a set of real
images –
.
It should be highlighted that, the selection of test
bed images is not a trivial step during the evaluation
process. Aspects such as, image content, image
quality, or test bed cardinality, have an impact on the
performance of algorithms under evaluation.
(Hirschmüller and Scharstein, 2009). For instance, if
the test bed is too short, algorithm parameters may
be specifically tuned to obtain a superior
performance. However, this superiority lacks of a
real significance. On the other hand, different
applications domains are related to different image
content, and in a same domain may exist several
image acquisition conditions.
A NON-LINEAR QUANTITATIVE EVALUATION APPROACH FOR DISPARITY ESTIMATION - Pareto Dominance
Applied in Stereo Vision
705

2.2 Error Measures
A quantitative evaluation relies on measuring errors.
Equation 1 illustrates an error function that measures
differences between –
– a ground truth disparity
map, and –
– an estimated disparity map.
:
(
)
→
ℝ
(1)
A commonly used error measure is the bad matched
pixels average. It is computed according to the
binary variable in Equation 2, and gathered using
Equation 3.
(,)
=
1
|
(
,
)
−
(
,
)|
>
0
|
(
,
)
−
(
,
)|
≤
(2)
=
1
(,)
(,)
,
(3)
where is the total number of pixels and ℝ is a
disparity error threshold.
Equation 4 illustrates an error function that
measures prediction errors.
:
(
)
→
ℝ
,
(4)
where
is a real image, and
is a
rendered view.
The most commonly used error measures, in this
case, are the mean square error ––, the root of
the mean square error ––, and the pick signal
to noise ratio –.
=
1
(|
(
,
)
−
(
,
)|)
,
(,)
(5)
=
1
(|
(
,
)
−
(
,
)|)
(,)
,
(6)
= 10 log
(2
−1)
,
(7)
where B is the number of bits used for representing
image data.
A high is commonly associated with a
small percentage of bad matched pixels. However,
this relation is ambiguous (Stankiewicz and Wegner,
2008).
A main drawback of the above error measures is
that they do not truly quantify the perceived visual
quality by a human observer. On the other hand,
perceptual error measures, based on human visual
system are computationally expensive (Zheng-Xiang
and Zhi-Fang, 2010).
Moreover, in real applications, different domains
have different levels of tolerance to disparity
estimation errors.
2.3 Error Criteria
Error criteria –
– is a set of regions defined
over
. Error measures are gathered for each
error criterion. In this way, an error criterion
provides a link among image content, error measures
and estimated disparities. Error criteria support
algorithms performance analysis, since they allow
results of evaluations on specific –problematic or
challenging– image regions. Error criteria
commonly used are: non-occluded regions –
–, the entire image ––, and depth
discontinuity regions ––, from Middlebury’s
methodology. Analogously, in our scenario, an error
vector can be described as a set of values
measured on
〈
,,
〉
.
3 EVALUATION MODEL
An evaluation model allows a quantitative
comparison of stereo algorithms. Equation 8
illustrates conventional –ground truth based– linear
disparity estimation evaluation models.
:
(
)
→
ℝ
,
(8)
where ℝ is a real value obtained by a linear
combination of error measure values.
Our evaluation model for disparity estimation is
supported by the concepts of Pareto dominance and
Pareto optimal set (Veldhuizen and Lamont, 1999).
Consequently, it is of non-linear nature.
3.1 Proposed Evaluation Model
The proposed model considers the following
assumptions: i) error criteria measures are
incommensurables, and ii) all the test bed images
and considered error measures have a common
importance.
For the sake of simplicity, our model is described
in the context of ground truth data. An extension to
incorporate rendered views is straight forward. The
evaluation model is formulated using the following
notation.
Let I
be a set of stereo images used for
evaluation purposes. Let
be a set of
disparity maps calculated by , taking
as
input. Let = ∈│:
(
)
→
be a non-empty set of stereo algorithms
under evaluation. Let
be a set of ground truth
disparity maps related to
. Let
be a
set of regions of interest in
. Let and
∗
be
VISAPP 2011 - International Conference on Computer Vision Theory and Applications
706

error value vectors. Let “≺” be the symbol that
denotes the Pareto dominance relation. Let
=
∈│ℎ:
(
)
→ be a set
of error value vectors measured for a set , by
comparing
against
, according
to
. Let
∗
│
∗
⊆ , be a proper subset
of –a Pareto optimal set–, subject to:
∗
=
∗
∈│∄∈∶ ≺
∗
.
(9)
Let
∗
be a proper subset of ,
∗
⊆ , such as:
∗
=
∈│ℎ:
(
(
)
)
→
∗
.
(10)
Thus, the proposed evaluation model can be
formulated as follows:
:
(
)
→
∗
(11)
3.2 Interpretation of Results
The interpretation of results, in the proposed model,
is based on the cardinality of
∗
–which, by
definition, cannot be an empty set.
If
|
∗
|
=1, then exists a stereo algorithm capable of
produce a superior performance.
Otherwise, if
|
∗
|
>1, then exists a set of stereo
algorithms of comparable performance.
Additionally, the performance of algorithms
belonging to
∗
is superior to the performance of
those algorithms belonging to \
∗
.
All the above judgements are stated in regard
to
, by applying and considering
.
Consequently a change in the composition of any of
these sets implies a change in the composition of
∗
.
3.3 Alternative Evaluation Goals
The above model is formulated in the case of an
inter-technique evaluation goal. However, in an
intra-technique evaluation goal, the set is
composed by the same stereo algorithm executed
under a set of conceptually different parameters. On
the other hand, if the aim of the evaluation is to
estimate iteratively clusters of stereo algorithms with
a similar performance, then after each
∗
computation, the set is updated to \
∗
, and
∗
is
computed once again, until reaching an empty set.
4 EVALUATION RESULTS
The validation of the proposed approach is conduc-
ted using Middlebury’s data, and contrasted to
Middlebury’s ranking, which are available online
(Scharstein
, 2011). Stereo algorithms are identified
based on the names which appear on the online
ranking. The top fifteen stereo algorithms according
to Middlebury’s ranking are listed in Table 1. Three
evaluation scenarios are considered for the sake of
validating the proposed approach. Differences
among them rely on the configurations of
and
. As error measure, bad matched pixels
are computed with equals to 1,0.
Table 1: Top fifteen performer stereo algorithms using
Middlebury’s evaluation.
Middlebury
Algorithm Avg. Rank Rank
ADCensus 5,3 1
AdaptingBP 6,6 2
CoopRegion 6,7 3
DoubleBP 9,1 4
RDP 9.7 5
OutlierConf 10,2 6
SubPixDoubleBP 13,6 7
SurfaceStereo 14,3 8
WarpMat 15,9 9
ObjectStereo 16,2 10
Undr+OvrSeg 21,0 11
GC+SegmBorder 21,5 12
GlobalGCP 22,1 13
CostFilter 22,4 14
AdaptOvrSegBP 23,3 15
4.1 Dense Disparity Map Evaluation
Let
be the set of test bed images, denoted by
extension as
,,,
. Let
be the set of stereo algorithms under evaluation,
composed by all the stereo algorithms reported on
the online Middlebury’s evaluation site (Scharstein,
2011). Let
be a set of image regions,
denoted by extension as
,,
. Let
be error vectors of the
form
〈
,,
〉
.
Table 2 illustrates the sixteen stereo algorithms
belonging to
∗
, after applying the proposed model
to
, under this evaluation scenario. These
algorithms have a comparable performance among
them, and superior performance to those algorithms
belonging to
\
∗
, in regard to
, and
considered
. It should be highlighted
that some of the algorithms listed in Table 2 are not
present in Table 1. It can be appreciated also, that
∗
includes stereo algorithms with different values
of Middlebury’s average ranking among them, and
ranked in distant positions. These differences in
evaluation results, between the proposed approach
A NON-LINEAR QUANTITATIVE EVALUATION APPROACH FOR DISPARITY ESTIMATION - Pareto Dominance
Applied in Stereo Vision
707

and Middlebury’s approach, can be explained based
on the assumptions of our model.
Table 2: Stereo algorithms belonging to A
all
∗
, in regard to
, by applying
, and considering
.
Middlebury
Algorithm Avg. Rank Rank
ADCensus 5,3 1
AdaptingBP 6,6 2
CoopRegion 6,7 3
DoubleBP 9,1 4
RDP 9.7 5
OutlierConf 10,2 6
SubPixDoubleBP 13,6 7
SurfaceStereo 14,3 8
WarpMat 15,9 9
ObjectStereo 16,2 10
Undr+OvrSeg 21,0 11
GC+SegmBorder 21,5 12
GlobalGCP 22,1 13
AdaptOvrSegBP 23,3 15
P-LinearS 23,6 16
PUTv3 38,8 37
4.2 Semi-dense Disparity Map
Evaluation
Let
_
be a set of image regions,
denoted by extension as
,
. Let
_
be error vectors of the
form
〈
,
〉
. In this way, this scenario is
related to a semi-dense disparity map evaluation.
Table 3 illustrates the thirteen stereo algorithms
belonging to
∗
, after applying the proposed model
to
, under this evaluation scenario. It can be
appreciated that some of the algorithms present in
Table 3 are not present in Table 1, and vice versa.
Table 3: Stereo algorithms belonging to A
all
∗
, in regard to
, by applying
, and considering
_
.
Middlebury
Algorithm Avg. Rank Rank
ADCensus 5,3 1
AdaptingBP 6,6 2
CoopRegion 6,7 3
DoubleBP 9,1 4
RDP 9.7 5
OutlierConf 10,2 6
SubPixDoubleBP 13,6 7
SurfaceStereo 14,3 8
ObjectStereo 16,2 10
Undr+OvrSeg 21,0 11
AdaptOvrSegBP 23,3 15
P-LinearS 23,6 16
PUTv3 38,8 37
Table 4: Stereo algorithms belonging to A
local
∗
, in regard to
, by applying
, and considering
_
.
Middlebury
Algorithm Avg. Rank Rank
GeoSup 25,5 18
AdaptDispCalib 28,4 22
DistinctSM 32,3 28
LocallyConsist 24,0 32
CostAggr+occ 35,3 34
GradAdaptWeight 40,1 38
AdaptWeight 41,6 40
4.3 Local Stereo Algorithms
and Semi-dense Disparity Map
Evaluation
Let
be the set composed by the stereo
algorithms reported on Middlebury’s evaluation site,
which can be considered as local algorithms
following the taxonomy of (Scharstein and Szeliski,
2002). Table 4 illustrates the seven local stereo
algorithms belonging to
∗
, after applying the
proposed model to
, under this evaluation
scenario. The result of this evaluation scenario
contradicts a conventional approach interpretation,
on which the GeoSup algorithm is the most accurate
among local stereo algorithms –due to its superior
ranking according to Middlebury’s evaluation
methodology.
5 FINAL REMARKS
AND FUTURE WORK
Disparity estimation evaluation involves multiple
and different aspects. However, conventional
disparity evaluation approaches use a single value as
an indicator of performance. The evaluation model
proposed in this paper is based on Pareto dominance
and Pareto optimal set. The main contribution of this
approach consists in avoiding a subjective
interpretation of the quantitative comparison of
stereo algorithms. Under our approach, two or more
algorithms have a comparable performance, when
their results are not better, neither worst, since their
associated error value vectors are incomparable,
under a Pareto dominance criterion. On the other
hand, a superior performance is related to the
existence of an algorithm capable of produce results
that minimize, comparatively and simultaneously, all
the error measure functions.
As innovative aspect, the introduced approach
produces significantly different results in
VISAPP 2011 - International Conference on Computer Vision Theory and Applications
708

comparison to Middlebury’s evaluation
methodology.
As future work, authors are planning to explore
two main concerns. First, conduct an enhancement
of the evaluation model by considering tolerances in
regard to the comparison of error value vectors.
Second, define variations of the model in order to
capture different conditions between inter and intra
technique stereo algorithms evaluation.
REFERENCES
Hirschmüller, H. & Scharstein, D., 2009. Evaluation of
Stereo Matching Costs on Images with Radiometric
Differences. IEEE Transactions on Pattern Analysis
and Machine Intelligence, 31(9). IEEE Computer
Society, pp. 1582-1599.
Kostliva, J., Cech, J. & Sara, R., 2007. Feasibility
Boundary in Dense and Semi-Dense Stereo Matching.
In Computer Vision and Pattern Recognition.
Minneapolis, MN, USA. IEEE Computer Society, pp.
1-8.
Leclerc, Y. G., Luong, Q. & Fua, P., 2000. Measuring the
Self-Consistency of Stereo Algorithms. In European
Conference on Computer Vision-Part I. Springer-
Verlag, pp. 282-298.
Neilson, D. & Yang, Y., 2008. Evaluation of
Constructable Match Cost Measures for Stereo
Correspondence using Cluster Ranking. In Computer
Vision and Pattern Recognition. Anchorage, AK,
USA. IEEE Computer Society, pp. 1-8.
Scharstein, D., 2011. Middlebury Stereo Evaluation -
Version 2. Retrieved January 28, 2011, from:
http://vision.middlebury.edu/stereo/eval/.
Scharstein, D. & Szeliski, R., 2002. A Taxonomy and
Evaluation of Dense Two-Frame Stereo
Correspondence Algorithms. International Journal of
Computer Vision, Volume 47, pp. 7-42.
Scharstein, D. & Szeliski, R., 2003. High-accuracy Stereo
Depth Maps using Structured Light. In Computer
Vision and Pattern Recognition. Madison, WI, USA.
IEEE Computer Society, pp. I-195-I-202.
Stankiewicz, O. & Wegner, K., 2008. Depth Map
Estimation Software Version 3, ISO/IEC MPEG
meeting M15540.
Szeliski, R., 1999. Prediction Error as a Quality Metric for
Motion and Stereo. In International Conference on
Computer Vision, Volume 2. Kekyra, Greece. IEEE
Computer Society, pp. 781-788.
Szeliski, R. & Zabih, R., 2000. An Experimental
Comparison of Stereo Algorithms. In Proceedings of
the International Workshop on Vision Algorithms.
Springer-Verlag, pp. 1-19.
Van Veldhuizen, D. A. & Lamont, G. B., 1999.
Multiobjective Evolutionary Algorithm Test Suites. In
ACM symposium on Applied computing. San Antonio,
TX, USA. ACM, pp. 351-357.
Zheng-Xiang, X. & Zhi-Fang, W., 2010. Color Image
Quality Assessment Based on Image Quality
Parameters Perceived by Human Vision System. In
International Conference on Multimedia Technology.
Ningbo, China. IEEE Computer Society, pp. 1-8.
A NON-LINEAR QUANTITATIVE EVALUATION APPROACH FOR DISPARITY ESTIMATION - Pareto Dominance
Applied in Stereo Vision
709
