
MODELLING AND OPTIMIZATION
OF DATA-DRIVEN SCENE GRAPHS
S
´
ebastien Boisg
´
erault
Mines ParisTech, 60 Bd St Michel, Paris, France
Eric Vecchi
´
e
Mines ParisTech, 60 Bd St Michel, Paris, France
Keywords:
Modelling, Optimization, Scene graph, Vector graphics, User interfaces, Safety critical systems, Embedded
systems, Mobile systems, Real-time systems.
Abstract:
This article presents data-driven scene graphs, a set of models that address the needs of safety-critical user
interfaces design. Data-driven scene graphs merge a description of the user interface behavior as a data-flow
program with a description of its graphics content as a hierarchical structure of vector and raster elements. We
present a formal description of these models, discuss their semantics and equivalence, and demonstrate that
they are suitable for a class of rasterization optimizations based on selective pre-rendering.
1 INTRODUCTION
In transportation systems, the information displays
that may influence the vehicle’s driving are consid-
ered safety-critical. Special efforts shall be made to
ensure that these user interfaces are defect-free. Data-
driven scene graphs have been introduced in (Esterel
Technologies, 2007; Boisg
´
erault et al., 2010) as a
class of models that are adapted to this task: they are
composed of a functional description and a graphics
description using the SCALABLE VECTOR GRAPH-
ICS format (SVG) in our reference implementation.
This structure is flexible enough to describe ade-
quately safety-critical user interfaces but has enough
constraints to enable validation to be performed at
the modelling step. Most defects are therefore elim-
inated before the code generation stage that actually
produces an executable software component.
Efficiency in the graphics rendering is a major is-
sue for such mobile user interfaces that often rely on
hardware with limited capabilities. We show in this
article that the same type of structuring information
that allows validation of data-driven scene graphs also
enables optimization to be performed at the model
level. Considerable efforts have already been done
to design efficient SVG renderers. They either fo-
cus on specific hardware architectures (Kim et al.,
2010) or optimize some processing steps of software
renderers (He et al., 2007). Our approach does not
compete but rather complements these efforts as we
want first and foremost to address the common situa-
tion where the complete graphics platform is already
given. In this situation, the only choice left is to op-
timize the user interface model itself. We also no-
tice that even if some optimizations may be applied
to the graphics platform, once a data-driven scene
graph model has been transformed into a display list,
some model information has been lost. For exam-
ple, graphics change detection is simple to perform on
data-driven scene graphs models (see section 3) but
difficult at a later processing stage (Concolato et al.,
2008). We present a theoretical framework that en-
ables automatic and safe optimization of data-driven
scene graphs.
2 MODEL OF COMPUTATION
The data-driven scene graph Model of Computa-
tion consists of a hierarchical description of graph-
ics components driven by a synchronous program.
Synchronous programming languages are domain-
specific languages dedicated to the design of real-time
embedded systems. Their semantics are based on the
synchronous hypothesis stating that the execution of a
317
Boisgérault S. and Vecchié E..
MODELLING AND OPTIMIZATION OF DATA-DRIVEN SCENE GRAPHS.
DOI: 10.5220/0003312903170320
In Proceedings of the International Conference on Computer Graphics Theory and Applications (GRAPP-2011), pages 317-320
ISBN: 978-989-8425-45-4
Copyright
c
2011 SCITEPRESS (Science and Technology Publications, Lda.)

program is discretely divided into atomic reactions. In
a reaction cycle, input signals are read/sampled, and
internal computation takes place until outputs signals
are emitted in answer, and the program state is pro-
gressed. In addition to the pure synchronous model,
our model consumes its outputs to produce graphics.
2.1 The Synchronous Model
Register Transfer Level (RTL) description is a way
of describing the operation of a synchronous digi-
tal circuit. Formally, a RTL description is a triplet
(S
0
, ∆, Θ) that defines relations between the flows of
inputs I
k
∈ I , the flows of states S
k
∈ S and the flows
of outputs O
k
∈ O of the RTL design. The transition
function ∆ defines the next state of the circuit with
respect to the input and the current state of the circuit:
S
k+1
= ∆(I
k
, S
k
) ∀k ∈ N
The output function Θ defines the output flow with
respect to the input and the current state of the circuit:
O
k
= Θ(I
k
, S
k
) ∀k ∈ N
2.2 The Graphics Model
As a graphics extension of the synchronous model,
a data-driven scene graph model H ∈ H is formally
defined as a quadruplet H = (S
0
, ∆, Θ, Γ) where
(S
0
, ∆, Θ) is the pure synchronous part of the model
and Γ ∈ G is the graphics function that computes
scene graphs G
k
with respect to the output of the syn-
chronous model:
G
k
= Γ(O
k
) ∀k ∈ N
The scene graph is then rendered as an image using
precise semantics rules. The EDONA/HMI model
(Human Machine Interface – Work Package 4, 2008;
Boisg
´
erault et al., 2008) is our implementation of
data-driven scene graphs. It is an extension of
SVG, a family of specifications for describing two-
dimensional vector graphics. The data of the graph-
ics model (geometric or style properties of graphics
objects) may be exposed as variables while the docu-
ment structure remains static.
2.2.1 Graphics Tree Grammar
The formal abstract syntax of the scene graph model
that captures the SVG model is the following:
t ::= {n=v : t} | v ?t,t | t;t
| g[n, ...n] | hti
e
with g ranging over graphics primitive names, n rang-
ing over graphics properties names, v ranging over
constant values or output signal names and e ranging
on environments.
• {n=v : t} local assignment of graphics properties.
• v?t
1
,t
2
if v then t
1
else t
2
.
• t
1
;t
2
compositing of t
2
over t
1
.
• g[n
1
, ...n
k
] rasterization of the graphics primitive
g using graphics properties n
1
. . . n
k
explicitely.
• hti
e
is the raster image that results from the ren-
dering of the graphics tree t in the environment e.
This construct defines a unique raster image only
when t is static – that is when the local assign-
ments in t refer to constant values.
We write T the set of trees matching this grammar.
We need to distinguish the special cases of group
opacity and local transformation matrix. Therefore
we will use the notations α v.t and µv.t as syntactic
sugar respectively for:
{opacity=v : t} and {matrix=v : t}
2.2.2 Display List
At each reaction, the data-driven scene graph is re-
duced into a display list matching the grammar:
t ::= g(c, ...c) | t;t | α c.t | µc.t
with g ranging over graphics primitive names and c
ranging over constant values and we write T
∗
the set
of display lists matching this grammar.
Semantics Rules. The reduction of a tree t ∈ T into
a display list t
0
∈ T
∗
, given an environment E and the
outputs O of the synchronous model at a given instant
is written:
E, O ` t * t
0
This reduction obeys the following semantics rules:
E[n ←O[v]], O ` t * t
0
E, O ` {n=v : t} * t
0
O[v] = 1 E, O ` t
1
* t
0
1
E, O ` v ?t
1
,t
2
* t
0
1
O[v] = 0 E, O ` t
2
* t
0
2
E, O ` v ?t
1
,t
2
* t
0
2
E, O ` t
1
* t
0
1
E, O ` t
2
* t
0
2
E, O ` t
1
;t
2
* t
0
1
;t
0
2
∀i ∈ [1..k] E[n
i
] = v
i
E, O ` g[n
1
, ...n
k
] * g(v
1
, ...v
k
)
e, ∅ ` t * t
0
E, O ` hti
e
* t
0
GRAPP 2011 - International Conference on Computer Graphics Theory and Applications
318

Graphics Equivalence. Given a RTL model or a
data-driven scene graph model:
H = (S
0
, ∆, Θ) or H = (S
0
, ∆, Θ, Γ)
if for all k ∈ N and for all input I
k
∈ I we have:
O
k
= Θ(I
k
, S
k
) and S
k+1
= ∆(I
k
, S
k
)
and if for all environment E ∈ E we have:
E, O
k
` t
1
* t
0
1
and E, O
k
` t
2
* t
0
2
then: t
0
1
= t
0
2
⇒ t
1
H
≡ t
2
3 SELECTIVE PRE-RENDERING
We propose to optimize the rendering time of data-
driven scene graphs by using selective pre-rendering
techniques. We want to replace branches of the graph-
ics tree by bitmap images only when this replace-
ment is indeed relevant. Considering our model, it
is not always possible to apply this technique on any
branch since some of the graphics parameters are re-
computed at each reaction: as an example, consider a
shape whose color depends on the value of a signal.
On the other hand, if the position (x, y) of a shape is
the sole changing property, then it is possible to save
the shape in a bitmap and then combine the bitmap at
the expected position.
When possible, it is not always advised to replace
a branch by an equivalent bitmap. As an example con-
sider the figure 1 depicting 2 simple shapes: on the
left picture, shapes are quite big with respect to the
bounding box and it might be useful to cache such a
picture. On the right picture, the 2 shapes are much
smaller and far distant: for the same bounding box,
the image is quite empty. In this second case, the
pre-rendering technique will probably be less efficient
than the direct rendering of the image.
Figure 1: Usefulness of Pre-rendering?
3.1 Minimisation Problem
In our approach, the performances of a model only
depends on the graphics operations. The cost of the
synchronous part of the system is supposed to be null.
We then define the cost function of the system on the
graphics tree. Given a model H ∈ H together with its
graphics tree t ∈ T and a cost function C : T → R
+
we want to compute a tree t
0
∈ T equivalent to t that
minimizes C, i.e. such that:
t
0
H
≡ t and C(t
0
) ≤ C (t
0
) ∀t
0
H
≡ t
3.2 The Cost Function
Computation time or space is consumed at each in-
stant during the rasterization of the display list. Com-
putation costs have 2 different origins:
1. the rasterization cost of graphics primitives
2. the compositing cost of bitmaps.
The global cost function C(t) is obtained by
computing the mean of the instantaneous cost C
i
over
each reaction of the system:
C(t) =
∑
k
C
i
(E
0
, O
k
,t)
The exact cost function is then highly dependent on
the input of the considered data-driven scene graph,
which prevent us from optimizing the design before
it is run. Instead, we use an estimated cost function
that is independent on the inputs of the system. This
estimated cost can be a theoretical approximation of
the graphics primitives costs or even computed on the
fly using a sample of representative ouputs of the con-
sidered model.
3.3 Minimization Algorithm
The function that minimizes the cost of a tree t
0
using
the selective pre-rendering technique is the function
M : E × T → T. Let cache?(E, t) be the function re-
turning 1 if the tree branch t in the environment E
can be cached, 0 otherwise. Let subst(t, b
1
, b
2
) be the
function that returns the tree t ∈ T where the branch
b
1
∈ T has been replaced by the branch b
2
∈ T. Let
t
0
be the root of the graphics tree and O
1
, ...O
k
be the
output sequence of the model. The function M is de-
fined as follows. If:
cache?(t) ∧
C(subst(t
0
,t, hti
E
)) < C (subst(t
0
,t, M
0
(E,t)))
then M (E, t) = hti
E
else M (E, t) = M
0
(E,t)
and the auxiliary function M
0
is defined as follows:
M
0
(E, {n=v : t}) = {n=v : M (E[n ← ∅[v]], t)}
M
0
(E, v ?t
1
,t
2
) = v ? M (E, t
1
), M (E, t
2
)
M
0
(E,t
1
;t
2
) = M (E, t
1
);M (E, t
2
)
M
0
(E, g[n
1
, ...n
k
]) = g[n
1
, ...n
k
]
M
0
(E, hti
e
) = hti
e
where ∅[v] = ⊥ if v is not a constant.
MODELLING AND OPTIMIZATION OF DATA-DRIVEN SCENE GRAPHS
319
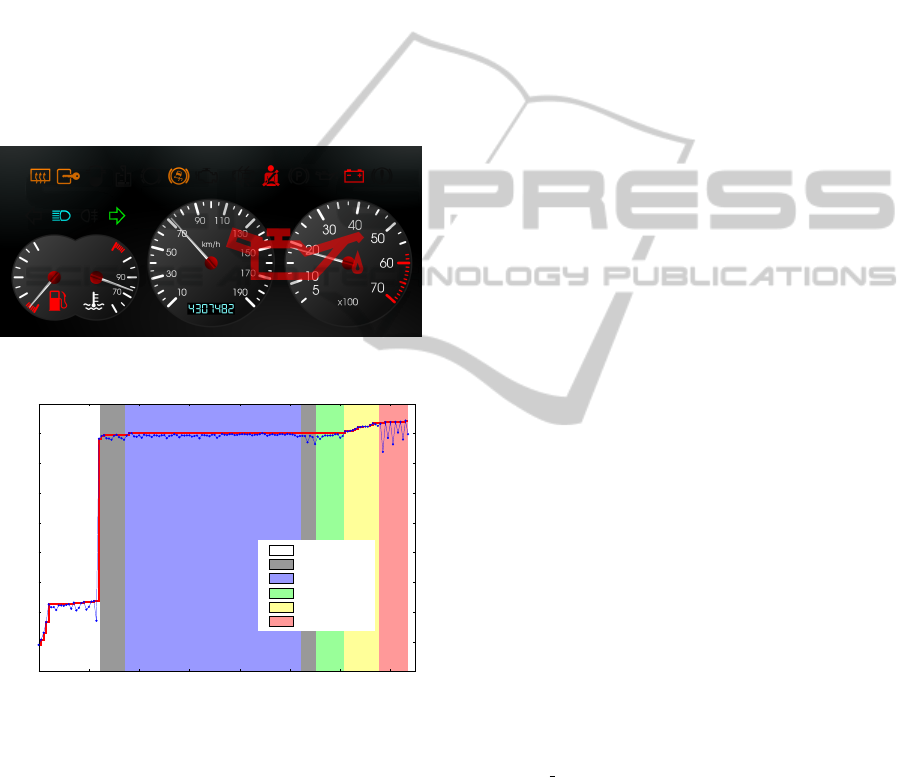
4 BENCHMARK
We tested the algorithm on a graphics interface rep-
resenting the reconfigurable instrument cluster of a
car: this includes lights, alert and warning indicators,
odometer, speed, RPM, gas and temperature gauges.
This model is a typical use case of safety-critical au-
tomotive user interface. This graphics interface is
shown in figure 2. In this model, every indicator can
be either “on” (coloured) or “off” (dark grey), further-
more, the red alert indicators can be scaled big and
shown transparent over the speed/RPM gauges (as an
emphasis for serious alerts). The odometer is made
up of individual led bars (coloured of black) and any
needle can rotate around its axis.
Figure 2: The car’s instrument cluster model.
0
5
10
15
20
25
30
35
40
45
0 20 40 60 80 100 120 140
algorithm step (#)
performance (FPS)
background
needles
odometer
lights
warnings
alerts
Figure 3: Model optimization process.
The evolution of the pre-rendering algorithm is
shown in the graphics of the figure 3. The x-axis rep-
resents the steps of the algorithm and the y-axis repre-
sents the number of frame per seconds (FPS) that the
rasterization were able to achieve.
The cost function were here evaluated experi-
mentally on a 32-bits linux based system equiped
with a ATI Mobility Radeon graphics card and using
the “image” software rendering backend of the cairo
graphics library. Performances were evaluated on a
representative set of input values that may influence
the rendering performances of the model. The red
line represents the evolution of the best performances
of the model and the blue dots represent the perfor-
mances of the current candidate (red line is the “max”
of the blue dots).
5 CONCLUSIONS
We presented a theoretical framework for the mod-
elling of graphics interfaces. We illustrated the use-
fulness of this framework with a method for an au-
tomated optimization of graphics performances. This
method optimizes the rendering time of dynamic vec-
tor graphics by using a selective pre-rendering tech-
nique as evidences show that the systematic pre-
rendering is generally not optimal. Groups of vector
objects are thus replaced by equivalent bitmaps. This
method relies on a cost function of primitive rasteriza-
tion functions. This includes the cost of group opac-
ity and matrix positioning operations. The global cost
function can be evaluated on the fly during the min-
imization algorithm using a sequence of representa-
tive outputs. Experiments show the usefulness of our
approach on a concrete safety-critical automotive in-
strument cluster model. The optimization algorithm
benchmarks score a significant improvement of the
rendering performances.
REFERENCES
Boisg
´
erault, S., Abdallah, M. O., and Temmos, J.-M.
(2008). SVG for automotive user interfaces. In Pro-
ceedings of SVG Open, Nuremberg, Germany.
Boisg
´
erault, S., Vecchi
´
e, E., Meunier, O., and Temmos, J.-
M. (2010). EDONA/HMI - modelling of advanced
automotive interfaces. In Proceedings of ERTS
2
,
Toulouse, France.
Concolato, C., Feuvre, J. L., and Moissinac, J.-C. (2008).
Design of an efficient scalable vector graphics player
for constrained devices. IEEE Transactions on Con-
sumer Electronics, 54(2):895–903.
Esterel Technologies (2007). Scade Display. http://tiny.cc/
scade display.
He, G., Bai, B., Pan, Z., and Cheng, X. (2007). Acceler-
ated rendering of vector graphics on mobile devices.
Lecture Notes in Computer Science, 4551:298–305.
Human Machine Interface – Work Package 4 (2008).
EDONA HMI Format. Report, EDONA.
Kim, S., Oh, Y., Park, K., and Ro, W. (2010). Hard-
ware implementation of a tessellation accelerator for
the OpenVG standard. IEICE Electronics Express,
7(6):440–446.
GRAPP 2011 - International Conference on Computer Graphics Theory and Applications
320
