
Heritability Estimation Methods of Multiple Brain
Measures: A Preliminary MRI Study in Twins
Yu Yong Choi
1
and Kun Ho Lee
2
1
Department of Computer Engineering, Hanyang University, Seoul 133-605, Korea
2
Department of Marine Life Science, Chosun University, Gwangju 501-759, Korea
Abstract. Heritability is the proportion of total phenotypic variance due to
genetic influence. To estimate heritability, Falconer’s formula (FF) and
structural equation modeling (SEM) are used. However, compared to FF, SEM
is hardly applicable for neuroimaging analysis because the SEM tools such as
Mx cannot calculate numerous data simultaneously nor sequentially. We
developed a code for multiple calculations using Mx to estimate the heritability
of gray matter thickness at 81,924 surface points across the cerebral cortex.
Although FF and SEM provided similar results, SEM was inclined to yield
lower heritability estimates and more conservative significance than FF. In
considering the results, we propose that the correction for multiple comparisons
should be carefully performed for the results from SEM.
1 Introduction
Heritability is a fundamental notion in genetics that summarizes how much of the
variation in a trait among individuals is attributable to differences in genotype [3]. h
2
is used in reference to the proportion of total phenotypic variance due to genetic
influence. There are two representative methods for estimation of heritability:
Falconer’s formula (FF) and structural equation modeling (SEM). FF is based on the
difference between monozygotic (MZ) and dizygotic (DZ) twin correlations. In FF,
heritability is defined as
h
2
= 2(r
MZ
- r
DZ
) . (1
)
where r
MZ
is the MZ or identical twin correlation, and r
DZ
is the DZ or fraternal twin
correlation. SEM is based on decomposition of the phenotypic variance into the
genetic and environmental components. SEM defines heritability as
h
2
= V
G
/ V
P
. (2
)
where V
G
is the genetic variance and V
P
is the phenotypic variance.
Contrary to the simplicity of FF, the heritability estimation in SEM is a complex
process. Variance decomposition for estimation of the genetic variance requires
various sophisticated statistical methods such as a matrix algebra interpreter and a
numerical optimizer (e.g. Mx, or LISREL). The optimizer is used to minimize the
fitting function that denotes a discrepancy measure between the expected model and
the observed data. The iterative process of model fitting continues until the fitting
Choi Y. and Lee K..
Heritability Estimation Methods of Multiple Brain Measures: A Preliminary MRI Study in Twins .
DOI: 10.5220/0003305100820087
In Proceedings of the 2nd International Workshop on Medical Image Analysis and Description for Diagnosis Systems (MIAD-2011), pages 82-87
ISBN: 978-989-8425-38-6
Copyright
c
2011 SCITEPRESS (Science and Technology Publications, Lda.)

function appears to reach the minimum. The SEM fit is so time-consuming that it is
not easy to apply to large-scale data like brain images that consist of numerous voxels.
Moreover, despite the increasing computational power of the modern computer, the
SEM software packages did not provide sequential as well as parallel processing
facilities that are necessary to manipulate numerous data together.
2 Methods
2.1 Approach
We decided to use the methodological heritage of genetic researchers as much as
possible. This approach could save a software developer time and labor, and would
enable a researcher to apply easily the methods in genetics to neuroimaging analysis.
Moreover, it could produce the reliable results to use the methods and tools verified in
the research field.
2.2 Software Development
Among the SEM software packages, Mx was chosen. The Mx developed by [9] is
widely used in human genetics, particularly twin studies because it facilitates
specification of complex models and mixture distributions and provides diverse
model fitting functions. To apply the SEM software Mx to neuroimaging analysis, we
write a MATLAB code for sequential processing of multiple data. The algorithm of
simple version of the program is below:
Array h[N], p[N];
for vertex=1 to N
read brain measures of all twins at the vertex;
write data for Mx;
execute Mx;
parse the result_in_text from Mx;
h[vertex] = the heritability value from the parsing;
p[vertex] = the p value from the parsing
end for
write h;
write p;
2.3 Twin Subjects
To measure the heritability of the brain structure, we recruited twin volunteers. The
study protocol was approved by the relevant institutional review boards (Seoul
National University, Catholic University of Korea), and written informed consent was
obtained from participants. A total of 40 healthy male twin volunteers aged 20.5 ± 1.9
(mean ± SD), consisting of 10 MZ and 10 DZ same-sex twin pairs, were recruited
from the community with advertisements. The MZ and DZ pairs were matched for
age (t = 0.23, P = 0.87) and sex. Blood or hair samples were taken at the date of
83

scanning or cognitive testing. Zygosity was determined by DNA analysis using the 15
highly polymorphic markers.
2.4 Image Acquisition and Analysis
From the twins, contiguous 0.9 mm axial MPRAGE images were acquired with a
1.5T MR scanner (Magnetom Avanto, Siemens) with TR=1160 ms; TE=4.3 ms;
flip=15; FOV=224 mm; matrix=512x512; number of slices=192; two images were
acquired and averaged. Anatomical images were corrected for intensity non-
uniformity [10], spatially registered to stereotaxic space [2], and masked to remove
extra-cerebral voxels. We used INSECT [11] to classify gray matter (GM), white
matter (WM), and cerebrospinal fluid (CSF).
For measuring gray matter thickness, the inner and outer cortical surfaces are
reconstructed [8]. These surfaces are automatically reconstructed by the Constrained
Laplacian-based Automated Segmentation with Proximities (CLASP) algorithm [6].
The cortical thickness was measured using the t-link method of calculating the
Euclidean distance between linked vertices on the white matter surface and the
GM/CSF intersection surface [5]. To compare thickness across subjects, the thickness
was spatially normalized. The vertices were transformed to the spherical model from
which the cortical surfaces originated, and nonlinearly registered to an standard
template on the sphere. A highly flexible deformation, in two dimensions, of a
template cortex to an individual was used for cortical surface registration. This
algorithm provided a transformation to match crowns of gyri between subjects using a
geodesic distance map. With this transformation, thickness information on the
vertices was transformed to the template. Then, diffusion smoothing, which
generalizes Gaussian kernel smoothing, with 30 mm FWHM (full width half
maximum) was used to increase the signal to noise ratio [1].
2.5 Statistical Analysis
To calculate the identical and fraternal twin correlations, we used the intraclass
correlation coefficient (icc) function of package psy in a statistical programming
environment R [4]. The statistical significance of the two twin correlations was
computed using Fisher’s z transformation.
For SEM, the conventional, univariate ACE model was adopted [9]. The ACE
model decomposes the phenotypic variance into additive genetic (A), shared
environmental (C), and non-shared environmental (E) variances. The statistical
significance of the genetic variance or h
2
was derived from chi-square difference
between ACE and CE models.
3 Results
To estimate heritability of a brain-based phenotype like gray matter thickness, both
FF and SEM were adopted and compared.
84
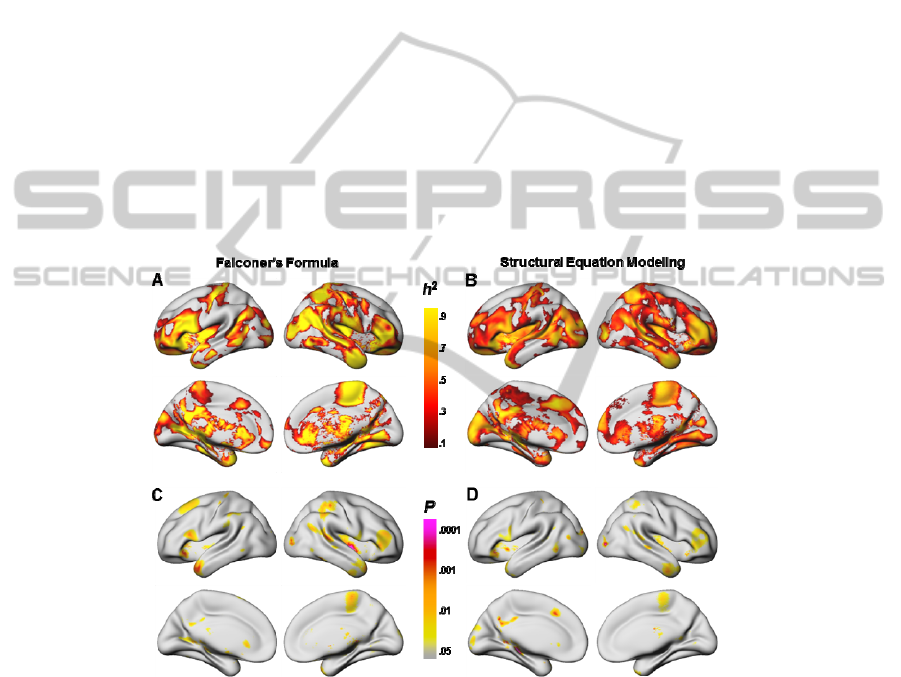
3.1 Falconer’s Formula
First, we applied FF to estimate the heritability of cortical thickness across the whole
brain. The MZ and DZ intracorrelations were derived the icc function of R. By the
equation 1 mentioned in the introduction, we computed and mapped heritability
estimates at surface points of the cerebral cortex (Fig. 1A). The statistical significance
of differences between the MZ and DZ intracorrelations were shown in Fig 1C.
3.2 Structural Equation Modeling
For SEM, the ACE structural equation model, a standard model for twin analysis, was
employed to determine what proportion of variance in a brain-based phenotype is
heritable (h
2
), versus the proportions which are due to shared environment or non-
shared environment. By fitting a univariate ACE model to each of 81,964 vertices
over the cerebral cortex, we produced high-resolution surface maps of the heritability
of brain structure in the twin sample (Fig. 1B). The statistical significances of the
heritability estimates were based on chi-square difference between ACE and CE
models (Fig. 1D).
Fig. 1. Heritability of gray matter thickness from Falconer’s formula (left) and from structural
equation modeling (right). The brain maps illustrated the heritability estimates (A and B) and
the statistical significance values (C and D) at eighty thousand or more vertices of the cerebral
cortex. P values are the statistical difference in intracorrelations between monozygotic and
dizygotic twins using Fisher’s z transformation (C) or chi-square difference between ACE and
CE models (D).
85
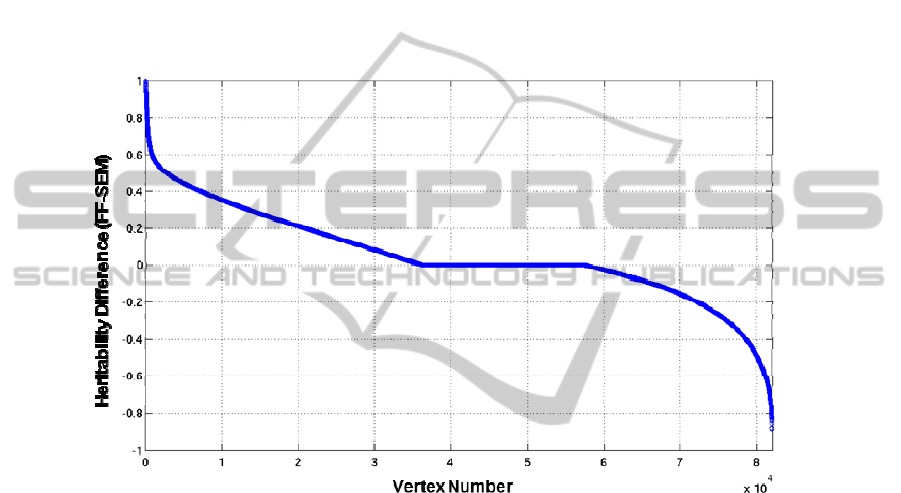
3.3 Comparison between Results from FF and from SEM
Genetic and environmental influences on gray matter thickness differed with cortical
regions (Fig. 1). The topological patterns of inherited regions were very similar
whether FF or SEM is employed. However, the results from SEM in Mx [9] tend to
be smaller and statistically conservative than Falconer’s estimation. The tendency also
is found in a previous study [7]. Precisely, 34.9% of all the vertices showed FF
heritability estimates larger than SEM ones by 0.1 or more, while only 18.9% did vice
versa (Fig. 2). At the other vertices (46.2%), the heritability differences were very
small (<0.1). In considering the results, the correction for multiple comparisons
should be carefully performed for the results from SEM.
Fig. 2. The heritability estimate differences between FF and SEM. The vertices on the whole
cortices are represented on the x axis and are numbered from 1 to 81,924. The y axis shows the
subtraction of SEM heritability estimates from FF heritability estimates.
4 Conclusions and Future Works
We presented a simple method to apply genetic analyzing tools for neuroimaging
researches. SEM analysis has many advantages over Falconer’s approach. Falconer’s
method provides nothing but heritability estimates, whereas SEM provides the
statistical significance as well as heritability estimates. Moreover, SEM can
distinguish shared and random environmental effects. Now, the proposed method
facilitates diverse and complex models that were used only in genetic research for
neuroimaging analysis including anatomical and functional MRI. In future, we will
apply multivariate SEM model for anatomical and functional neuroimaging analysis.
86

References
1. Chung, M. K., Worsley, K. J., Robbins, S., Paus, T., Taylor, J., Giedd, J. N., et al. (2003).
Deformation-based surface morphometry applied to gray matter deformation. Neuroimage,
18(2), 198-213.
2. Collins, D. L., Neelin, P., Peters, T. M., & Evans, A. C. (1994). Automatic 3D intersubject
registration of MR volumetric data in standardized Talairach space. J Comput Assist
Tomogr, 18(2), 192-205.
3. Falconer, D. S., & MacKay, T. F. C. (1996). Introduction to Quantitative Genetics (4th
ed.). Harlow, Essex, UK: Longman.
4. Ihaka, R., & Gentleman, R. (1996). R: A Language for Data Analysis and Graphics.
Journal of Computational and Graphical Statistics, 5(3), 299-314.
5. Kabani, N., Le Goualher, G., MacDonald, D., & Evans, A. C. (2001). Measurement of
cortical thickness using an automated 3-D algorithm: a validation study. Neuroimage,
13(2), 375-380.
6. Kim, J. S., Singh, V., Lee, J. K., Lerch, J., Ad-Dab'bagh, Y., MacDonald, D., et al. (2005).
Automated 3-D extraction and evaluation of the inner and outer cortical surfaces using a
Laplacian map and partial volume effect classification. NeuroImage, 27(1), 210-221.
7. Koten, J. W., Jr., Wood, G., Hagoort, P., Goebel, R., Propping, P., Willmes, K., et al.
(2009). Genetic contribution to variation in cognitive function: an FMRI study in twins.
Science, 323(5922), 1737-1740.
8. MacDonald, D., Kabani, N., Avis, D., & Evans, A. C. (2000). Automated 3-D extraction of
inner and outer surfaces of cerebral cortex from MRI. NeuroImage, 12(3), 340-356.
9. Neale, M. C., Boker, S. M., Xie, G., & Maes, H. H. (2003). Mx: Statistical Modeling (6th
ed.). VCU Box 900126, Richmond, VA 23298: Department of Psychiatry.
10. Sled, J. G., Zijdenbos, A. P., & Evans, A. C. (1998). A nonparametric method for automatic
correction of intensity nonuniformity in MRI data. IEEE Trans Med Imaging, 17(1), 87-97.
11. Zijdenbos, A. P., Forghani, R., & Evans, A. C. (2002). Automatic "pipeline" analysis of 3-
D MRI data for clinical trials: application to multiple sclerosis. IEEE Trans Med Imaging,
21(10), 1280-1291.
87
