
BIORESPONSE TO STEREOSCOPIC MOVIES
PRESENTED VIA A HEAD-MOUNTED DISPLAY
Takada Hiroki
Graduate School of Engineering, University of Fukui, 3-9-1 Bunkyo, Fukui, Japan
Matsuura Yasuyuki, Fujikake Kazuhiro, Miyao Masaru
Graduate School of Information Science, Nagoya University, Furo-cho, Nagoya, Japan
Keywords: Visually induced motion sickness (VIMS), Stabilometry, Sparse density (SPD), Head acceleration, Transfer
function analysis.
Abstract:
Three-dimensional (3-D) television sets are already available in the market and are becoming
increasingly popular among consumers. The 3-D movies they play, however, induce the negative
sensations of asthenopia and motion sickness in some viewers. Visually induced motion sickness
(VIMS) is caused by sensory conflict, i.e., a disagreement between vergence and visual
accommodation during the viewing of stereoscopic images. VIMS can be analyzed both subjectively
and physiologically. The objective of this study is to develop a method for detecting VIMS. We
quantitatively measured head acceleration and body sway during viewer exposure to both a two-
dimensional (2-D) image and a conventional three-dimensional (3-D) movie. The subjects wore head-
mounted displays (HMDs) and maintained the Romberg posture for the first 60 s and a wide stance
(midlines of the heels 20 cm apart) for the next 60 s. Head acceleration was measured using an active
tracer at a sampling frequency of 50 Hz. Subjects completed the Simulator Sickness Questionnaire
(SSQ) immediately afterwards. Statistical analysis was then applied to the SSQ subscores and to each
index of stabilograms.
Transfer function analysis indicated that the acceleration of the head in the anterior-
posterior direction while watching a 3-D movie can affect lateral body sway, thereby causing VIMS.
1 INTRODUCTION
Three-dimensional (3-D) television sets are
already available in the market and are becoming
increasingly popular among consumers. The 3-D
movies they play, however, induce the negative
sensations of asthenopia and motion sickness in
some viewers.
Although the most widely known
theory of motion sickness is based on the concept of
sensory conflict (Reson, 1978), Riccio and
Stoffregen (1991) argued that motion sickness is
caused not by sensory conflict, but by postural
instability.
The equilibrium function in humans deteriorates
during the viewing of 3-D movies (Takada et al.,
2007). This visually induced motion sickness
(VIMS) has been considered to be caused by a
disagreement between vergence and visual
accommodation during the viewing of 3-D images.
VIMS can be measured using psychological and
physiological methods; among these, the Simulator
Sickness Questionnaire (SSQ) is a well-known
psychological approach to measuring the extent of
motion sickness (Kennedy et al., 1993). In this
study, the SSQ is used for verifying the occurrence
of VIMS. The following parameters of autonomic
nervous activity are appropriate for a physiological
assessment: heart rate variability, blood pressure,
body sway, electrogastrography, and galvanic skin
reaction (Holomes and Griffin, 2001). A wide stance
(with the midlines of the heels 17–30 cm apart)
reportedly results in a significant increase in the total
locus length in stabilograms for individuals with
high SSQ scores, while the length in those of
individuals with low scores is less affected by such a
stance (Scibora et al., 2007).
Mathematically, the sway in the center of
pressure (COP) is described as a stochastic process
(Collons and De Luca, 1993, and Emmerrik et al.,
1993). The anterior-posterior (y) direction was
433
Hiroki T., Yasuyuki M., Kazuhiro F. and Masaru M..
BIORESPONSE TO STEREOSCOPIC MOVIES PRESENTED VIA A HEAD-MOUNTED DISPLAY .
DOI: 10.5220/0003155104330437
In Proceedings of the International Conference on Bio-inspired Systems and Signal Processing (BIOSIGNALS-2011), pages 433-437
ISBN: 978-989-8425-35-5
Copyright
c
2011 SCITEPRESS (Science and Technology Publications, Lda.)

considered to be independent of the medial-lateral
(x) direction (Goldie et al., 1989). The following
stochastic differential equations (SDEs) on the
Euclid space E
2
∋(x, y) have been proposed as
mathematical models that can generate stabilograms.
)()( twxU
xt
x
xx
+
∂
∂
−=
∂
∂
, (1.1)
)()( twyU
yt
y
yy
+
∂
∂
−=
∂
∂
, (1.2)
where w
x
(t) and w
y
(t) express white noise terms. We
examined the adequacy of using an SDE and
investigated the most adequate equation for our
research. G(x), the distribution of the observed point
x, is related to V(x), the (temporal averaged)
potential function in the SDE, which has been
considered as a mathematical model of swaying, in
the following way:
.)(ln
2
1
)( constxGxV +−=
G
G
(2)
The nonlinear property of SDEs is important
(Takada et al., 2001). There were several minimal
points of the potential. In the vicinity of these points,
local stable movement with a high-frequency
component can be generated as a numerical solution
of the SDE. We can therefore expect a high density
of observed COP in this area on the stabilogram.
Using the SSQ and stabilometry, in this study we
examined whether VIMS is in fact induced by a
stereoscopic movie. We wondered if noise terms
vanished from the mathematical model (SDEs) of
body sway. Using our Double-Wayland algorithm
(Takada et al., 2006), we evaluated the degree of
visible determinism of the dynamics of body sway.
We also investigated the relationship between body
sway and head acceleration by performing transfer
function analysis.
The correlation between head movement and the
movement of the center of gravity has been
investigated in general, and a corporative effect was
found in their relationship (Sakaguchi et al., 1995).
By showing a stereoscopic movie to subjects,
Takeda et al. verified that there is a corporative
correlation between head movement and body sway
(Takeda et al., 1995). We herein assume that the
input signal, x(t), is the head acceleration in the
transfer system to control body sway, as shown in
Figure 1. In this figure, we denote the Fourier
transform by a capital letter that corresponds to the
letter of the function being transformed (such as y(t)
and Y(f)). The transfer function H(f) is defined as a
Fourier transform of the impulse response h(f). In
our experiments, we cannot observe the output
signal of the transfer system; only the signal added
to the noise n(t) can be observed. Based on the
following theorem (Winner-Khinchine)
W
xx
= |X(f)|
2
= σ
x
2
ℱ (R
xx
), (3)
we can easily estimate a power spectrum W
xx
. On
the right-hand side of Equation (3),
σ
x
expresses the
standard deviation and ℱ (R
xx
) indicates the Fourier
transform of the autocorrelation function with
respect to the signal x(t). In this study, we estimate
the transfer function that controls body sway.
We also examine whether
the motion sickness
induced by 3-D images affected body sway and
head acceleration and the changes in the control
system.
2 MATERIALS AND METHODS
Ten healthy subjects (age: 23.6 ± 2.2 years)
voluntarily participated in this study, and each of
them provided informed consent prior to
participation.
We ensured that the subjects’ body sway was not
affected by environmental conditions. With an air
conditioner, we were able to maintain the room
temperature at 25 °C. We also kept the room dark.
The subjects wore a head-mounted display (HMD;
iWear AV920; Vuzix Co. Ltd.) on which 2 kinds of
images were presented in a random order: (I) a static
visual target (circle) with a diameter of 3 cm; and
(II) a conventional 3-D movie that showed a sphere
that approaches and moves away from the subject
with irregular movement.
Before the subjects’ body sway was recorded, the
subjects stood still on the detection stand of a
stabilometer (G5500; Anima Co. Ltd.) in the
Romberg posture with their feet together for 1 min.
Each sway of the COP was then recorded at a
sampling frequency of 20 Hz during measurements,
while head acceleration was simultaneously
recorded by an active tracer (AC-301A; GMS Co.
Ltd.) at 50 Hz. Subjects were instructed to maintain
the Romberg posture for the first 60 s and a wide
stance (with the midlines of their heels 20 cm apart)
for the next 60 s. The subjects viewed one of the
images, i.e., (I) or (II), on the HMD from the
beginning until the end. The SSQ was filled out both
before and after stabilometry testing.
We calculated several indices that are commonly
used in the clinical field (Suzuki et al., 1996) for
stabilograms, such as “area of sway,” “total locus
BIOSIGNALS 2011 - International Conference on Bio-inspired Systems and Signal Processing
434
length,” and “total locus length per unit area.” In
addition, new quantification indices that were
termed “sparse density” (SPD), “total locus length of
chain” (Takada et al., 2003), and “translation error”
were also estimated.
When subjects stood with their feet close together
(Romberg posture), the coherence function between
the head acceleration x(i) and the movement of the
centre of gravity y(j) was estimated as
coh
x(i)y(j)
(f) = |W
x(i)y(j)
|
2
/(W
x(i)x(i)
W
y(j)y(j)
), (4)
where i and j express the component (1: lateral, 2:
anterior/posterior). By using the Fast Fourier
transform algorithm, power spectrums W
x(i)x(i)
,
W
y(j)y(j)
were estimated. On the basis of Equation (4),
we calculated cross spectrums W
x(i)y(j)
. Coherence
indicates an index for the degree of linear correlation
between input and output signals (0 ≤ coh ≤ 1).
There is a completely linear correlation between
these signals when coh = 1. In this study, we
assumed that a linear system intervenes between the
head and the body sway only if coh ≥ 0.12 (a
significant correlation coefficient for N = 512, p <
0.01).
3 RESULTS
After subjects were exposed to a conventional 3-D
movie (II), the scores for SSQ-N (nausea), SSQ-OD
(eyestrain), SSQ-D (disorientation), and SSQ-TS
(total score) were 11.4 ± 3.7, 18.2 ± 4.1, 23.7 ± 8.8,
and 19.8 ± 5.3, respectively. Symptoms of sickness
seemed to appear with exposure to the stereoscopic
images, albeit with large individual differences.
The amplitudes of body sway that were
observed during the exposure to the movie tended
to be larger than those of the control sway.
Although a
high density of COP was observed in
the stabilograms for the resting state (I), the density
decreased during exposure to a conventional
stereoscopic movie (II). Furthermore, stabilograms
measured with subjects’ feet wide apart were
compared with those when they assumed the
Romberg posture. The COP was not isotropically
dispersed, but was characterized by considerable
movement in the anterior-posterior (y) direction. The
diffusion of COP was larger in the lateral (x)
direction and had spread to the extent that it was
equivalent to the stabilograms for the resting state.
According to the two-way analysis of
variance (ANOVA) with repeated measurements,
there was no correlation between the factors of
posture (Romberg posture or standing posture with
feet wide apart) and images (I or II). For the total
locus length, area of body sway, and SPD, the main
effects were in response to both factors (p < 0.01).
Multiple comparisons revealed that these indices
significantly increased when the subjects viewed the
3-D movie (II) with their feet close together
(Romberg posture). VIMS could be detected by
these indices for the stabilograms. Whether or not
the subjects were exposed to the 3-D movies, the
value for E
trans
derived from the temporal differences
of those time series x, y was approximately 1
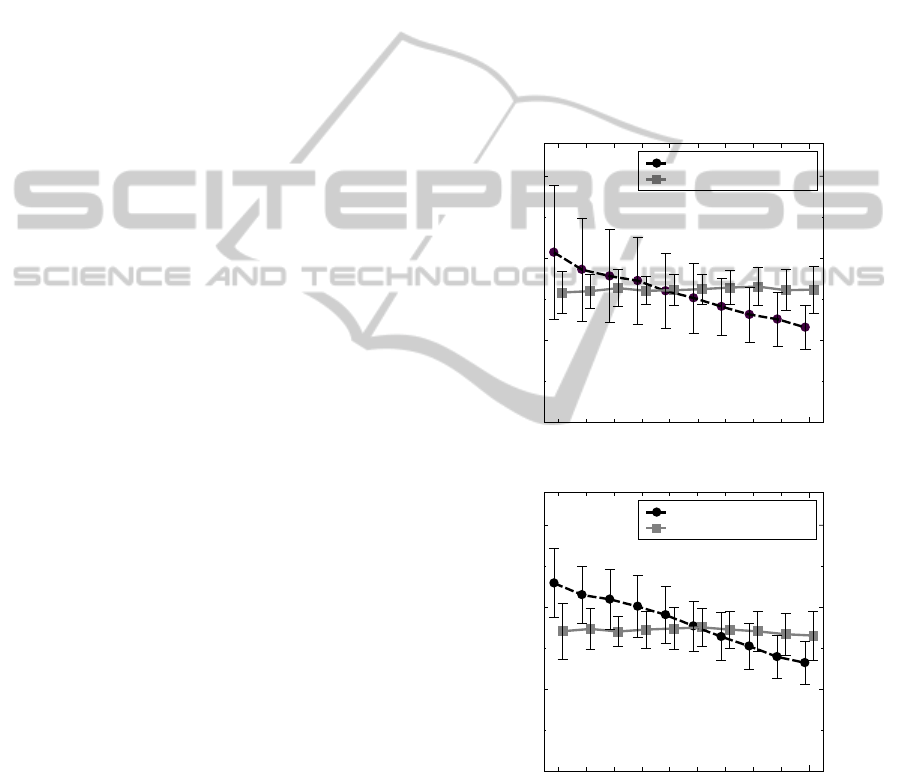
(Figure 1). These translation errors in each
embedding space were not significantly different
from the translation errors derived from the time
series x, y.
12345678910
0.0
0.5
1.0
1.5
Dimension of Embedding space
Translation Error (E
trans
)
Time Series
Differenced Time Series
12345678910
0.0
0.5
1.0
1.5
Dimension of Embedding space
Translation Error (E
trans
)
Time Series
Differenced Time Series
Figure 1: Mean translation error for each embedding
space. Representative results of the Double-Wayland
algorithm are derived from the lateral sway x. Translation
errors were estimated from stabilograms that were
observed when subjects viewed (a) a static circle and (b) a
conventional 3-D movie.
When the subjects stood with their feet close
together (Romberg posture), transfer function
(a)
(b)
BIORESPONSE TO STEREOSCOPIC MOVIES PRESENTED VIA A HEAD-MOUNTED DISPLAY
435

analysis was performed using the head acceleration
(input) and the body sway (output). We estimated
the coherence function (4), i.e., coh
x(1)y(1)
(f),
coh
x(1)y(2)
(f), coh
x(2)y(1)
(f), and coh
x(2)y(2)
(f). For any
frequency, coh
x(1)y(1)
(f) and coh
x(1)y(2)
(f) were less
than 0.12 (a significant correlation coefficient for N
= 512, p < 0.01). On the other hand, coh
x(2)y(2)
(0.51)
was more than 0.12. coh
x(2)y(j)
(0.51) and coh
x(2)y(j)
(7)
were remarkably augmented by exposure to the 3-D
movie (II) for j = 1, 2.
4 DISCUSSION
A theory has been proposed regarding how to obtain
SDEs as a mathematical model of body sway on the
basis of a stabilogram. Multiple comparisons
indicated that the SPD S
2
during exposure to the
stereoscopic movie was significantly larger than that
during exposure to the static control image (I) when
subjects stood in the Romberg posture. The same
calculation results were also obtained for S
3
. The
standing posture would become unstable due to the
effects of the stereoscopic movie. As mentioned
above, structural changes occur in the time-averaged
potential function (2) upon exposure to stereoscopic
images, which are assumed to reflect the sway in the
center of gravity. While subjects watch the 3-D
movie, their lateral sway might become dependent
on its transverse component in the head movement.
Scibora et al. (2007) concluded that the total
locus length of subjects with prior experience of
motion sickness increased with exposure to a virtual
environment when they stood with their feet wide
apart, In our study, however, the degree of sway was
found to be significantly less when the subjects
stood with their feet wide apart than when they stood
with their feet close together (Romberg posture).
However, the total locus length during exposure to a
conventional stereoscopic movie was significantly
longer than that during exposure to the control
image when they stood with their feet wide apart. As
shown in Figure 4d, a clear change in the form of the
potential function (1) occurs when the feet are wide
apart.
Regardless of posture, the total locus length
during exposure to the conventional 3-D movie (II)
was significantly greater than that during exposure
to the control image. Moreover, the total locus
length of the chain tended to increase when subjects
were exposed to conventional 3-D images (II), as
compared to when they were exposed to (I). Hence,
by using these indicators for the stabilogram (total
locus length and that of chain), we were able to note
postural instability associated with the exposure to
conventional stereoscopic images (II).
In this study, the degree of determinism in the
dynamics of the sway of the COP was
mathematically measured. The Double-Wayland
algorithm was used as a novel method. E
trans
> 0.5
was obtained by the Wayland algorithm (Figure 1),
which implies that a time series could be generated
by a stochastic process in accordance with a
previous standard (Matsumoto et al., 2002). The
threshold 0.5 is half of the translation error that
results from a random walk. Body sway has been
described previously in terms of stochastic processes
(Collons and De Luca, 1993, Emmerrik et al., 1993,
and Takada et al., 2001), which were demonstrated
with the Double-Wayland algorithm (Takada et al.,
2006). The translation errors estimated by the
Wayland algorithm were similar to those obtained
from the temporal differences. The exposure to 3-D
movies would not change it into a deterministic one.
Mechanical variations were not observed in the
locomotion of the COP. It was assumed that the
COP was controlled by a stationary process, and the
sway during exposure to the static control image (I)
could be compared with that when the subject
viewed 3-D movies. The indices for stabilograms
might reflect the coefficients in stochastic processes,
though the translation error did not indicate a
significant difference between the stabilograms
measured during exposure to the static control image
(I) versus to a conventional 3-D movie (II).
Constructing the nonlinear SDEs (1) from the
stabilograms in accordance with Equation (2), we
find that their temporally averaged potential
functions U
x
, U
y
have plural minimal points, and
fluctuations could be observed in the neighborhood
of these minimal points (Takada et al., 2001). The
variance in the stabilogram depends on the form of
the potential function in the SDE; therefore, the SPD
is regarded as an index for its measurement. The
total locus length increased during the exposure to
conventional 3-D images (II), a phenomenon that
might be caused by the diminution of the gradient at
the bottom of the potential function (Figure 2). We
would note here that it is important to focus on the
nonlinearity of the potential function. We have
succeeded in estimating the decrease in the gradient
of the potential function using the SPD by
performing a one-way analysis of variance.
BIOSIGNALS 2011 - International Conference on Bio-inspired Systems and Signal Processing
436
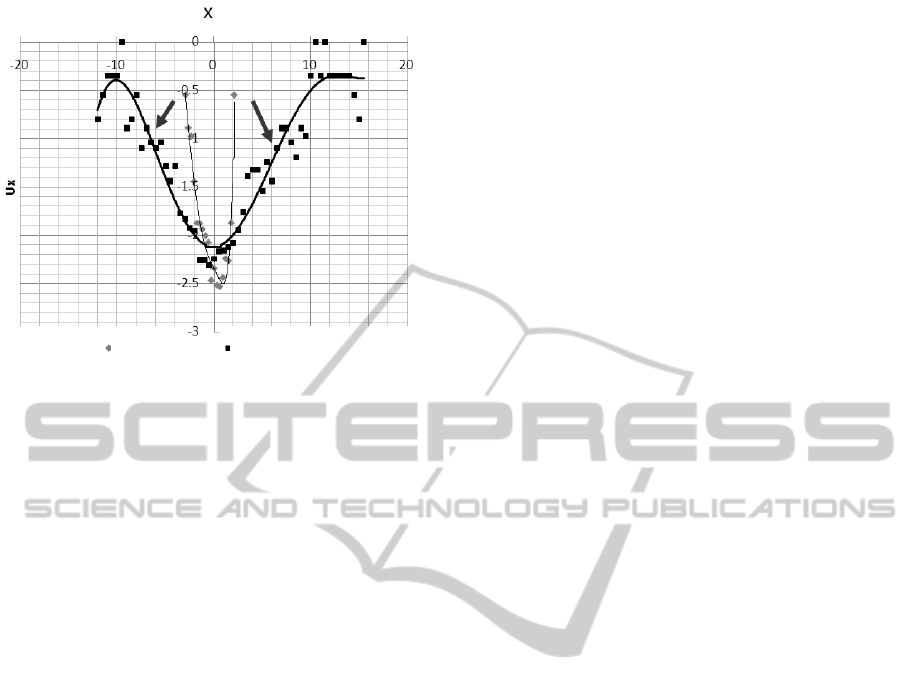
Figure 2: Metamorphosis of potential function. A clear
change in the form of the potential function (2) occurs
when the feet are wide apart.
5 CONCLUSIONS
It has been reported that visually induced motion
sickness (VIMS) is caused by sensory conflict, e.g.,
the disagreement between vergence and visual
accommodation while watching a 3-D movie. In this
study, in order to evaluate VIMS, we simultaneously
recorded the center of gravity and the head
acceleration of subjects while they were exposed to
a 2-D image or were watching a 3-D movie. The
effect of VIMS in subjects who have a tolerance to
motion sickness could be detected, especially by
calculating the sparse density as an index of
stabilograms.
ACKNOWLEDGEMENTS
This work was supported in part by a Grant-in-Aid
from the Hori Foundation for the Promotion of
Scientific Information.
REFERENCES
Collins, J. J., De Luca, C. J., (1993) Open-loop and
closed-loop control of posture: A random-walk
analysis of center of pressure trajectories, Exp. Brain
Res., 95, 308-318.
Emmerrik, R. E. A., Van Sprague, R. L., Newell, K. M.,
(1993). Assessment of sway dynamics in tardive
dyskinesia and developmental disability: sway
profile orientation and stereotypy, Movement
Disorders, 8, 305-314.
Goldie, P., A., Bach, T., M., Evans, O., M., (1989). Force
platform measures for evaluating postural control:
reliability and validity, Arch. Phys. Med. Rehabi., 70,
510-517.
Holomes, S. R., Griffin, M. J., (2001). Correlation
between heart rate and the severity of motion sickness
caused by optokinetic stimulation, J.
Psychophysiology, 15, 35-42.
Kennedy, R. S., Lane, N. E., Berbaum, K. S., Lilienthal,
M. G., (1993). A simulator sickness questionnaire
(SSQ): A new method for quantifying simulator
sickness, International J Aviation Psychology, 3, 203-
220.
Matsumoto, T., Tokunaga, R., Miyano, T., Tokuda, I.,
(2002). Chaos and Time Series. Tokyo: Baihukan
Okawa,
T., Tokita, T., Shibata, Y., Ogawa, T., Miyata, H.,
(1996). Stabilometry-Significance of locus length per
unit area (L/A). Equilibrium Res., 54(3), 296-306.
Reason, J., (1978). Motion sickness adaptation: A Neural
mismatch model. J. Royal Soc. Med., 71, 819-829.
Sakaguchi, M., Taguchi, K., Ixhiyama, T., Netsu, K., Sato,
K., (1995). Relationship between head sway and
center of foot pressure sway, Auris Nasus Larynx,
22(3), 151-157.
Scibora, L. M., Villard, S., Bardy, B., Stoffregen, T. A.,
(2007). Wider stance reduces body sway and motion
sickness. Proc. VIMS 2007, 18-23.
Stoffregen, T. A., Smart, L. J., Bardy, B. J., Pagulayan, R.
J., (1999). Postural stabilization of looking, Journal of
Experimental Psychology, 25, 1641-1658.
Suzuki, J., Matsunaga, T., Tokumatsu, K., Taguchi, K.,
Watanabe, Y., (1996). Q&A and a manual in
Stabilometry, Equilibrium Res., 55(1), 64-77.
Takada, H., Kitaoka, Y., Shimizu, Y., (2001).
Mathematical index and model in stabilometry,
Forma, 16(1), 17-46.
Takada, H., Kitaoka, Y., Ichikawa, S., Miyao, M., (2003).
Physical Meaning of Geometrical Index for
Stabilometry, Equilibrium Res, 62(3), 168-180.
Takada, H., Morimoto, T., Tsunashima, H., Yamazaki, T.,
Hoshina, H., Miyao, M., (2006). Applications of
Double-Wayland algorithm to detect anomalous
signals, Forma, 21(2), 159-167.
Takada, H., Fujikake, K., Miyao, M., Matsuura, Y., (2007).
Indices to detect visually induced motion sickness
using stabilometry, Proc. VIMS2007, 178-183.
Takeda, T., Izumi, S., Sagawa, K., (1995). On the
correlation between head movement and movement of
the center of gravity using HMD, Proc. 1995 IEICE
General Conference, 203.
Wayland, R., Bromley, D., Pickett, D., Passamante, A.,
(1993). Recognizing determinism in a time series,
Phys. Rev. Lett., 70, 530–582.
(
I
)
(
II
)
BIORESPONSE TO STEREOSCOPIC MOVIES PRESENTED VIA A HEAD-MOUNTED DISPLAY
437
