
AUTOMATED BURST DETECTION IN NEONATAL EEG
Sourya Bhattacharyya
1
, Jayanta Mukhopadhyay
1
, Arun Kumar Majumdar
1
Bandana Majumdar
1
, Arun Kumar Singh
2
and Chanchal Saha
2
1
Indian Institute of Technology, Kharagpur, West Midnapore 721302, West Bengal, India
2
SSKM Hospital, Kolkata 700020, West Bengal, India
Keywords: Electroencephalogram (EEG), Neonatal Intensive care Unit (NICU), EEG Burst Suppression, Amplitude
integrated EEG (aEEG).
Abstract: Presence of burst suppression pattern in neonate EEG is a sign of epilepsy. Detection of burst patterns is
normally done by visual inspection of recorded raw EEG or amplitude integrated EEG signal. Existing
automatic burst detection approaches consist of either supervised learning mechanism or static energy
threshold based comparison. Both approaches can produce inconsistent results for babies with different ages
(for example, a neonate EEG and a six month old baby EEG). That is because, EEG signal amplitude or
energy increases according to baby’s age. Training based classifiers or static thresholds cannot adapt with
this amplitude variation. Here we propose an automatic burst detection method, which first computes signal
parameters such as energy, variance and power spectral density. From generated signal data, so called low
level amplitude or energy output is used as a ground reference for indication of signal suppression level.
Burst is identified according to high deviation of parameter values from those in suppression pattern. It does
not need any static threshold based comparison. Results show that our algorithm exhibits greater sensitivity
and equal specificity than existing methods. Due to adaptive thresholding for burst detection, our method is
applicable for analyzing EEG signals of babies with different ages.
1 INTRODUCTION
Electroencephalogram (EEG) monitors cerebral
electrical activities through electrodes placed on
scalp and provides a sensitive real time graphical
representation of brain function. Especially for
neonates, neurophysiological disorders and seizures
are mostly diagnosed by visual inspection of EEG
signals. Reason behind that is, unlike the seizure
cases in adults or matured children, neonates
commonly do not exhibit clinical sign and symptoms
(Connell et. al., 1989) for seizures. Thus visual
inspection of EEG for monitoring seizures is a
standard of care for most neonatal intensive care
units (NICUs) around the world (Rennie, 2008;
Sanei, 2007).
Burst suppression pattern is one of the typical
abnormal EEG patterns which are seen in neonatal
seizures. It is a pattern of high amplitude activity
interrupted by relatively low amplitude activity
typically less than twenty micro volts peak-to-peak.
High amplitude activity is termed as burst, whereas
low amplitude activity is termed as suppression.
Together, the burst-suppression patterns usually
have duration of a few seconds. They occur in an
unpredictable, irregular fashion. Repeated
occurrence of burst-suppression patterns produces a
burst-suppression cycle or event, which can be used
to predict epilepsy. Burst portions contain
physiological burst (normal) and pathological burst
or seizures (if present). Generally, visual inspection
of raw EEG signal is employed to detect burst-
suppression pattern. This visual detection is very
much subjective to the respective viewer (Löfhede,
2008; Löfhede, 2010; Wang, 2007).
Burst detection using amplitude integrated EEG
(aEEG) (Hellström-Westas L, 2008; Maynard et. al.,
1969, 1971) is quite common now. Here, input raw
EEG signal is first band pass filtered in the
frequency range 2-15 Hz to attenuate electrical
activities outside this range. Filtered EEG is then
rectified (i.e. negative voltages are converted to
positive values) and peak to peak voltages are
measured. Finally smoothing and semi-logarithmic
scale based compression is applied. It is very helpful
in detecting long term EEG trends (of several hours,
for example). Prolonged burst patterns can be
15
Bhattacharyya S., Mukhopadhyay J., Majumdar A., Majumdar B., Singh A. and Saha C..
AUTOMATED BURST DETECTION IN NEONATAL EEG.
DOI: 10.5220/0003123900150021
In Proceedings of the International Conference on Bio-inspired Systems and Signal Processing (BIOSIGNALS-2011), pages 15-21
ISBN: 978-989-8425-35-5
Copyright
c
2011 SCITEPRESS (Science and Technology Publications, Lda.)
identified through visual inspection of single
channel or multiple channel aEEG patterns. But,
short term bursts cannot be easily identified from the
compressed logarithmic scale display of aEEG
patterns (Hellström-Westas L, 2008). Thus,
considering huge amount of recorded data, it is
necessary to develop mechanisms for automatic
detection of burst suppression patterns, without any
need of visual inspection.
Section 2 lists earlier works on the proposed topic.
Section 3 describes our approach. Finally in section
4, we show that our proposed approach has a
consistent high performance in detecting burst
patterns for babies of any age.
2 RELATED WORKS
There are many burst detection algorithms which are
classified based on whether they use any training
data for supervised learning and classification, or
whether they use static threshold based burst pattern
detection.
Automated burst detection algorithm using non
linear energy operator (NLEO), applied upon EEG
band and artefact band signal (Palmu, 2010; Särkelä,
2002) falls in the second category. In this algorithm,
EEG signal is first divided in two frequency bands:
1) EEG band (0.1-8 Hz), 2) Artefact band (47-49
Hz). For each sample i, if we say that x(i) is the
value of corresponding band filtered EEG at that
sample, then NLEO output for that sample is written
as:
NLEO(x(i)) = x(i) x(i-3) – x(i-1) x(i-2) (1)
For each sample i, difference of NLEO outputs
between EEG band and artefact band signals is
evaluated as follows.
DIFF(x(i)) = NLEO_EEG_band(x(i)) –
NLEO_artefact_band(x(i))
(2)
If this difference is persistently greater than certain
predefined burst threshold value for at least
minimum burst duration (which is set as 1 second),
then the algorithm notifies occurrence of a burst
pattern. Similarly, if this difference stays below a
fixed suppression threshold for a certain period of
time then it indicates the occurrence of a suppression
pattern.
This fixed threshold based burst pattern detection
method, however, leads to two kinds of drawback:
1) Recorded EEG signal amplitudes or energy
values increase along with baby’s age. Thus,
static threshold value based decision is not
suitable for burst detection over babies of
different ages.
2) Ranges of EEG amplitudes or energy values
vary on different recording channels. For
example, involvement of occipital channel (O1
or O2) results in generation of higher EEG
amplitude than EEGs from frontal channel (FP1
or FP2). Thus a fixed threshold cannot properly
detect burst in all channels.
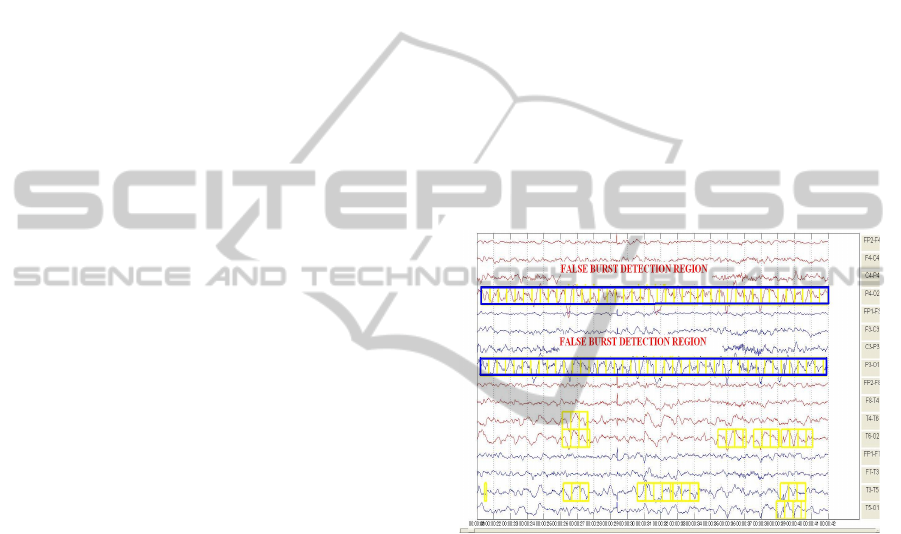
Figure 1 shows false burst detection for one EEG of
six month old baby, throughout the channels P4-O2
and P3-O1, for the NLEO based algorithm as
discussed above. The display has sensitivity 15
µv/mm and time base 15 mm/sec. Due to static
threshold based calculations, high amplitude
recordings are misclassified as bursts. On the other
hand, bursts in frontal channels FP1 or F8 can not be
detected because of their relatively low amplitude.
Figure 1: False burst detection (marked in blue rectangles)
for NLEO based algorithm for a 6 month old baby, for
channels P4-O2 and P3-O1. Here, high amplitude
recordings throughout are misclassified as bursts.
In other words, for the NLEO based algorithm, high
amplitude recordings (compared to the predefined
static burst detection threshold) are always detected
as bursts. Similarly, bursts in relatively low
amplitude recordings may not be detected.
Another algorithm based on computation of
moving instantaneous amplitude and comparison
with threshold (Wang, 2007) has the provision of
dynamically setting the amplitude threshold. But it is
dependent upon visual perception, rather than
individual channel data based adaptation. So it also
does not generalize burst suppression detection for
babies.
Algorithms which use training data based
supervision extract several features like spectral
edge frequency, 3 Hz power, median, variance,
BIOSIGNALS 2011 - International Conference on Bio-inspired Systems and Signal Processing
16

Shannon entropy (Löfhede, 2008, 2010; Greene,
2008) etc. Training data is obtained by feature
values at burst instances which are manually marked
by experts. But this training based algorithm which
uses feature values during burst duration, is also not
free from the problem of false burst detection or
non-detection during high or low amplitude EEG
signals.
A general burst suppression pattern detector
should consider transition of feature values from
burst to suppression or background EEG or vice
versa. This analysis should be adaptive as per
individual channel data, so as to avoid
misclassification for wide variety of samples. Our
approach adapts burst or suppression thresholds
according to channel data. Using these adaptive
thresholds, burst patterns are detected. It leads to
generalized and high performance burst pattern
detection despite the variation of baby’s age or
channel data.
3 PROPOSED METHOD
3.1 Dataset
We perform the study over eight full term infants
having epileptic data and clear burst suppression
pattern. The data set is obtained from Department of
Neonatology, SSKM hospital, Kolkata, India.
During data recording, bipolar longitudinal montage
with sixteen electrodes is used, according to
international 10-20 standard (Rennie, 2008), at
positions FP1, FP2, F3, F4, P3, P4, O1, O2, C3, C4,
T3, T4, F7, F8. Voltage difference of two electrodes
is used as the input data, for example P4-O2 or C3-
P3. Each data has duration of 20 to 30 minutes. The
data covers babies of age from 6 days to 8 months.
Thus detecting proper burst patterns in this dataset
confirms generalized utility of our approach.
At least ten multi channel burst patterns are
present in each input data. Burst patterns are
manually marked by doctors. They also identify and
mark the artefacts to separate them from burst
patterns. In our algorithm, we check for only correct
burst pattern detection; detection of artefacts and
automatic separation of them from burst patterns is
not exercised.
3.2 Feature Extraction
The available data is digitized at a sampling rate of
256 Hz and band pass filtered between 0.5 to 20 Hz.
The band pass filter has its high pass component of a
1
st
order Butterworth filter and low pass component
of a 6
th
order elliptic filter. For the feature extraction
purpose, a sliding window of 1 second time
resolution and 0.5 second displacement is applied.
That is, features are extracted for second intervals 1-
2, 1.5-2.5, 2-3 and so on. Following features are
extracted for each time interval of 1 second duration:
1) Mean non linear energy (Greene, 2008)
2) Variance (Löfhede, 2008),
3) Power spectral density (Welch, 1967),
4) Total sum of absolute values of amplitudes.
If x(i) is the value of filtered EEG for sample i
residing in the window interval then mean non linear
energy (MNLE) for that window interval is given by
equation (3). For a burst pattern, mean non linear
energy value goes significantly higher from that of a
background or suppression EEG pattern.
MNLE = ∑(x
2
(i) – x(i-1) x(i+1)) for all
sample i lying within window interval
(3)
Similarly, variance (VAR), given in the equation (4),
has a significantly higher value in case of a burst
pattern occurrence as compared to its value during
background or suppression EEG pattern.
VAR = (1/(n-1)) ∑ (x(i)
– μ)
2
for all sample
i lying within window; μ is sample mean
(4)
Power spectral density (PSD) shows the distribution
of signal power with respect to frequency. Total
PSD value over bandwidth of signal under one
window interval is significantly higher during burst
pattern occurrence, as compared to its value in
background or suppression EEG.
Sum of absolute voltage values in signal under one
window interval has high value during burst and
comparatively much lower values during
background or suppression EEG.
All the feature extraction and subsequent
implementation is done in MATLAB version 7.8.0.
3.3 Burst Detection Algorithm
Generally, for visual detection of a burst pattern,
necessary sensitivity adjustments in display interface
are made in order to first make the so called general
amplitude output as a ground reference. Then bursts
are detected based on high signal fluctuations from
the average outcome. This principle is applied in our
burst detection algorithm.
In burst intervals, extracted feature values
deviate highly from their normal or average values
(i.e. values in background EEG patterns). To detect
burst portions, we need to determine two things:
AUTOMATED BURST DETECTION IN NEONATAL EEG
17

1) Meaning of average or background EEG
pattern and how it is represented by features
mentioned in section 3.2.
2) Benchmark of deviation of feature values in
burst portions as compared with average or
background EEG pattern.
We model average or background EEG pattern by
implementing separate circular queues for different
features like mean non linear energy, variance and
power spectral density. Each queue stores respective
feature values of last five seconds corresponding to
suppression or close to suppression intervals. Thus
effectively it stores ten feature values because
overlapping window is of 0.5 second displacement
and 1 second resolution. Initially each queue
contains median value of respective feature data
generated from total signal.
Current EEG portion under analysis is marked by
sliding window. If current EEG portion has feature
value less than or close to the mean value of feature
data currently stored in the queue, then we decide
that current EEG portion is from background or
average EEG pattern. In that case, current feature
data is stored in respective feature queue. Queue
update for each feature is thus independent of other
feature queue updates. Using a circular queue
enables replacement of least recent data with current
one, provided the queue is already full.
To determine whether current EEG portion is a
burst, we compare extracted feature values with
respect to mean feature values of respective queue.
Formally, we define val
nle, valvar, valpsd, and valamp as
values of mean non linear energy, variance, power
spectral density and sum of absolute voltages for
current EEG portion. These values change as queue
elements are updated with latest background EEG
data. Similarly, mean
nle, meanvar and meanpsd are
defined as mean values of queues storing non linear
energy, variance and power spectral density
respectively.
If current EEG portion generated feature values
(val
nle, valvar and valpsd) are greater than the mean
values of feature queues (mean
nle, meanvar and
mean
psd
respectively) by some multiples, then we
label current portion as possible burst. But, as we
model the EEG burst with respect to current channel
background EEG data, it may happen that current
possible burst portion has very low amplitude, thus
not visually identifiable as burst. This case can
happen when background EEG has very low activity
for some time. So we compare the sum of absolute
voltages for current EEG portion (val
amp) with
respect to a predefined threshold. If the voltage sum
is greater than the threshold then current region is
labeled as a burst. The algorithmic steps are shown
in figure 2.
Input:
Feature values of current EEG window.
Output:
Current EEG portion is burst or not (Boolean decision). If
true, we mark the burst start and end times.
Variables:
z1, z2, z3 are integers. th is voltage threshold.
z1 = z2 = z3 = 5 (experimentally set)
th = 15000 (experimentally set)
Algorithmic Steps:
1) If (valnle > z1 × meannle) and (valamp > th)
If (valvar > z2 × meanvar) or (valpsd > z3 × meanpsd)
Mark start of current time interval as burst start time.
2) If conditions in step 1 are not met and if there is an
ongoing burst interval then
Mark ongoing burst end time equal to midpoint of
current time interval.
3) If valnle is less than or very close to meannle then add
it in the circular queue for non linear energy values.
Similarly queues of variance and power spectral density
are updated if valvar is less than or close to meanvar and
valpsd is less than or close to meanpsd respectively.
Figure 2: Our proposed burst detection algorithm.
If, for time interval between x second to (x+1)
second, extracted features confirm start of a burst,
then burst start time is set as x second (according to
step 1). Now, if for the next analyzed time interval
(that is, between (x+0.5) second to (x+1.5) second),
features confirm end of the burst (according to step
2), then burst end time is marked as the midpoint of
current time interval; that is (x+1) second. So, in
effect, time interval x to (x+1) is marked as a burst
interval. Minimum burst duration is thus set to 1
second.
Finally, we mark the burst intervals generated from
above algorithm in a custom signal display interface
to visually check and compare with existing
approaches.
4 EXPERIMENTAL RESULTS
We executed our approach in the dataset mentioned
in section 3.1. We have also implemented NLEO
based algorithm (Palmu, 2010; Särkelä, 2002). We
perform both visual and statistical comparisons
between outcomes of these two algorithms. Input
data set was examined by doctors and burst patterns
were marked by them. We evaluate and validate
BIOSIGNALS 2011 - International Conference on Bio-inspired Systems and Signal Processing
18
performances of both algorithms with respect to
marked burst patterns.
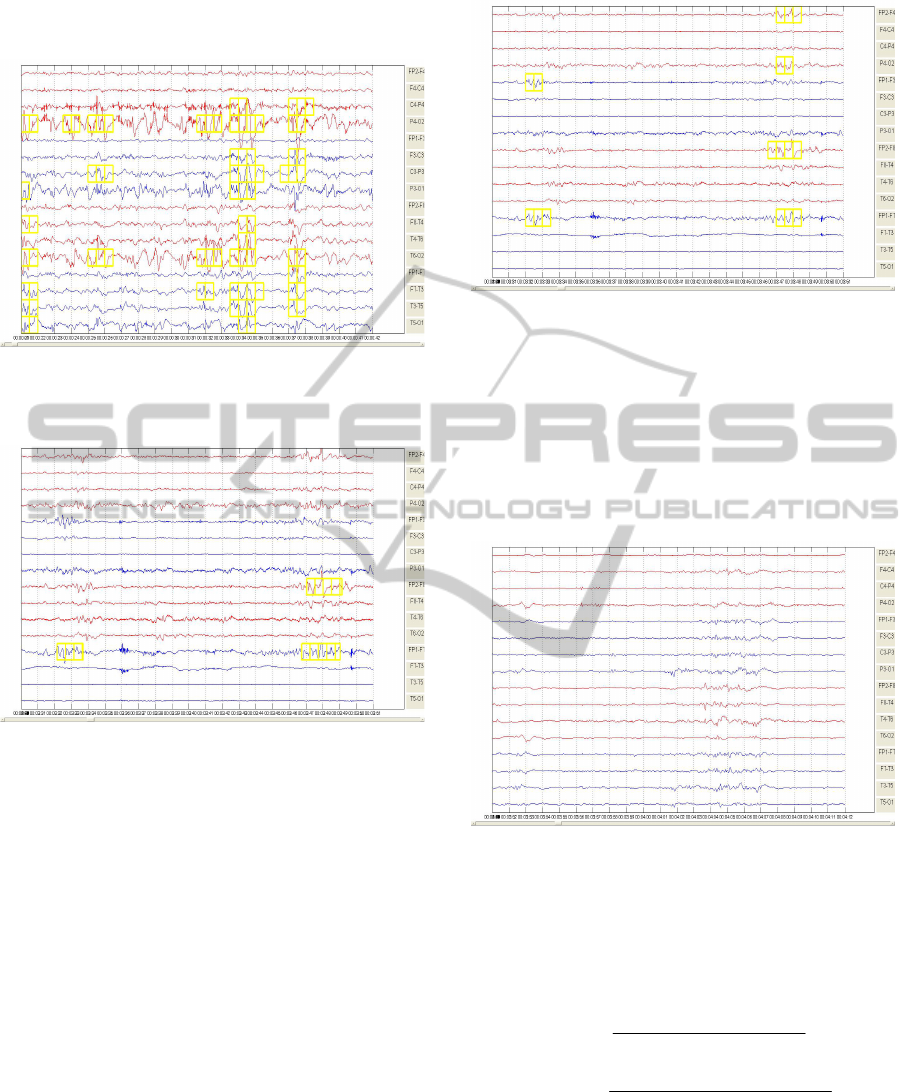
Figure 3: Correct burst detection case (marked in yellow)
for channels P4-O2 and P3-O1 in our algorithm
corresponding to figure 1.
Figure 4: Burst detection in NLEO based algorithm for a
10 days old baby; it can’t detect bursts in FP2-F4 and FP1-
F3 channels (channel no 1 and 5 respectively from top in
display).
In figure 3, we show that our algorithm performs
correct burst detection in channels P4-O2 and P3-
O1, as corresponding to the false burst detection
region cases for NLEO based algorithm (which was
shown in figure 1). Rather than detecting whole
channel data as burst, due to static amplitude
thresholds, it uses the fact that, throughout for the
channels P4-O2 and P3-O1, background EEG
amplitude is quite high. So, corresponding burst
patterns are of quite high amplitude than other
channels.
Figures 4 and 5 show that our result is
comparable with the NLEO based algorithm even in
neonate EEG recording cases. For a 10 days old
baby, our algorithm detects correct burst cases in
multiple channels as compared to old NLEO based
(Palmu, 2010; Särkelä, 2002) approach, which
cannot detect burst in channel FP2-F4 or FP1-F3.
Figure 5: Burst detection in our algorithm as
corresponding to the case in Figure 4; it detects bursts in
FP2-F4 and FP1-F3 channels.
For very acute burst suppression pattern detection
also, our algorithm does better than existing
approach. Figures 6 and 7 show EEG of a 32 days
old neonate. NLEO based algorithm cannot detect
burst in any channel, whereas our algorithm detects
burst for most of the channels.
Figure 6: No burst detection in NLEO based algorithm for
a 32 days old neonate.
For statistical measure based performance
evaluation, we calculated sample sensitivity and
specificity. They are defined in equations (5) and (6)
respectively.
(True Positive * 100)
Sensitivity (%) =
(True Positive + False Negative)
(5)
(True Negative * 100)
Specificity (%) =
(True Negative + False Positive)
(6)
True positive means that a burst is detected by both
visual and automatic detection.
AUTOMATED BURST DETECTION IN NEONATAL EEG
19
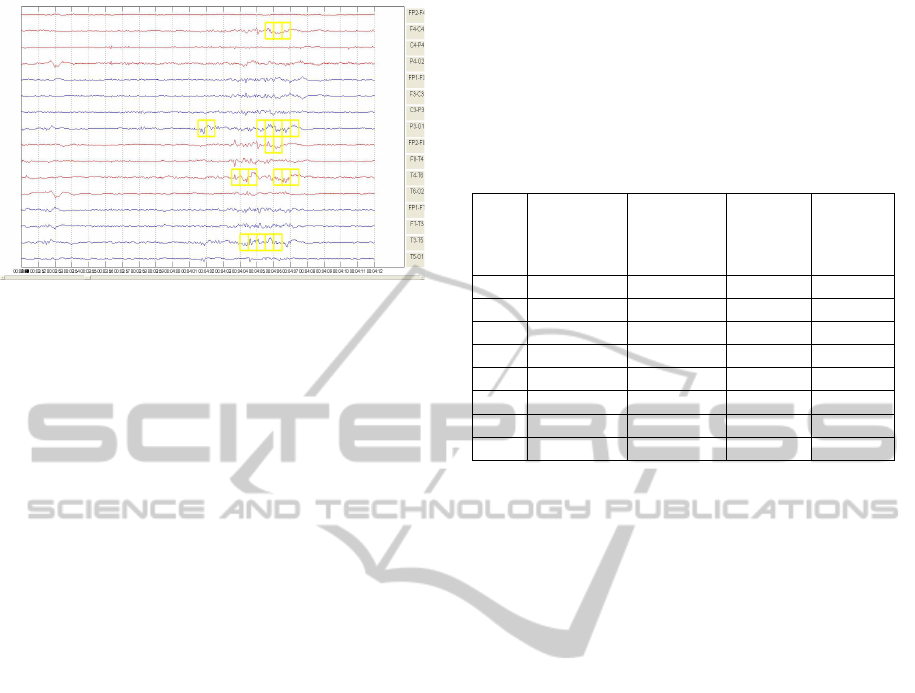
Figure 7: Burst detection (marked in yellow) for our
algorithm corresponding to the case of figure 6.
True negative means that absence of burst is
detected by both visual and automatic detection.
False positive result occurs when automatic method
indicates a burst whereas visual detection cannot
find anything.
Lastly false negative case occurs when automatic
detection method indicates no burst whereas visually
a burst is marked.
The computation includes outcomes for all 16
channels. That is, for a particular multi-channel
burst, if burst for 4 channels are marked originally,
and our algorithm detects only 3 of them then
sensitivity is calculated as 75%.
We show tabular data of sensitivity for both old
NLEO based approach and our algorithm, executed
upon previously mentioned dataset. At first, multi
channel burst patterns for all the channels are
marked by doctors. We select the data files such that
there exists at least 10 visually identifiable multi
channel burst patterns. Then both algorithms are
executed to detect the percentage of bursts that are
correctly identified, for all the marked channels. It is
the required sensitivity value.
It is to be mentioned that, for NLEO algorithm,
maintaining same static burst detection threshold for
all input data gives poor result. So we calculated
separate optimum thresholds, specific to each of the
test data. These thresholds are then applied with
NLEO algorithm. Thresholds are set in such a
fashion that false positive cases are almost
eliminated. In our algorithm also, we found almost
zero false positive case for each of the test data.
Thus both algorithm exhibits almost same specificity
value (close to 100%) for all the test data. We
compare relative sensitivity values for these two
algorithms and show comparative results in Table 1.
We can see that in all cases except result 4,
sensitivity is higher in our algorithm. Also, NLEO
based outcome is highly dependent on choosing
correct burst detection threshold (which we did set
manually by observation for each experiment). On
the other hand, our algorithm’s dynamic adaptation
of thresholds based on channel data gives it slight
edge.
Table 1: Sensitivity comparison for 2 algorithms using
dataset of neonate and baby EEG
Sl No
Age
(D= days,
M= month)
No of multi-
channel burst
patterns seen
Sensitivity
with old
NLEO
algorithm
(%)
Sensitivity
with our
algorithm
(%)
1 6 D 12 94.18 95.35
2 10 D 10 67.44 88.37
3 16 D 25 89.36 95.74
4 39 D 24 95.16 93.0
5 3M 21 79.5 98.7
6 6M 30 86.5 94.6
7 6M 35 84.06 97.15
8 8M 39 92 97
If burst detection threshold is set quite low in NLEO
algorithm, then for high amplitude signals, it shows
continuous burst, increasing false positive rate
(similar to the case shown in figure 1). Our
algorithm is free from any such false positive case
detection.
5 CONCLUSIONS
We have described a simple dynamic threshold
based automatic burst detection algorithm. It can be
used in analyzing EEG bursts for neonates and also
for matured babies. So far, EEG data of babies up to
eight months are experimented. It can be further
tested and upgraded to include automated burst
detection for children of higher age, and possibly for
adult EEG also. Bursts of minimum one second
duration are detected in our algorithm. It can be
augmented to include sudden spikes of length less
than one second, for any further research.
ACKNOWLEDGEMENTS
This project is funded by Ministry of
Communications and Information Technology,
Government of India; under project grant number
1(4)/2009-ME&TMD. We are thankful to our
colleagues and to the doctors of neonatology
department, SSKM Hospital for helping us in data
collection, marking, and analysis.
BIOSIGNALS 2011 - International Conference on Bio-inspired Systems and Signal Processing
20

REFERENCES
Connell, J. & Oozeer, R. & De Vries, L. S. & Dubowitz,
L. M. S. & Dubowitz, V. (1989). “Continuous EEG
monitoring of neonatal seizures: diagnostic and
prognostic considerations”, in Archives of Disease in
Childhood, 1989, 64, pp. 452-458.
Greene, B. R. & Faul, S. & Marnane, W. P. & Lightbody,
G. & Korotchikova, I. & Boylan, G. B. (2008). A
comparison of quantitative EEG features for neonatal
seizure detection. in J Clin Neurophysiol 2008,
doi:10.1016/j.clinph.2008.02.001
Hellström-Westas, L. & De Vries, L. S. & Rosén, I.
(2008). Atlas of Amplitude Integrated EEGs in the
newborn, informa healthcare. UK, 2nd edition, ISBN-
13: 978 1 84184 649 1
Löfhede, J. & Löfgren, N. & Thordstein, M. & Flisberg,
A. & Kjellmer, I. & Lindecrantz, K. (2008).
Classification of burst and suppression in the neonatal
electroencephalogram. in J Neural Eng 2008;5:402–
10.
Löfhede, J. & Thordstein, M. & Löfgren, N. & Flisberg,
A. & Rosa-Zurera, M. & Kjellmer, I. & Lindecrantz,
K. (2010). Automatic classification of background
EEG activity in healthy and sick neonates. in J. Neural
Eng. 7 (2010) 016007
Maynard, D. E. & Prior, P. F. & Scott, D. F. (1969),
Device for continuous monitoring of cerebral activity
in resuscitated patients. in Br Med J 1969;4:545-6.
Palmu, K. et al. (2010) Detection of ‘EEG bursts’ in the
early preterm EEG: Visual vs. automated detection. in
J Clin Neurophysiol 2010, doi:10.1016/j.clinph
.2010.02.010
Prior, P. F. & Maynard, D. E. & Sheaff, P. et al. (1971).
Monitoring cerebral function: Clinical experience with
new device of continuous recording of electrical
activity of brain. in Br Med J 1971;2:736-8.
Rennie, J. M. & Hagmann, C. F. & Robertson, N. J.
(2008). Neonatal Cerebral Investigation, Cambridge
University Press. New York, 1st edition, ISBN-13
978-0-511-41368-1
Sanei, S. & Chambers, J. A. (2007). EEG Signal
Processing, John Wiley & Sons. England, ISBN-13
978-0-470-02581-9
Särkelä, M. & Mustola, S. & Seppänen, T. & Koskinen,
M. & Lepola, P. & Suominen, K. & Juvonen, T. &
Tolvanen-Laakso, H. & Jäntti, V. (2002). Automatic
Analysis and Monitoring of Burst Suppression in
Anesthesia. in J Clin Monit Comput 2002;17:125–34.
Wang, Y. & Agarwal, R. (2007). Automatic Detection of
Burst Suppression. in IEEE EMBS INTL Conf Aug
2007.
Welch, P. D. (1967). The Use of Fast Fourier Transform
for the Estimation of Power Spectra: A Method Based
on Time Averaging Over Short, Modified
Periodograms. in IEEE Transactions on Audio
Electroacoustics, Volume AU-15 (1967), pages 70–73.
AUTOMATED BURST DETECTION IN NEONATAL EEG
21
